Precious Metals
First Line Of Defense For Assessing Investment Strategy Backtests
There are three basic ways to test an investment strategy. Each has its own unique set of pros and cons, but only one is practical. The best approach is…

There are three basic ways to test an investment strategy. Each has its own unique set of pros and cons, but only one is practical.
The best approach is to develop a strategy and then run it with real money out of sample for at least 3 to 5 years. Longer is even better. That’s the gold standard, but that takes time and so there are obvious limitations. Be careful not to confuse this version of out-of-sample testing with its pseudo out-of-sample cousin, which uses a portion of historical data to build a model and then test it on the remaining unused “out of sample” historical numbers. Useful, but no substitute for the genuine article.
The weakest alternative is to develop a strategy and paper and decide if it passes the smell test. Relatively easy and quick, but here too there are clear challenges, namely, the transition from theory to empirical usually brings many surprises.
The best (or should we say the least worst) alternative is to backtest a strategy. The idea here is that you can have the best of both worlds: a rough approximation in the here and now of how a strategy would have fared if implemented at some point decades ago. Alas, this is no silver bullet either since no backtest can flawlessly tell you how a strategy will perform in the years ahead. But short of acquiring the powers to see into the future, it’s the best that mere mortals can do.
Indeed, the key advantage to historical backtesting: you don’t have to wait years to determine if a strategy is a winner or a dog. Another plus: you’re not totally reliant on theory for assessing how the future may unfold.
The critical issue, of course, is designing a backtest that comes close to replicating the real world through a historical lens. Easier said than done. A poorly designed backtest is usually worse than simply making guesstimates. That’s a crucial hazard since there are more ways to delude yourself with backtests than there are techniques for developing a robust test.
In fact, building a useful backtest is a delicate dance of art and science. Ideally you’ll run many techniques, recognizing that developing useful backtest data and assessing it accurately and objectively is a bit like the tale of the blind men trying to describe an elephant. Approximating the truth requires combining multiple descriptions and perspectives.
In short, there are no silver bullets for building a solid backtest. Quite a bit of successfully building and evaluating historical simulations is avoiding rookie mistakes. One error I see a lot is using a single time window to do the heavy lifting.
For instance, backtesting a strategy that looks impressive over a 2000-2023 sample period may be misleading because it relies heavily on sidestepping much of the 2008-2009 financial crash. But it’s problematic if, after taking out that period or using a post-2009 start date, the strategy falls apart.
There are many ways to guard against this pitfall, including my favorite technique: assembling a backtest using rolling-forward start dates and then assessing all the time-window results for determining the strategy’s stability (or lack thereof) through time.
As an example, consider a simple 60%/40% stock/bond portfolio that’s rebalanced to the target weights at the end of each calendar year. We’ll use SPDR S&P 500 ETF (SPY) and iShares Core U.S. Aggregate Bond ETF (AGG). This toy example begins with a Jan. 1, 2016 start date and calculates the annualized return through Aug. 2, 2023 via daily numbers. The analytics calculates the full period return using a Jan. 2, 2016 start date, and then uses a Jan. 3 start date, and so on. The goal is aggregating all the annualized returns for each time window and evaluate the distribution, as shown in the chart below.
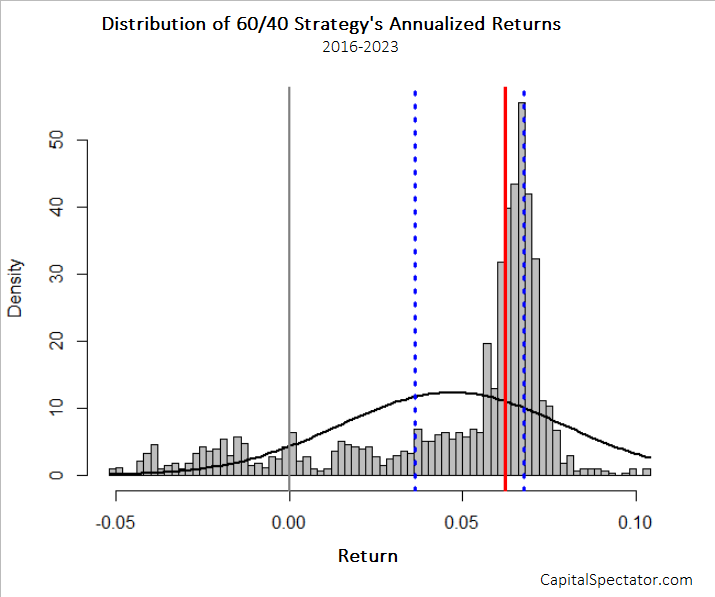
The main takeaway: the performance is heavily skewed toward a moderately positive result. The interquartile range of returns: 3.6% to 6.8%, shown by the two blue lines, with a median of 6.2% (red line). Deciding if this is acceptable, or not, is a bigger question. The point for now is that we’re not relying on one time window, which may be deeply flawed for one reason or another.
If this was robust rolling-forward backtest we’d use a much earlier start date. We’d also run a batter of other analytics before making a final judgment. But as a first step for deciding whether it’s wise to go deeper, or look elsewhere, this is a relatively painless, quick and useful test. By contrast, a backtest that uses one start date may be faulty in the extreme.
Learn To Use R For Portfolio Analysis
Quantitative Investment Portfolio Analytics In R:
An Introduction To R For Modeling Portfolio Risk and Return
By James Picerno


Canadian Silver Co. Will See Big Changes in 2024
Source: Michael Ballanger 12/22/2023
Michael Ballanger of GGM Advisory Inc. takes a look at the current state of the market and shares on stock…
EGR options out Urban Berry project in Quebec to Harvest Gold – Richard Mills
2023.12.23
EGR Exploration Ltd. (TSXV: EGR) has moved from owner to shareholder at its Urban Berry project in Quebec, this week announcing it is optioning…
Crypto, Crude, & Crap Stocks Rally As Yield Curve Steepens, Rate-Cut Hopes Soar
Crypto, Crude, & Crap Stocks Rally As Yield Curve Steepens, Rate-Cut Hopes Soar
A weird week of macro data – strong jobless claims but…
