Companies
Gold Digger: The good, bad, and ugly of ASX gold reporting season
Perseus Mining (ASX:PRU) continues to claim the title of ‘ASX’s Most Consistently Good Gold Producer’ Other ASX miners a mixed bag … Read More
The…
- Perseus Mining (ASX:PRU) continues to claim the title of ‘ASX’s Most Consistently Good Gold Producer’
- Other ASX miners a mixed bag
- Gold is currently at a 2-month low of $US1835/oz
Our Gold Digger column wraps all the news driving ASX stocks with exposure to precious metals.
In a half-year reporting season tarnished by falling profits across the ASX gold sector, Perseus Mining (ASX:PRU) continues to claim the title of ‘ASX’s Most Consistently Good Gold Producer’.
The West African miner saw profit after tax rise 60% to $203m, with EBITDA up 40% to $354.4m and revenue up 22% to $665m for the first half of 2022-23.
The owner of the Sissingue, Yaoure and Edikan gold mines produced 268,371oz at all in site costs of US$930/oz in the December half, selling 261,921oz at average prices of US$1,724/oz.
That supported an interim dividend of 1.06c per share, a payout of around $14.5m, with market guidance of 498,370-528,370oz at AISC of US$1000-1100/oz for FY23.
Gold Road Resources (ASX:GOR) scored a point for the WA gold producers, with investors taking a shine to its strong full year results.
GOR bucked the trend across the gold space, with profits up from $36.8m in 2021 to $63.7m in 2022 on record sales of 156,426oz from its half-share of the Gruyere gold mine.
Realised prices were also up from $2210/oz in 2021 to $2,448/oz in 2022 as GOR cleared out some of the money hedges.
GOR will pay a dividend of 0.5c per share. It has cash and short-term deposits of $74.4m along with liquid investments worth $406.5m, much of that in its strategic 19.99% stake in $2b capped mine developer De Grey (ASX:DEG).
Ramelius Resources (ASX:RMS) has had a tough ride, down over 40% in the past year amid rising cost pressures in the gold sector.
But investors responded well to a “solid set of financial results”.
RMS delivered $32.7m in underlying half year NPAT and $29.1m of NPAT, down from $54.2m and $73.4m respectively but toasted what it said was a still strong EBITDA margin of ~35%.
The big issue for Ramelius was costs and lower gold output, with all in sustaining costs up from $1473/oz to $2044/oz year on year in the first half and production down from 132,605oz to 118,000oz.
That underpinned a drop in EBITDA from $187.7m to $101.1m.
Managing director Mark Zeptner was bullish however on the impact of its new high-grade Penny gold mine over the coming years.
Evolution (ASX:EVN) has shaved its half year dividend from 3c to 2c, paying out $37 million to shareholders.
It comes despite seeing statutory profits lift from $91m last half-year to $101m in 2022-23, with underlying NPAT up from $100m to $103m and EBITDA 13% higher at $446m.
Mine operating cash flow rose from $396m in H1 2022 to $477m in H1 2023, though net mine cash flow fell from $120m to $86m because of $302m of investment in projects, up from $203m in 2021-22.
Higher operating costs were in part driven by the acquisitions of the Kundana mines near Kalgoorlie, now part of its Mungari gold operations, and Glencore’s majority stake in the Ernest Henry copper and gold mine, with major capital investments also in the underground developments at Cowal and Red Lake, both due to begin producing in the June quarter.
EVN produced 327,502oz at all in sustaining costs of $1,307/oz in the first half of 2023, with around $313m cash in the bank as of December 31, down from $572m on June 30.
Northern Star Resources (ASX:NST) announced a record half-year payout despite underlying profit after tax falling 56% to $54.6m in the first half of FY23, with its NPAT tumbling 83% from $276.8m last year to $47.7m.
Analyst consensus NPAT was around $106 million.
That came despite revenue lifting 5% to $1.9487 billion, with EBITDA down a milder 34% to $622.9m and underlying EBITDA off 12% to $632.7m.
CFO Ryan Gurner said the miner, which plans to deliver 1.58-1.68Moz in FY23, had seen a $200/oz lift year on year in operating costs across its combined Kalgoorlie, Yandal and Pogo operations in the first half.
“It’s certainly still challenging, we’re not seeing significant cost reductions albeit we are seeing some reductions, so for instance we’re seeing it on our energy prices — particularly diesel — and some of our input costs that are indexed around steel prices,” Gurner said.
“Broadly though, the other input costs obviously labour is a key cost for our sector as it is the entire mining business. We are seeing those costs still remaining elevated.”
Regis Resources (ASX:RRL), owner of the Duketon gold operations and 30% of AngloGold’s top-tier Tropicana gold mine, ended the year with cash and bullion of $151m after reporting a $30m net loss after tax, a negative swing from a $26m profit in the first half of FY22.
It elected not to pay an interim dividend. Managing director Jim Beyer says improved profit and cash flows are expected over the second half.
After producing 232,147oz at AISC of $1771/oz in H1 FY23, Regis expects to produce 450,000-500,000oz for the full year at the upper end of its $1,525-1,625/oz cost guidance range.
It has also made progress on the long delayed McPhillamy’s project in NSW, which is in the final stages of the State’s Independent Planning Commission’s assessment process. The mine could add 200,000oz of production per annum across a 10-year mine life.
WA gold miners St Barbara (ASX:SBM) and Silver Lake Resources (ASX:SLR) also underperformed.
St Barbara announced an impairment fuelled statutory loss of $407.1m, worsening an underlying loss of $8.6m by writing $420m ($298.2m post tax) and $74.2m respectively off the value of its Atlantic and Simberi gold operations in Canada and PNG.
Those mines will be split off from SBM into a new company called Phoenician Metals as part of its merger with Raleigh Finlayson’s Genesis Minerals (ASX:GMD) to form Hoover House.
The result was a massive swing from a $14m profit in the first half of 2021-22.
Meanwhile, SLR reported a net loss after tax of $14.8m, a swing from a $44.5m NPAT in H1 2022, with EBITDA falling from $157.6m to $73.1m.
SLR says its sales will be weighted to the second half of 2023, with gold sales of 115,790oz at costs of $2153/oz in the first half the smaller portion of its guidance of 260,000-275,000oz at all in sustaining costs of $1950-2050/oz.
SLR produced 126,718oz at $1,597/oz in H1 FY22, with cash and bullion on hand falling from $277.9m to $253.3m year on year, though the Deflector, Sugar Zone and Mt Monger gold mine owner remains debt free.
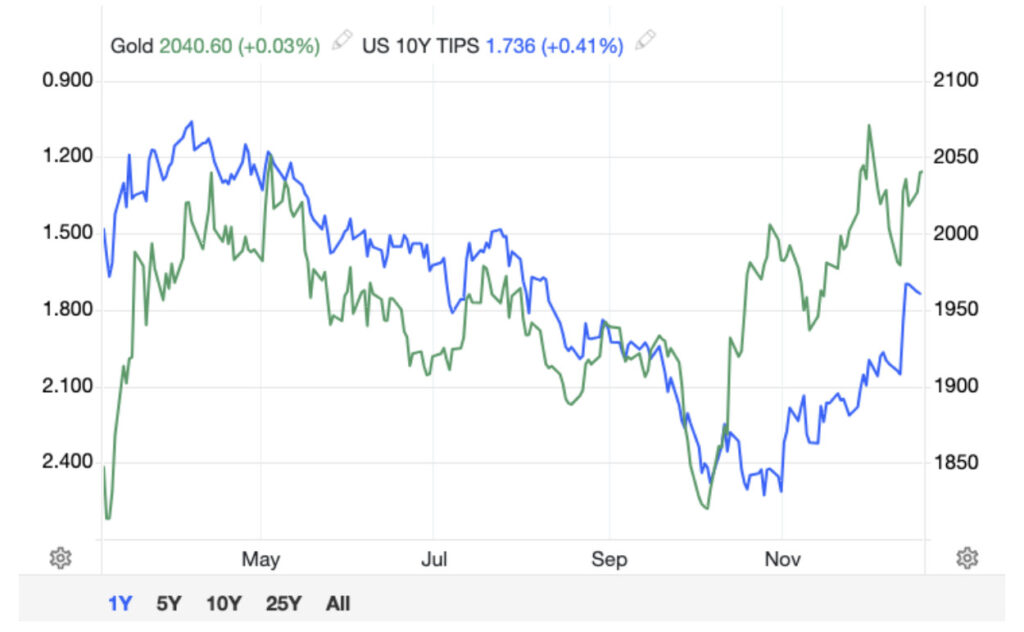
Gold weaker on rate hike worries
Gold is currently at a 2-month low of $US1,835/oz.
It will probably take confirmation that the economy is slowing down faster before prices can muster up a meaningful rally, says OANDA’s Ed Moya.
“A strong dollar will likely keep gold heavy but we could see some relief if tomorrow’s PCE deflator isn’t as hot as some are fearing,” he said Friday morning.
“Gold has massive support around the $1805-1810 region as a plethora of technical indicators indicate oversold conditions.
“If gold breaks below the noted region, bearish momentum might not be exhausted until the $1750 area.”
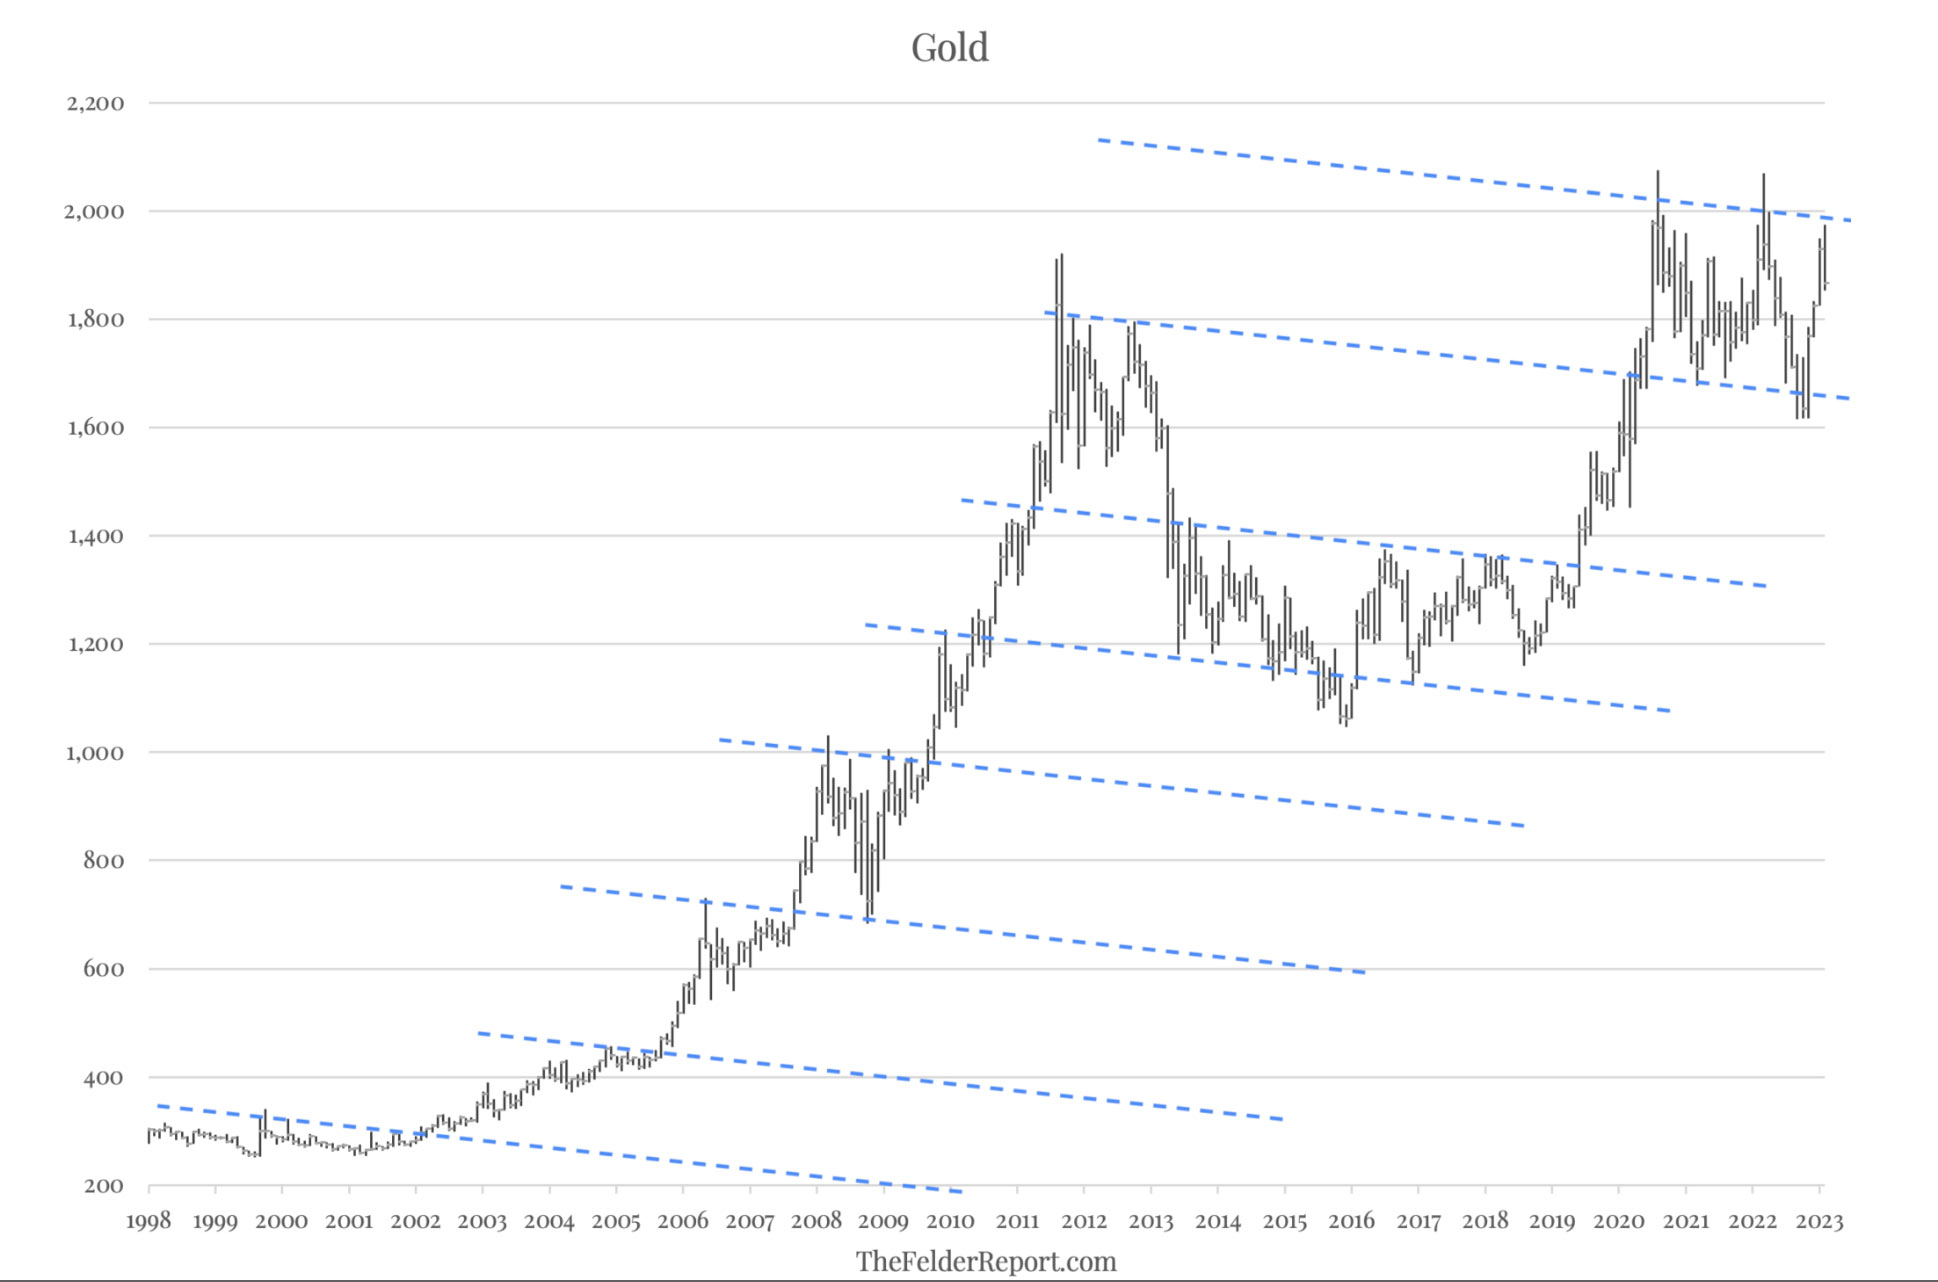
Speaking of technical analysis, veteran money manager Jesse Felder believes his KISS (keep it simple, stupid!) technical analysis indcates good news on the horizon for precious metals.
Ina short note titled ‘Gold Prices Are Knocking On The Door Of New Record Highs’ Felder says he has noticed this very simple stair-step pattern in the trend of gold prices over the past 25 years or so:

“Prices move higher until they reach a ceiling, denoted by a descending trend line, at which point they consolidate for a time,” he says.
“Interestingly, these trend lines have created a series of parallel lines that can help to identify support and resistance areas for future consolidation ranges.”
The action in gold prices over the past couple of years or so has formed yet another consolidation range, Felder says.
“If the bull phase that began in 2016 is to continue, gold prices will breakout and push to new, record highs,” he says. “Conversely, a sustainable breakdown below the recent lows would signify a new bear phase has begun.
“And this is where other indicators and disciplines come in handy. Because the longer inflation remains elevated and the Fed remains behind the curve, the greater the chance of a breakout versus a breakdown.”
Winners & Losers
Here’s how ASX-listed precious metals stocks are performing:
Scroll or swipe to reveal table. Click headings to sort. Best viewed on a laptop.
Stocks missing from this list? Email [email protected]
| CODE | COMPANY | 1 WEEK RETURN % | 1 MONTH RETURN % | 6 MONTH RETURN % | 1 YEAR RETURN % | PRICE | MARKET CAP |
|---|---|---|---|---|---|---|---|
| KNB | Koonenberrygold | 38% | 38% | -7% | -31% | 0.083 | $6,287,785 |
| STK | Strickland Metals | 25% | 5% | -18% | -38% | 0.04 | $60,642,222 |
| MEG | Megado Minerals | 21% | 16% | -50% | -35% | 0.052 | $7,581,945 |
| XTC | Xantippe Res | 20% | 0% | -33% | -40% | 0.006 | $63,480,598 |
| ICG | Inca Minerals | 19% | 0% | -48% | -74% | 0.025 | $13,037,041 |
| TMX | Terrain Minerals | 17% | 17% | 0% | 0% | 0.007 | $7,582,395 |
| HCH | Hot Chili | 15% | -4% | 28% | -27% | 0.99 | $112,875,720 |
| GTR | Gti Energy | 15% | -12% | -23% | -36% | 0.0115 | $16,560,319 |
| BMR | Ballymore Resources | 14% | 3% | -18% | 3% | 0.165 | $15,892,380 |
| DTR | Dateline Resources | 13% | 3% | -66% | -55% | 0.036 | $20,346,643 |
| MEI | Meteoric Resources | 12% | 58% | 1108% | 867% | 0.145 | $190,846,362 |
| AQI | Alicanto Min | 11% | -17% | -2% | -52% | 0.05 | $22,310,681 |
| TAR | Taruga Minerals | 11% | -5% | -26% | -44% | 0.02 | $12,002,455 |
| BC8 | Black Cat Syndicate | 11% | 0% | 4% | -31% | 0.405 | $102,468,502 |
| G50 | Gold50Limited | 11% | -7% | 14% | -16% | 0.21 | $11,958,030 |
| GBR | Greatbould Resources | 10% | 9% | -10% | -37% | 0.095 | $35,770,092 |
| ASO | Aston Minerals | 10% | 8% | 3% | -37% | 0.097 | $108,012,501 |
| BEZ | Besragoldinc | 9% | 0% | 35% | -43% | 0.048 | $16,808,440 |
| KAL | Kalgoorliegoldmining | 8% | -7% | -40% | -50% | 0.078 | $6,039,899 |
| VRC | Volt Resources | 8% | -7% | -32% | -28% | 0.013 | $46,553,087 |
| BCN | Beacon Minerals | 7% | 0% | 7% | -19% | 0.029 | $112,703,045 |
| KCC | Kincora Copper | 7% | -20% | 29% | -44% | 0.075 | $7,288,923 |
| LCY | Legacy Iron Ore | 7% | -6% | -20% | -11% | 0.016 | $102,509,219 |
| GIB | Gibb River Diamonds | 7% | -2% | 18% | 0% | 0.065 | $13,113,586 |
| CLA | Celsius Resource | 6% | -19% | 21% | -32% | 0.017 | $31,572,469 |
| PDI | Predictive Disc | 6% | -8% | -11% | -23% | 0.17 | $312,468,106 |
| OBM | Ora Banda Mining | 6% | 5% | 94% | 49% | 0.105 | $149,708,185 |
| SKY | SKY Metals | 6% | 8% | -17% | -39% | 0.053 | $18,839,174 |
| OKR | Okapi Resources | 6% | 9% | 0% | -33% | 0.18 | $26,595,446 |
| LRL | Labyrinth Resources | 6% | -5% | -28% | -55% | 0.018 | $17,270,772 |
| GUL | Gullewa Limited | 6% | -8% | -8% | -24% | 0.055 | $10,767,521 |
| BGD | Bartongoldholdings | 6% | -14% | 60% | -12% | 0.2325 | $20,051,335 |
| G88 | Golden Mile Res | 5% | -12% | -31% | -58% | 0.022 | $4,500,975 |
| LM8 | Lunnonmetalslimited | 5% | 1% | 11% | 21% | 0.995 | $105,481,082 |
| AM7 | Arcadia Minerals | 5% | -4% | 18% | 5% | 0.23 | $10,273,536 |
| DTM | Dart Mining NL | 5% | -18% | -39% | -52% | 0.046 | $6,536,064 |
| GSN | Great Southern | 5% | -21% | -34% | -58% | 0.023 | $15,260,661 |
| ANX | Anax Metals | 4% | 9% | -9% | -17% | 0.071 | $29,067,033 |
| PNM | Pacific Nickel Mines | 4% | -12% | 9% | -18% | 0.076 | $26,324,294 |
| TSO | Tesoro Gold | 4% | -18% | -25% | -60% | 0.028 | $30,827,419 |
| CPM | Coopermetalslimited | 4% | 21% | -38% | -45% | 0.29 | $12,100,900 |
| TIE | Tietto Minerals | 3% | -15% | 36% | 25% | 0.685 | $739,518,693 |
| PGO | Pacgold | 3% | 6% | -19% | -50% | 0.38 | $20,885,490 |
| EM2 | Eagle Mountain | 3% | -13% | -2% | -65% | 0.205 | $64,043,041 |
| HAW | Hawthorn Resources | 3% | -2% | 23% | 18% | 0.1025 | $34,339,100 |
| PRU | Perseus Mining | 2% | -17% | 20% | 21% | 1.93 | $2,680,227,701 |
| RMS | Ramelius Resources | 2% | -19% | -4% | -41% | 0.87 | $750,993,857 |
| MTC | Metalstech | 2% | 9% | 67% | 122% | 0.5 | $85,944,226 |
| AUC | Ausgold Limited | 2% | -11% | 0% | 9% | 0.05 | $99,444,253 |
| KIN | KIN Min NL | 2% | -5% | -31% | -50% | 0.052 | $61,263,828 |
| VAN | Vango Mining | 2% | 6% | 29% | 39% | 0.053 | $66,776,694 |
| GWR | GWR Group | 2% | -3% | -32% | -64% | 0.058 | $18,630,566 |
| AGC | AGC | 2% | -11% | -17% | -38% | 0.058 | $5,800,000 |
| PNR | Pantoro Limited | 2% | -45% | -67% | -81% | 0.06 | $120,692,976 |
| ALK | Alkane Resources | 2% | -7% | -12% | -31% | 0.645 | $395,203,111 |
| MAU | Magnetic Resources | 1% | -13% | -29% | -50% | 0.7 | $160,658,667 |
| YRL | Yandal Resources | 1% | -9% | -44% | -68% | 0.089 | $14,044,474 |
| MRR | Minrex Resources | 0% | -14% | -44% | -48% | 0.031 | $34,715,760 |
| NPM | Newpeak Metals | 0% | 0% | 0% | 0% | 0.001 | $9,145,132 |
| FFX | Firefinch | 0% | 0% | 0% | -13% | 0.2 | $236,569,315 |
| GED | Golden Deeps | 0% | 0% | -38% | -5% | 0.01 | $11,552,267 |
| DCX | Discovex Res | 0% | 0% | -42% | -63% | 0.0035 | $11,558,988 |
| AQX | Alice Queen | 0% | -25% | -50% | -81% | 0.0015 | $2,530,288 |
| MKG | Mako Gold | 0% | -7% | -38% | -56% | 0.04 | $18,866,054 |
| CST | Castile Resources | 0% | 0% | -20% | -48% | 0.096 | $23,222,633 |
| FAU | First Au | 0% | -20% | -47% | -60% | 0.004 | $4,379,133 |
| IPT | Impact Minerals | 0% | -18% | 6% | -26% | 0.009 | $19,850,964 |
| BBX | BBX Minerals | 0% | 20% | 95% | 11% | 0.15 | $76,061,829 |
| SMS | Starmineralslimited | 0% | -22% | -25% | -65% | 0.07 | $2,070,600 |
| PRX | Prodigy Gold NL | 0% | 0% | -10% | -46% | 0.012 | $20,974,594 |
| ZNC | Zenith Minerals | 0% | -6% | -22% | -34% | 0.23 | $80,892,390 |
| SIH | Sihayo Gold Limited | 0% | -50% | -50% | -83% | 0.001 | $6,102,128 |
| AVM | Advance Metals | 0% | -25% | 0% | -47% | 0.009 | $5,220,397 |
| MCT | Metalicity Limited | 0% | 0% | -40% | -55% | 0.003 | $8,730,098 |
| CTO | Citigold Corp | 0% | -17% | -29% | -50% | 0.005 | $14,168,295 |
| TRY | Troy Resources | 0% | 0% | 0% | 0% | 0.0295 | $62,920,961 |
| CGN | Crater Gold Min | 0% | 0% | 0% | 0% | 0.017 | $21,063,474 |
| ADV | Ardiden | 0% | -13% | -13% | -42% | 0.007 | $18,818,347 |
| NAE | New Age Exploration | 0% | -13% | 17% | -50% | 0.007 | $8,615,393 |
| VKA | Viking Mines | 0% | 38% | 57% | -21% | 0.011 | $11,277,843 |
| MTH | Mithril Resources | 0% | 0% | -40% | -75% | 0.003 | $9,789,271 |
| PGD | Peregrine Gold | 0% | -27% | -48% | -22% | 0.43 | $16,668,042 |
| AL8 | Alderan Resource | 0% | -22% | -22% | -68% | 0.007 | $4,047,863 |
| TBA | Tombola Gold | 0% | 0% | -24% | -10% | 0.026 | $33,129,243 |
| BM8 | Battery Age Minerals | 0% | 0% | 0% | 19% | 0.5 | $37,851,263 |
| RDN | Raiden Resources | 0% | -17% | -38% | -71% | 0.005 | $8,272,912 |
| SFM | Santa Fe Minerals | 0% | 0% | -7% | -62% | 0.075 | $5,461,409 |
| SI6 | SI6 Metals Limited | 0% | -17% | -38% | -50% | 0.005 | $7,476,973 |
| KWR | Kingwest Resources | 0% | -9% | -43% | -78% | 0.039 | $10,987,346 |
| RVR | Red River Resources | 0% | 0% | -46% | -67% | 0.073 | $37,847,908 |
| RGL | Riversgold | 0% | -21% | -37% | 10% | 0.022 | $20,800,290 |
| MM8 | Medallion Metals. | 0% | -10% | -26% | -37% | 0.14 | $19,593,708 |
| WMC | Wiluna Mining Corp | 0% | 0% | 0% | -78% | 0.205 | $74,238,031 |
| IDA | Indiana Resources | 0% | -3% | -11% | -10% | 0.056 | $28,067,470 |
| GSM | Golden State Mining | 0% | 2% | -32% | -46% | 0.043 | $4,680,568 |
| NSM | Northstaw | 0% | -18% | 32% | -34% | 0.185 | $22,223,495 |
| MDI | Middle Island Res | 0% | -9% | -38% | -60% | 0.05 | $6,120,911 |
| BAT | Battery Minerals | 0% | -11% | -20% | -56% | 0.004 | $10,273,348 |
| RDS | Redstone Resources | 0% | 0% | 0% | 0% | 0.01 | $7,368,324 |
| CAI | Calidus Resources | 0% | -41% | -61% | -66% | 0.24 | $103,294,447 |
| AVW | Avira Resources | 0% | 0% | -33% | -45% | 0.003 | $6,401,370 |
| XAM | Xanadu Mines | 0% | 0% | -6% | 7% | 0.031 | $43,761,242 |
| CHZ | Chesser Resources | 0% | -6% | 3% | -10% | 0.09 | $52,974,121 |
| GOR | Gold Road Res | 0% | -16% | 11% | -2% | 1.455 | $1,560,945,610 |
| NES | Nelson Resources. | 0% | -14% | -45% | -67% | 0.006 | $3,531,566 |
| SPQ | Superior Resources | 0% | -17% | -14% | 43% | 0.06 | $100,372,005 |
| GNM | Great Northern | 0% | 33% | -20% | -33% | 0.004 | $5,981,678 |
| KRM | Kingsrose Mining | 0% | -7% | 18% | -7% | 0.066 | $48,914,224 |
| TRM | Truscott Mining Corp | 0% | 138% | 303% | 353% | 0.145 | $24,237,774 |
| DEX | Duke Exploration | 0% | 0% | -13% | -68% | 0.053 | $5,587,240 |
| ENR | Encounter Resources | 0% | -13% | -13% | -3% | 0.14 | $49,773,609 |
| SNG | Siren Gold | 0% | -29% | -43% | -50% | 0.125 | $18,124,939 |
| BRB | Breaker Res NL | 0% | -17% | 30% | 14% | 0.285 | $93,097,036 |
| ANL | Amani Gold | 0% | 0% | -33% | -33% | 0.001 | $24,693,441 |
| GCY | Gascoyne Res | 0% | 0% | -44% | -30% | 0.195 | $83,082,880 |
| ORN | Orion Minerals | 0% | 9% | -8% | -44% | 0.0175 | $78,463,269 |
| SSR | SSR Mining Inc. | 0% | -18% | -2% | -18% | 20.09 | $378,249,636 |
| SFR | Sandfire Resources | -1% | 0% | 30% | -12% | 6.25 | $2,910,401,581 |
| CHN | Chalice Mining | -1% | -6% | 47% | -13% | 6.2 | $2,337,737,075 |
| AAR | Astral Resources NL | -1% | -1% | -1% | -32% | 0.074 | $50,571,158 |
| ERM | Emmerson Resources | -1% | -8% | -22% | -42% | 0.073 | $39,763,815 |
| NMR | Native Mineral Res | -1% | -31% | -44% | -70% | 0.067 | $8,049,295 |
| CY5 | Cygnus Metals | -1% | -19% | 65% | 69% | 0.33 | $54,242,893 |
| ARL | Ardea Resources | -2% | -21% | -30% | -11% | 0.63 | $105,474,205 |
| X64 | Ten Sixty Four | -2% | -15% | -2% | -28% | 0.57 | $130,184,182 |
| ADT | Adriatic Metals | -2% | -4% | 47% | 53% | 3.19 | $702,423,939 |
| MLS | Metals Australia | -2% | -15% | -6% | 14% | 0.05 | $30,351,810 |
| SVY | Stavely Minerals | -2% | -4% | 52% | -40% | 0.25 | $81,537,179 |
| RSG | Resolute Mining | -2% | -16% | -9% | -1% | 0.24 | $510,961,577 |
| TBR | Tribune Res | -2% | -13% | -4% | -23% | 3.52 | $185,212,312 |
| KCN | Kingsgate Consolid. | -2% | -17% | -5% | 10% | 1.48 | $335,300,486 |
| AUT | Auteco Minerals | -2% | -28% | -13% | -48% | 0.042 | $95,879,125 |
| TG1 | Techgen Metals | -2% | -12% | -54% | -22% | 0.082 | $4,401,538 |
| CBY | Canterbury Resources | -2% | 18% | -9% | -47% | 0.04 | $5,760,941 |
| POL | Polymetals Resources | -3% | -5% | 28% | 48% | 0.185 | $8,810,625 |
| MGV | Musgrave Minerals | -3% | -16% | -33% | -44% | 0.18 | $103,461,391 |
| GBZ | GBM Rsources | -3% | -32% | -36% | -69% | 0.036 | $21,947,858 |
| KZR | Kalamazoo Resources | -3% | -21% | -24% | -45% | 0.17 | $24,555,197 |
| DEG | De Grey Mining | -3% | -16% | 42% | 13% | 1.32 | $2,099,769,501 |
| SBR | Sabre Resources | -3% | -31% | -45% | -27% | 0.033 | $9,619,044 |
| TCG | Turaco Gold Limited | -3% | 2% | -9% | -40% | 0.063 | $27,373,867 |
| GAL | Galileo Mining | -3% | -16% | -23% | 290% | 0.78 | $154,147,443 |
| GMR | Golden Rim Resources | -3% | -6% | -30% | -69% | 0.031 | $17,747,651 |
| TLM | Talisman Mining | -3% | -9% | -6% | -17% | 0.15 | $29,099,622 |
| CAZ | Cazaly Resources | -3% | -12% | -28% | -31% | 0.029 | $10,782,832 |
| MI6 | Minerals260Limited | -3% | -19% | -10% | -36% | 0.29 | $63,800,000 |
| A1G | African Gold . | -3% | -4% | 13% | -54% | 0.086 | $13,045,604 |
| VMC | Venus Metals Cor | -3% | -10% | -20% | -26% | 0.14 | $25,821,409 |
| CEL | Challenger Exp | -4% | -23% | -31% | -61% | 0.135 | $141,185,030 |
| RND | Rand Mining | -4% | -5% | -6% | -13% | 1.36 | $77,351,307 |
| CYL | Catalyst Metals | -4% | -4% | 9% | -27% | 1.36 | $130,946,677 |
| HAV | Havilah Resources | -4% | -7% | 3% | 112% | 0.35 | $110,823,724 |
| AMI | Aurelia Metals | -4% | -27% | -59% | -75% | 0.11 | $129,930,908 |
| BNR | Bulletin Res | -4% | 5% | -15% | -21% | 0.11 | $32,295,021 |
| CDT | Castle Minerals | -4% | 0% | -27% | -61% | 0.022 | $22,988,339 |
| FAL | Falconmetals | -4% | 25% | 48% | -26% | 0.325 | $58,410,000 |
| IGO | IGO Limited | -4% | -11% | 11% | 18% | 13.43 | $10,071,661,913 |
| TGM | Theta Gold Mines | -5% | -9% | -3% | -53% | 0.063 | $38,997,572 |
| FG1 | Flynngold | -5% | -14% | -13% | -47% | 0.083 | $8,332,756 |
| WRM | White Rock Min | -5% | -8% | -27% | -72% | 0.061 | $16,516,593 |
| HMG | Hamelingoldlimited | -5% | -29% | -26% | -35% | 0.1 | $11,000,000 |
| KAI | Kairos Minerals | -5% | -20% | -29% | -13% | 0.02 | $39,281,870 |
| SMI | Santana Minerals | -5% | 11% | -10% | 82% | 0.79 | $116,046,526 |
| SVL | Silver Mines Limited | -5% | -35% | -16% | -32% | 0.1425 | $196,562,750 |
| IVR | Investigator Res | -5% | -23% | -10% | -36% | 0.037 | $54,612,219 |
| DCN | Dacian Gold | -5% | -21% | -9% | -57% | 0.091 | $109,512,084 |
| SVG | Savannah Goldfields | -5% | 13% | -10% | -22% | 0.18 | $35,881,203 |
| NCM | Newcrest Mining | -5% | -2% | 22% | -8% | 22.635 | $20,734,044,670 |
| MXR | Maximus Resources | -5% | -13% | -29% | -46% | 0.035 | $11,166,952 |
| BNZ | Benzmining | -5% | 6% | -15% | -28% | 0.43 | $31,880,107 |
| MEU | Marmota Limited | -6% | -9% | -14% | -2% | 0.042 | $42,352,023 |
| AME | Alto Metals Limited | -6% | -9% | -12% | -20% | 0.064 | $39,833,006 |
| HRN | Horizon Gold | -6% | -7% | -22% | -24% | 0.32 | $40,058,125 |
| ALY | Alchemy Resource | -6% | 0% | -16% | 14% | 0.016 | $18,849,220 |
| HXG | Hexagon Energy | -6% | -6% | -6% | -66% | 0.016 | $8,206,654 |
| WAF | West African Res | -6% | -31% | -33% | -17% | 0.8975 | $921,164,733 |
| AAJ | Aruma Resources | -6% | -27% | -6% | -28% | 0.062 | $10,516,421 |
| CMM | Capricorn Metals | -6% | -24% | -2% | 1% | 3.72 | $1,427,881,065 |
| AZS | Azure Minerals | -6% | -8% | 44% | -24% | 0.295 | $96,939,832 |
| SRN | Surefire Rescs NL | -7% | -7% | -7% | 8% | 0.014 | $22,139,089 |
| EMC | Everest Metals Corp | -7% | -17% | -21% | -41% | 0.083 | $9,153,247 |
| AGG | AngloGold Ashanti | -7% | -21% | 16% | -18% | 5 | $446,930,903 |
| MKR | Manuka Resources. | -7% | -14% | -44% | -76% | 0.081 | $40,726,924 |
| KAU | Kaiser Reef | -7% | -15% | -3% | -18% | 0.165 | $24,088,606 |
| MHC | Manhattan Corp | -7% | -7% | -35% | -54% | 0.0065 | $11,405,299 |
| PRS | Prospech Limited | -7% | -21% | -7% | -51% | 0.026 | $2,295,763 |
| SXG | Southern Cross Gold | -7% | -6% | 68% | 0% | 0.645 | $57,488,618 |
| E2M | E2 Metals | -7% | -24% | -17% | -40% | 0.125 | $24,891,540 |
| REZ | Resourc & En Grp | -8% | -20% | -40% | -73% | 0.012 | $5,997,669 |
| M2R | Miramar | -8% | -8% | -47% | -56% | 0.072 | $5,089,085 |
| ARN | Aldoro Resources | -8% | -22% | -25% | -54% | 0.18 | $20,888,779 |
| GMD | Genesis Minerals | -8% | -25% | -16% | -32% | 1.055 | $442,279,624 |
| HRZ | Horizon | -8% | -9% | -23% | -54% | 0.058 | $36,125,080 |
| HMX | Hammer Metals | -8% | -4% | 15% | 3% | 0.069 | $55,444,996 |
| WCN | White Cliff Min | -8% | -15% | -4% | -59% | 0.011 | $8,624,599 |
| FML | Focus Minerals | -8% | -13% | 18% | -40% | 0.165 | $47,282,176 |
| QML | Qmines Limited | -8% | -13% | 18% | -42% | 0.165 | $14,884,490 |
| THR | Thor Energy PLC | -8% | -21% | -39% | -58% | 0.0055 | $8,853,677 |
| CDR | Codrus Minerals | -8% | -12% | 25% | -15% | 0.11 | $4,649,450 |
| SAU | Southern Gold | -8% | -19% | -35% | -61% | 0.022 | $6,305,991 |
| EVN | Evolution Mining | -8% | -16% | 10% | -35% | 2.72 | $5,101,345,367 |
| SLR | Silver Lake Resource | -9% | -30% | -24% | -44% | 1.015 | $971,582,828 |
| EMR | Emerald Res NL | -9% | -3% | 20% | 24% | 1.375 | $819,445,357 |
| KTA | Krakatoa Resources | -9% | -5% | -35% | -2% | 0.041 | $13,788,397 |
| CWX | Carawine Resources | -9% | -20% | -9% | -53% | 0.1 | $19,681,747 |
| RMX | Red Mount Min | -9% | 0% | -29% | -50% | 0.005 | $11,359,255 |
| ZAG | Zuleika Gold | -9% | -17% | -29% | -56% | 0.015 | $7,845,759 |
| NST | Northern Star | -9% | -19% | 35% | 3% | 10.335 | $12,005,430,602 |
| RXL | Rox Resources | -9% | -26% | -43% | -65% | 0.145 | $32,531,368 |
| WGX | Westgold Resources. | -9% | -30% | -22% | -58% | 0.91 | $452,309,707 |
| KSN | Kingston Resources | -10% | -27% | 16% | -42% | 0.095 | $41,565,366 |
| ICL | Iceni Gold | -10% | -14% | -4% | -17% | 0.095 | $12,819,643 |
| BTR | Brightstar Resources | -10% | -24% | 12% | -32% | 0.019 | $14,924,319 |
| S2R | S2 Resources | -10% | -22% | -3% | -22% | 0.14 | $49,962,480 |
| ADG | Adelong Gold Limited | -10% | -31% | -55% | -70% | 0.009 | $5,071,312 |
| GMN | Gold Mountain | -10% | -25% | -25% | -50% | 0.0045 | $9,849,663 |
| TAM | Tanami Gold NL | -10% | -14% | -18% | -40% | 0.036 | $43,478,591 |
| NAG | Nagambie Resources | -10% | 0% | -11% | 10% | 0.054 | $29,463,159 |
| A8G | Australasian Metals | -10% | -10% | -42% | -64% | 0.175 | $6,998,984 |
| SLZ | Sultan Resources | -10% | -36% | -61% | -65% | 0.052 | $4,330,788 |
| PUR | Pursuit Minerals | -10% | 24% | 73% | 24% | 0.026 | $28,563,746 |
| LEX | Lefroy Exploration | -10% | -10% | -25% | -34% | 0.215 | $36,103,050 |
| NML | Navarre Minerals | -11% | -17% | -29% | -63% | 0.034 | $48,887,891 |
| NVA | Nova Minerals | -11% | -18% | -36% | -40% | 0.55 | $117,630,313 |
| DRE | Dreadnought Resources | -11% | -13% | -18% | 100% | 0.082 | $283,260,627 |
| WWI | West Wits Mining | -11% | -33% | -29% | -74% | 0.012 | $27,978,347 |
| MOM | Moab Minerals | -11% | -20% | -71% | -71% | 0.008 | $6,137,671 |
| RRL | Regis Resources | -11% | -24% | 8% | -11% | 1.71 | $1,347,721,276 |
| GSR | Greenstone Resources | -12% | -32% | -68% | -36% | 0.023 | $28,984,295 |
| SPD | Southernpalladium | -12% | -28% | -21% | 0% | 0.575 | $24,770,038 |
| MRZ | Mont Royal Resources | -12% | 12% | -32% | -44% | 0.19 | $13,011,707 |
| STN | Saturn Metals | -12% | -24% | -47% | -65% | 0.145 | $23,490,021 |
| TUL | Tulla Resources | -12% | -34% | -53% | -59% | 0.25 | $55,340,597 |
| BGL | Bellevue Gold | -12% | -22% | 23% | 8% | 0.99 | $1,151,707,267 |
| RML | Resolution Minerals | -13% | -22% | -30% | -61% | 0.007 | $7,558,223 |
| CXU | Cauldron Energy | -13% | 0% | -28% | -62% | 0.007 | $6,520,976 |
| MAT | Matsa Resources | -13% | 5% | -5% | -36% | 0.041 | $16,480,185 |
| NXM | Nexus Minerals | -13% | -21% | -26% | -48% | 0.17 | $58,581,596 |
| TTM | Titan Minerals | -13% | -25% | 3% | -48% | 0.06 | $87,498,938 |
| MBK | Metal Bank | -13% | -51% | -56% | -60% | 0.02 | $5,806,196 |
| AAU | Antilles Gold | -13% | -18% | -31% | -59% | 0.033 | $15,106,630 |
| WA8 | Warriedarresour | -13% | 3% | 27% | -13% | 0.165 | $64,658,822 |
| MEK | Meeka Metals Limited | -13% | -25% | -44% | -15% | 0.045 | $49,110,011 |
| SBM | St Barbara Limited | -14% | -39% | -42% | -61% | 0.55 | $457,263,321 |
| MVL | Marvel Gold Limited | -14% | -25% | -38% | -63% | 0.018 | $13,396,793 |
| RDT | Red Dirt Metals | -14% | -23% | -24% | -32% | 0.39 | $171,289,384 |
| PKO | Peako Limited | -14% | -20% | -37% | -29% | 0.012 | $4,550,583 |
| LYN | Lycaonresources | -15% | -13% | -23% | -36% | 0.23 | $7,242,125 |
| MZZ | Matador Mining | -15% | -33% | -30% | -72% | 0.08 | $26,635,991 |
| FEG | Far East Gold | -15% | -27% | -27% | 0% | 0.33 | $44,565,909 |
| PNT | Panthermetals | -16% | -18% | -32% | -27% | 0.16 | $4,612,500 |
| BYH | Bryah Resources | -16% | -16% | -22% | -55% | 0.021 | $5,906,323 |
| PUA | Peak Minerals | -17% | 0% | -44% | -55% | 0.005 | $5,206,883 |
| GML | Gateway Mining | -18% | -34% | -46% | -62% | 0.046 | $12,095,344 |
| MOH | Moho Resources | -20% | -24% | -38% | -68% | 0.016 | $3,322,595 |
| ASR | Asra Minerals | -20% | -29% | -37% | -56% | 0.012 | $19,072,543 |
| GRL | Godolphin Resources | -21% | -35% | -19% | -38% | 0.071 | $8,759,339 |
| LCL | Los Cerros Limited | -23% | -30% | -9% | -73% | 0.03 | $25,940,144 |
| RED | Red 5 Limited | -24% | -46% | -51% | -59% | 0.13 | $377,030,256 |
| ARV | Artemis Resources | -24% | -41% | -54% | -79% | 0.016 | $22,262,694 |
| PNX | PNX Metals Limited | -25% | -20% | -20% | -42% | 0.003 | $13,332,173 |
| EMU | EMU NL | -25% | -43% | -67% | -75% | 0.003 | $2,061,804 |
| TMZ | Thomson Res | -25% | -73% | -76% | -90% | 0.006 | $5,654,682 |
| AYM | Australia United Min | -25% | -25% | -50% | -50% | 0.003 | $5,527,732 |
| M24 | Mamba Exploration | -26% | -35% | 45% | -29% | 0.1375 | $10,672,084 |
| BMO | Bastion Minerals | -27% | -30% | -68% | -77% | 0.038 | $5,567,122 |
| OZM | Ozaurum Resources | -28% | -32% | -55% | -57% | 0.052 | $7,112,000 |
| AWJ | Auric Mining | -29% | -20% | -50% | -55% | 0.045 | $5,888,682 |
| NWM | Norwest Minerals | -39% | -37% | -15% | -30% | 0.039 | $8,217,973 |
| CLZ | Classic Min | -40% | -63% | -85% | -98% | 0.003 | $3,695,493 |
| OAU | Ora Gold Limited | -50% | -40% | -47% | -73% | 0.003 | $2,952,694 |
The post Gold Digger: The good, bad, and ugly of ASX gold reporting season appeared first on Stockhead.
asx
ax
gold
silver
copper
iron
tsx-ssrm
ssr-mining-inc
ssr mining inc


Dolly Varden consolidates Big Bulk copper-gold porphyry by acquiring southern-portion claims – Richard Mills
2023.12.22
Dolly Varden Silver’s (TSXV:DV, OTCQX:DOLLF) stock price shot up 16 cents for a gain of 20% Thursday, after announcing a consolidation of…
Gold Digger: ‘Assured growth’ – central bank buying spree set to drive gold higher in 2024
Central banks will drive the price of gold higher in 2024, believe various analysts Spot gold prices seem stable to … Read More
The post Gold Digger:…

GoldTalks: Going big on ASX-listed gold stocks
Aussie investors are spoiled for choice when it comes to listed goldies, says Kyle Rodda. Here are 3 blue chips … Read More
The post GoldTalks: Going…