Uncategorized
What the World Gold Council’s report on surging OTCs may mean for faith in bullion markets?
The World Gold Council released its Gold Demand Trends Q2 2023 report earlier this week. Demand-wise, central bank appetite slightly weakened after last…

The World Gold Council released its Gold Demand Trends Q2 2023 report earlier this week.
Demand-wise, central bank appetite slightly weakened after last year’s record purchases, leading to a drop of 2% YoY to 921 tons.
However, when taken together with OTC transactions, aggregate demand was actually up by 7% YoY to 1,255 tons in Q2 2023.
OTC are over-the-counter trades that take place directly between parties and not on an exchange.
Investment flows into gold improved significantly over the previous year, while jewellery sales and coin demand remained robust.
Total mine production is still below Q4 2022 levels of 948.5 tons, but 4% up on the year at 923.4 tons.
Demand drivers
Key market demand was split across central banks, investment demand, jewellery consumption and technology.
Central banks
Net purchases by central banks slowed 35% over Q2 2022, after last year’s historic surge in buying activity.
Net purchasing volumes declined to 102.9 tons versus 158.6 tons twelve months ago.
However, Q3 2022, Q4 2022 And Q1 2023 central bank purchases were considerably higher at 458.8 tons, 381.8 tons and 284 tons, respectively.
Yet, first-half central bank demand reached record levels, registering the highest H1 demand since 2000, at 387 tons.
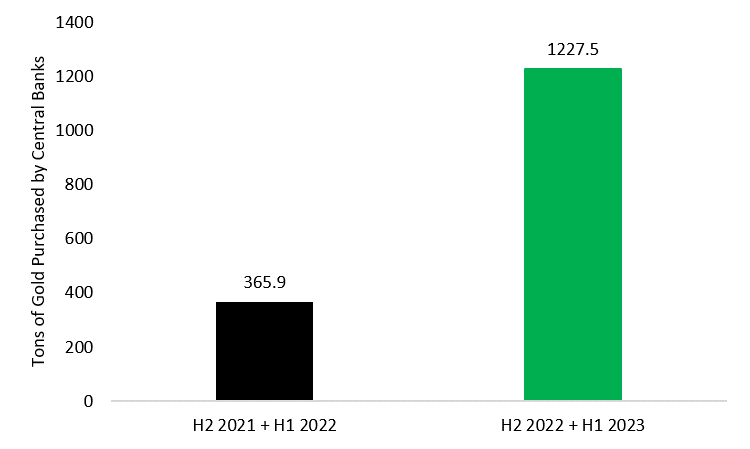
The resilience of the H1 2023 purchases follows the explosion of central bank demand in H2 2022, adding 60.4% to stocks over H1 2022.
Combining data from H2 2022 and H1 2023, we see an enormous 235% YoY increase in central bank purchases.
In Q2 2023, the largest buyers have been the central bank of Poland at 48.4 tons, followed by the PBoC at 45.1 tons.
The top three buyers for 2023 YTD were China, Singapore, and Poland, with purchases of 102.95 tons, 72.6 tons, and 48.4 tons, respectively.
The Polish authorities have accelerated gold purchases in light of regional and international geopolitical uncertainty, in a bid to balance the country’s sizeable dollar holdings and support wider financial stability.
In 2021, the Bank of Poland President Adam Glapiński announced a plan to increase gold reserves by 100 tons, which seems to be powering Poland’s appetite.
Glapiński noted,
After all, gold is free from credit risk and cannot be devalued by any country’s economic policy. Besides, it is extremely durable, virtually indestructible.
Moreover, gold is often associated with a sense of national pride and strength in many countries, including Poland.
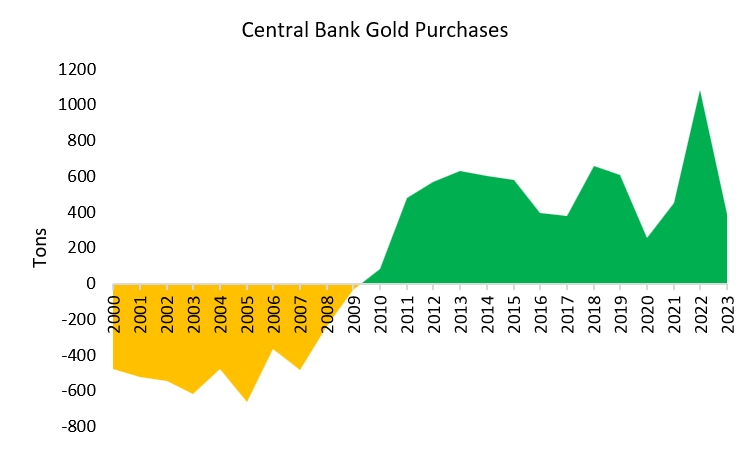
When viewed since 2000, the central banks have flipped from strong net sellers to strong net buyers of physical gold, a trend which is likely to continue.
Turkey
In fact, the decline in demand can largely be attributed to the reversal in Turkey, which sold of 132.3 tons in Q2, after stocking 30.2 tons in Q1 2023.
The World Gold Council notes that this step was taken amid gold bullion import bans in the country, which led to a severely tightened market.
Moreover, this move by the country’s top monetary authority replenished retail channels amid sky-high inflation and a weak lira.
Combined reserves reduction from Kazakhstan, Uzbekistan, Cambodia, Russia, Germany, and Croatia amounted to 73 tons, indicating that Turkey was a considerable outlier during the quarter.
Investment and jewellery
Investment demand was up by a significant 20% compared to Q2 2022, while jewellery consumption increased by 3% YoY.
Under investments, bar and coin demand were up 6% YoY reaching 277.5 tons for the quarter.
This was driven by the 25% YoY increase in official coinage sales to 88.9 tons against physical bars which saw a downturn from 183.4 tons last year to 162.9 tons, a decline of 6%.
This may indicate a rising demand for physical bullion with a bias towards relatively inexpensive options, as prices continue to be within striking distance of the $2,000 mark.
Regional responses
Physical investment which has traditionally been dominated by India and China, saw a decline of 3% YoY a and rise of 32% YoY, respectively.
The tremendous growth in the Chinese market is in large part due to the lifting of strict health restrictions.
US demand for physical bars and coins rose to a 13-year high at 32.2 tons, or 11.6% of global demand in Q2, following the regional banking crisis, and growing anxiety around a possible hard landing.
Europe was the major outlier, as physical demand met with a sharp fall, witnessing a 62% decline, in part due to the hawkish ECB, high prices and optimism that the banking crisis would remain contained.
Germany, which had featured at the top of the physical demand list for H1 2022 having combined purchases of 96.4 tons last year, declined to a 15-year low, plummeting 15% YoY.
In an earlier piece for Invezz, I described some of the unique factors that contributed to Germany’s failing silver coin market in 2023.
Jewellery consumption
In the jewellery segment, demand rose by 3% YoY but was capped by an 8% decline in Indian purchases given record high prices, while the Chinese consumer exercised a rebound of 28% YoY.
OTCs vs ETFs
The OTC investment segment, which refers to transactions that happened outside the formal exchange, was propelled forward and rose by an estimated 335 tons in Q2 2023.
This amounts to a stunning 427% increase over Q1 2023, and a 43.9% rise over Q2 2022.
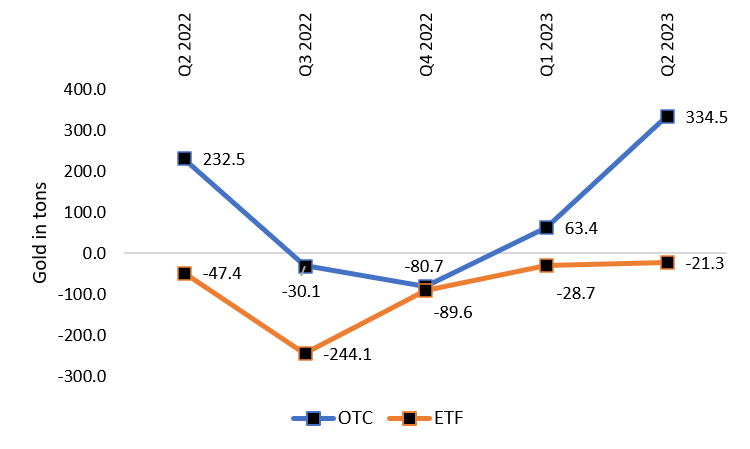
In contrast, ETFs continued to sell-offs, in large part due to European-listed funds unwinding positions amid strong equity markets and hawkish rhetoric, although outflows were less severe than in earlier quarters.
For H1 2023, North America’s ETF inflows of 19.7 tons (driven by the regional banking concerns and debt ceiling chaos) were overwhelmed by European outflows of 69 tons worth USD 210.8 bn.
However, it should be noted that since the OTC segment lies outside the main exchanges and is relatively opaque, accurate market estimates can be challenging.
As a result, the OTC segment is entered as ‘OTC and others’ which includes,
…changes to inventories on commodity exchanges, any unobserved changes in fabrication inventories and any statistical residual.
Given the strong uptrend in central bank demand for physical bullion over the last two years, the heavy aggregate physical outflows from the exchanges, and the surge in OTC data, it is highly likely that support for physical trades is rising significantly.
Technology
Technology demand suffered by 10% YoY, down to 70.4 tons for the quarter from 78.3 tons in Q2 2022, driven by weaker consumers in the electronics industry and dentistry-related manufacturing.
Electronics demand eased from 64.3 tons in Q2 2022 to 56.4 tons in Q2 2023, while for dentistry purposes this declined from 2.6 tons to 2.4 tons
In addition to the current plight of semiconductor supply chains, the electronics segment was hurt by elevated inflation which dampened global demand.
Physical metals acceptance?
Most interestingly, sharply higher OTCs may suggest a trend towards greater acceptance of physical bullion trades rather than on the LBMA or Comex.
Moreover, the jump in OTCs may only be the latest indicator suggesting that faith in metal exchanges is beginning to splinter.
Why might this be happening?
Paper prices which are traded on leading bullion exchanges are the prices of metal derivatives and not the actual metal.
Crucially, paper derivatives, which are traded in place of gold do not represent gold holdings at a 1-to-1 ratio.
As of 1st August 2023, CME data shows that open interest on the Comex (the total futures contracts held by market participants) is more than three and a half times the registered gold which can be delivered.
Primarily, these derivatives are used as a hedging tool or sold off when additional liquidity needs to be unlocked.
Thus, the traded price of these certificates has been divorced from the dynamics of the metal itself.
Andrew Lane, a precious metals writer noted,
Around 95% give or take of Gold owned—not traded—owned across the globe is unallocated gold. That is a staggering statistic.
Unallocated gold is where no physical gold is actually held by the exchange, and more often than not, investors who wish to withdraw their holdings will receive the monetary equivalent at the current market price as payment.
This adds substantial risk for bullion market participants who would like to maintain metal holdings, particularly as a hedge against weakening reserve currencies.
As a result, paper markets have seen consistent outflows over the past year, with investor trust seemingly reaching new lows amid runaway inflation, banking contagion, and financial stability concerns.
The unprecedented jump in the OTC segment may be indicating that a growing section of large gold owners are preferring to transact outside the established exchanges.
In addition, the reputation of paper exchanges in the commodities space has been greatly dented due to the LME’s controversial decision to order the cancellation of nickel trades last year.
Interested readers can find out more about the LME debacle and the subsequent lawsuit here.
Spread of physical exchanges
In 2022, India announced the opening of the India International Bullion Exchange (IIBX) in GIFT City, Gujarat, as a marketplace for physical gold and silver trading.
Other potential alternatives to the LBMA and Comex include Russia’s Moscow World Standard, which was proposed approximately a year ago; and the Chinese Shanghai International Gold Exchange, a physical trading platform which became operational in 2014.
Under the possibility of sanctions, as was the case of Venezuela, gold repatriation from internationally respected vaults has sometimes proved challenging.
Other countries, particularly large gold producers, have taken note of these developments and may be working on their own trade mechanisms.
Outlook
During 2023, central bank demand is likely to remain relatively robust, given the strong impulse of monetary authorities to build up their reserves.
Analysts at the World Gold Council expect a slowdown in full-year investment demand in H2 compared to 2022.
However, given the concerns of spillovers from the US banking crisis as well as projections of slower growth and stubborn inflation amid hawkish rhetoric, physical investment demand may potentially see an uptick.
Over the long run, with other major gold producers such as Peru becoming interested in either starting their own exchange or supporting an external one, the control of the Comex and LBMA’s paper markets is likely to be distributed more broadly, while global trends may shift towards greater physical settlement.
The post What the World Gold Council’s report on surging OTCs may mean for faith in bullion markets? appeared first on Invezz.