Uncategorized
Vertiv’s Margin Story: Waiting For Godot
Despite numerous false starts, investors still expect Vertiv Holdings Co (NYSE:VRT) to improve profitability by increasing margins. Our analysis shows…


Despite numerous false starts, investors still expect Vertiv Holdings Co (NYSE:VRT) to improve profitability by increasing margins. Our analysis shows this is an accounting chimera. Technological change is shrinking high-margin services, irreversibly shifting the business mix further to lower-margin products.
The change in mix explains the need to aggressively book even low margin business to keep adjusted operating profit (AOP) from collapsing beneath the significant SG&A fixed costs.
It is a futile fight fought with questionable accounting reclassifications. The company has quietly and retroactively shifted revenue and gross profit from the product to service segment, masking changes in mix.
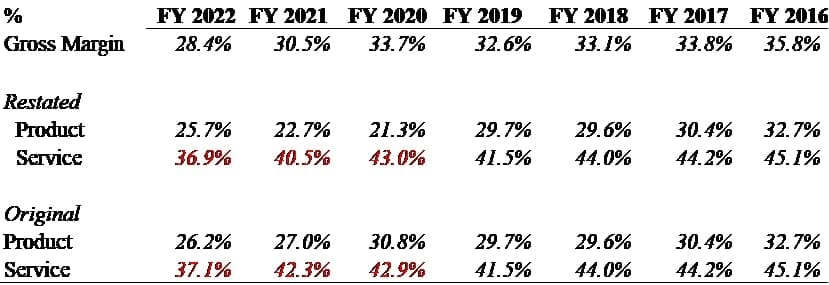
Overall gross margin of 28.4% for FY 22 is a blend of 25.7% product and 37% service margins; over 1100 bps advantage to the latter. In FY 2017, the overall gross margin of 33.8% had a corresponding 30.4% and 44.2% product vs service margin breakdown; a 1400 bps difference.
The decline of service as a percentage of revenue combined with eroding margins in the segment are creating significant headwinds to overall margin improvement.
We estimate that VRT will need to increase gross margins on product between 280 and 540 basis points, depending on different mix scenarios, to meet current FY 23 AOP guidance even when holding the SG&A cost flat.
Given current industry conditions, lingering supply chain issues, inventory valuations and competitive positioning, we regard this as highly improbable.
While investors await the steady ramp in gross margins to achieve 2023 profitability guidance, we believe VRT is once again three quarters away from a predictable disaster. Financial stress is already evident. The company is guiding FY 23 AOP margins at industry trailing 12.3%, and cashflow is challenged at best.
Key Facts
- We estimate that between 40% and 65% of VRT’s gross margin decline between 2017 and 2022 is attributable to the decrease in service margin contribution
- Poorly disclosed and never discussed reclassifications mask the changes in the business mix
- Service gross margins collapsed from 44% in 2017 to 37% as reported in 2022
- The revenue share of services in the overall mix declined from 25% to as low as 20% before reclassifications; it grew only marginally at 8% vs product revenue growth of 35% over the last three fiscal years
- The company’s own analysis points out that the replacement of traditional VRLA with lithium-ion batteries both significantly increases the useful lives and limits the need for maintenance/installation thus pressuring the service segment
- VRT is once again unlikely to achieve its own FY 2023 AOP guidance goals
Stealth Reclassification
In Q1 22, after its big miss, VRT quietly began shifting revenue and gross margin from product to services via reclassifications. It was mentioned in only one sentence in the company’s FY 2022 10-K, filed under the Basis of Presentation section. Below is the disclosure in its entirety:
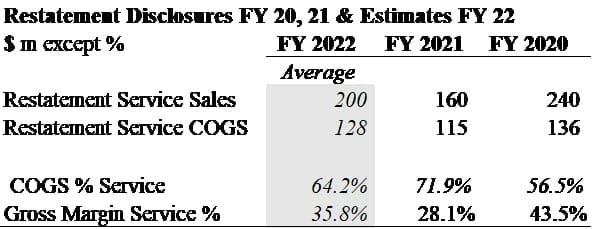
The presentation of certain prior period amounts have been reclassified to conform with current year presentation. For the year ended December 31, 2021 and 2020, $159.9 and $240.1 of net sales and $114.8 and $135.6 of cost of sales from products were reclassified to services, respectively.
In 2020 and 2021, the company reclassified $240M and $160M in revenue, and $136M and $115M in cost of goods, respectively, from the product to the service segment. The shift resulted in $104M and $45M in additional gross profit also being reallocated to services. The reclassifications masked the rapid decline in service contribution, which has historically been a key driver of VRT’s overall profitability.
The company provided reclassification amounts for 2020 and 2021. We estimated the likely 2022 delta with original presentation by applying the average of the two adjustments.
In the table below, we show the restated amounts reported in the 2022 10-K along with the original allocations and our estimate of the reclassified amounts in 2022.
Source: Company disclosures and estimates
The nature of the reclassification is questionable given the significant difference in service’s gross margin shifts: 44% in 2020 but only 28% the following year. It implies an arbitrary rather than systemic nature of the adjustments.
1. Service’s Share in Revenue Mix Is Declining as Growth Stalls
We question the motivation behind making “small” reclassifications in an obfuscated manner. The net effect is to mask a fundamental shift in the business model, the dwindling service component and increasingly product-dominated mix, the result of which is a permanently lower margin profile.
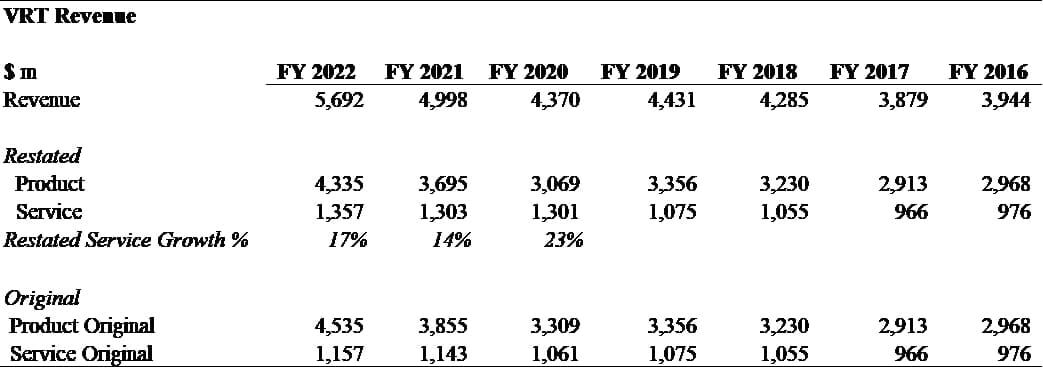
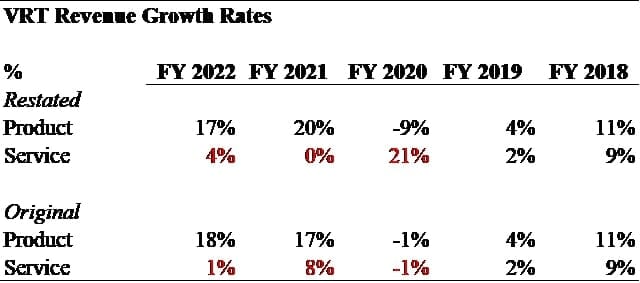
Although small, the revenue adjustments increase service revenues between 14% to 23% in the last three years. Additionally, the shift changes the reported growth rates of the segment significantly.
Absent restatement, services revenue grew only by 8% in the last three years compared to 35% of product sales’ growth. With the new reporting method, service revenue increases from 8% to 26%, close to 29% growth in the service segment. The reclassifications nearly eliminate the growth discrepancy in its entirety.
The figures are shown in the tables below.
Source: Company disclosures and estimates
The business shift has resulted in services revenue declining from 25% to 20% of total before reclassifications. Reclassifications make the 2022 mix comparable with historical averages.
However, the retroactive reclassification in 2020 results in a 70/30 product/service mix, a level of service never achieved. In our view, this suggests reclassifications are made to engineer current mix optics, which are shown below.
Shifting Revenue Mix
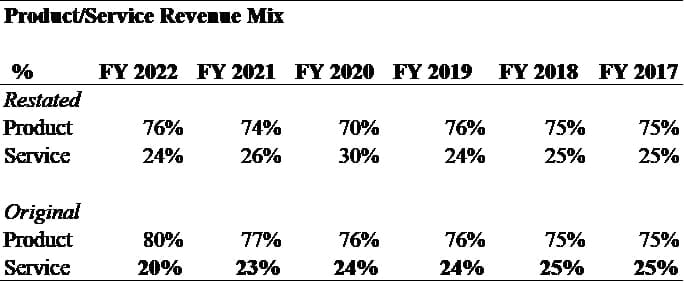
Source: Company filings and estimates.
Vertiv has always prided itself on its superior service. Our channel analysis has confirmed that the company was indeed a leader in the service field. That advantage has historically been key to the company’s profitability and justification of its significant SG&A fixed costs base.
Given the lack of production, scale or logistics advantages, service is key to Vertiv’s viability as a profitable enterprise but almost impossible to keep given technological change, the powerful hyperscale customers in a duopoly plus industry structure.
2. The Decline of Service is the Key Driver of VRT’s Margin Problems
The severe problems with service margins are clearly evident in historical data. In 2017, service gross margins were 44%, almost 1400 basis points higher than product margins. Service margins declined to 37% in 2022. The 700 basis point fall since 2017 was almost double the 380 basis point decline in product margin.
The table below shows the evolution of gross margins by segment over time. We show the segments both as restated in the 2022 10-K and as originally reported (2020 and 2021) and our estimates for 2022.
Gross Margin by Segment
Source: Company filings and estimates.
Service gross margins are declining despite the layoffs, voluntary departures and furloughs of expensive and experienced support as evidenced by glassdoor reviews.
The combination of declining margins and shifts in revenue mix created deeply negative dynamics in the overall gross margins. In the table below, we show the gross margin contribution by segment in 2017 and 2022.
In 2022, we calculate it using both as reported (restated) and using our estimate of the original revenue allocation method. Comparing the two years shows the relative contribution to the overall margin decline.
Segment Contribution to Gross Margin Erosion
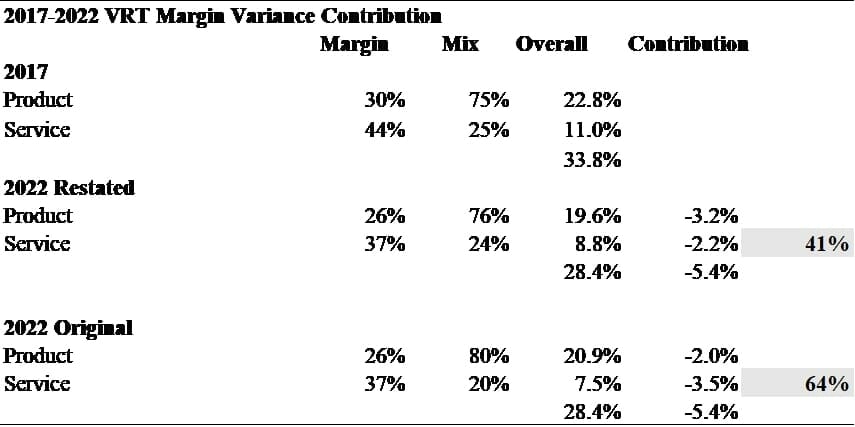
Source: Company filings and estimates.
The table shows that in 2017, service contributed 11% of the total 33.8% gross margin. On an as reported basis in 2022, service’s contribution declined to 8.8% – a decline of 220 basis points. However, using our estimate of the original revenue allocation method, service declined to only 7.5% – a decline of 350 basis points over the 5-year period.
Gross margins declined a total of 540 basis points over the 5-year period. Our estimates indicate that approximately 64% of the gross margin decline was driven by changes in the services segment. Further, absolute gross service profit has been flat over the last five year period before restatements – $427M in 2017 vs. $429M in 2022.
Since 2020 there has been a running dialog between management and the investment community regarding margins. Yet, we cannot recall one instance where service margins were specifically addressed, which is astounding given the segment accounts for the lions-share of gross margin erosion over time.
3. Lithium Ion Batteries Technological Switch Likely Has Significant Impact
VRT’s service segment is dominated by the UPS offerings which is where we believe the problem with shrinking sales/margins originates. We estimate the UPS segment to account for the majority of the service offering although, to our knowledge, the company has never disclosed or discussed the matter.
To test for HVAC service dynamics, we examined the margins of Trane Technologies (TT) an HVAC focused company to get a picture of margins in the service segment. The table below shows TT’s service margins and share of revenue mix have remained stable since 2019.
HVAC Competitor’s Trane Technologies Stable Service Mix and Margins
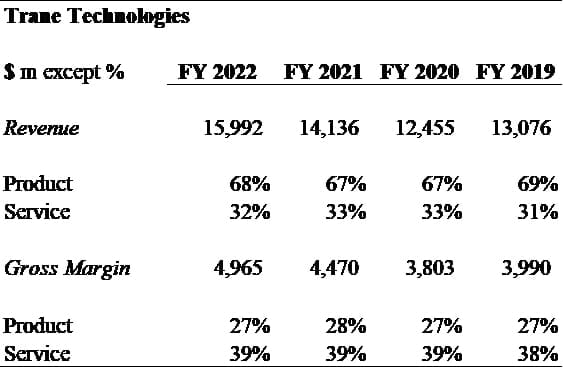
Source: Company filings and estimates.
We hypothesize that lithium Ion batteries are the key culprit. Lithium Ion batteries are great for data centers and the edge, but quite bad for service margins.
The seeds of decline in VRT’s services are evident in the company’s marketing.
Eric Gonzalez, Vertiv Offering Manager Product Development explains the Lithium Ion batteries advantages in terms of longevity lasting 8 to 10 years vs 3 to 5 for the VRLA , “essentially making them maintenance free”.
Total cost of ownership drops 41% from $1,700 to $1,000 largely due to two less product replacements, enables remote monitoring and management thus reducing the need for crews on the premises, they perform better under higher temperature conditions thus reducing cooling needs and are smaller/lighter. They are also easier to install and maintain.
“The choice is clear”.
The technological transition provides customers with a product upgrade, but it comes at the expense of Vertiv’s profitability.
4. Unrealistic Gross Margins Are Embedded in Management’s 2023 Profit Guidance
Given the decline in service margins and stalling sales growth in the segment, the only path to achieve FY 23 AOP is an average product gross margin increase of 280 to 540 bps over FY 22 while holding SG&A constant at Q1 23 levels. We view achieving the guidance as improbable.
The tables below outline the scenarios necessary to achieve guidance. The top panel shows management’s revenue and gross margin guidance assuming marginal absolute year-over-year growth in SG&A.
The middle panel is a matrix showing the gross margin contribution of services for a range of revenue mixes and gross margins. In the last panel, we back out the product gross margin needed to meet guidance.
Guidance, Service Gross Margin Contribution, and Implied Product Margins
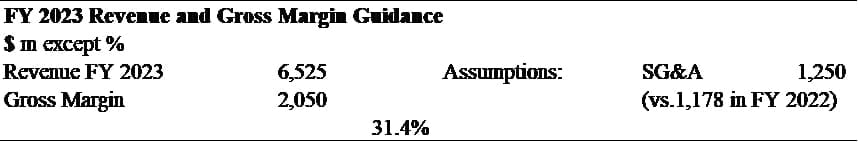
The AOP guidance under marginal growth SG&A scenario implies an overall gross margin of 31.4%.
The first table calculates the overall margin contribution by the service segment with sales revenue mix ranging from 15% to 23% and gross margins varying between 33% and 41%.
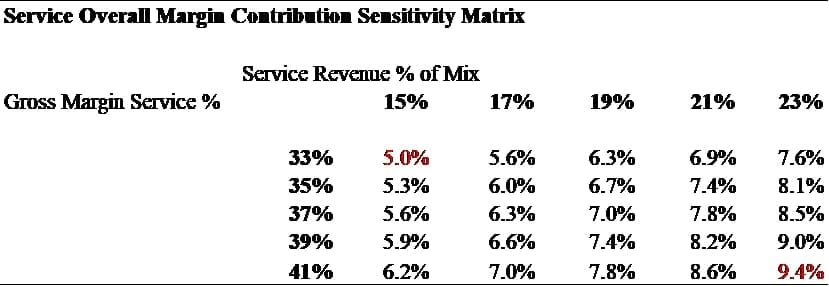
Source: Company filings and estimates.
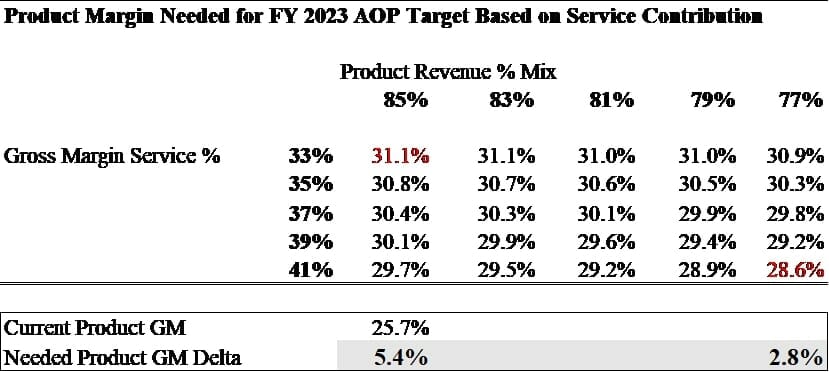
The second table corresponds with the first, showing the average product gross margin necessary to achieve the stated overall goal of 31.4% combined margin given service revenue and margins.
VRT’s products will need to deliver on average between 28.6% and 31.1% compared to the FY 22 product margin of 25.7%. These result in a product gross margin improvement of 2.8% to 5.4% depending on the service mix/margin variability.
Our scenarios are done under the most favorable set of circumstances where SG&A costs do not increase from Q1 23 levels despite the growth in sales and wage/labor inflation shortage/ rep model issues.
Moreover, much of the company’s significant inventory build of 2022 was purchased at or close to peak prices. That expensive inventory should begin to make its way through the system, pressuring margins when guidance implies significant expansion.
Q1 23 results support that conclusion. VRT reported a very high product margin of 30.9% while service continued to dfecline as a share of revenue to now officially reported 22%. The company guided the overall gross margin decline from Q1 23 to the FY 2023 from 32.6% to 31.3%.
VRT has two distinct and contradictory narratives. The explicit story is that margins will at long last expand. At the same time, quiet reclassifications obscure the decline in a key driver of profitability.
We are reminded of the Samuel Beckett’s play Waiting for Godot. While a lengthy discussion of issues – none of any apparent significance – is going on between Estragon and Vladimir, the titular Godot NEVER arrives.