Precious Metals
Will Rising Oil Prices Smack the S&P 500?
As the market and economy cheer the rise in GDP, we can thank consumer spending: 70% of GDP, services (what consumer pay for in aid, help or information):…

As the market and economy cheer the rise in GDP, we can thank consumer spending: 70% of GDP, services (what consumer pay for in aid, help or information): 45% of GDP and government spending: about 19% of GDP.
Hence, one sector to watch carefully is retail or our Granny XRT.
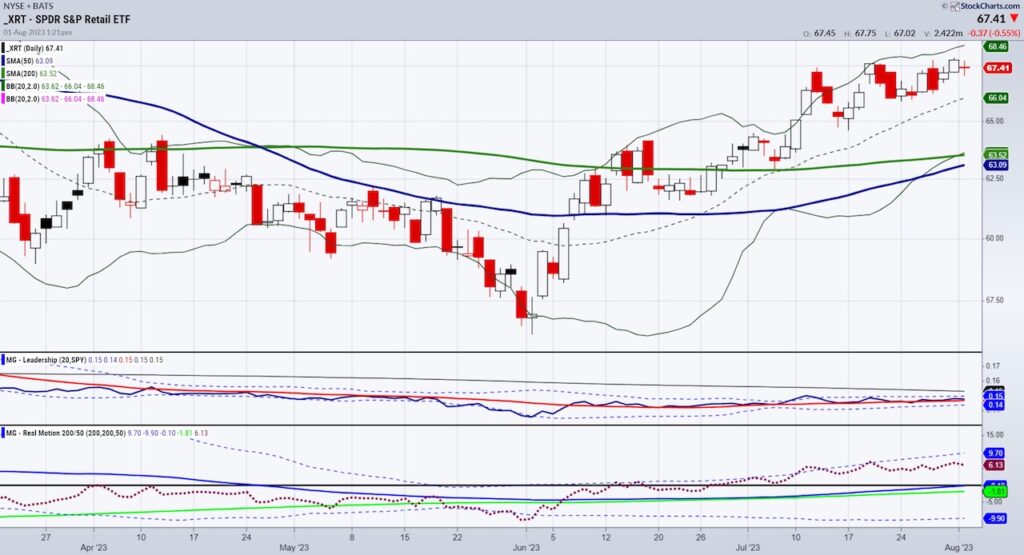
The ETF XRT is still well underperforming the SPY over the course of this year.
However, considering that, XRT looks ready to enter a bull phase with a golden cross.
Furthermore, as measured by our Leadership indicator, XRT is slightly outperforming the SPY.
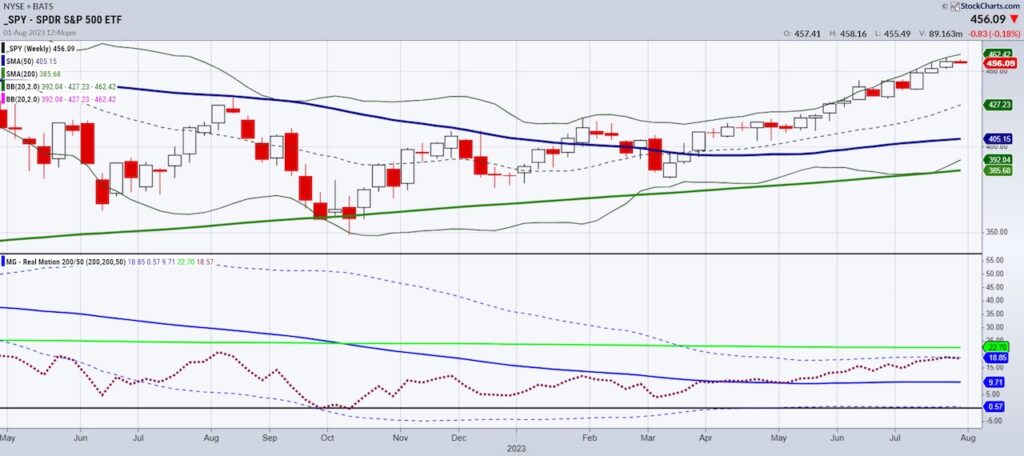
The SPY chart is signaling a mean reversion sell signal potential, but otherwise, looks good as long as it holds 452-its July calendar range high.
XRT also sits at an inflection point as the July 6-month calendar range high is at current price levels.
While yields and oil prices rise, that could hurt consumers.
For how long can the “Fed will pause/pivot in 2024” sentiment give markets and consumers hope if yields and oil both remain high?
For now, XRT shows more optimism than not. We will look at that chart carefully this month.
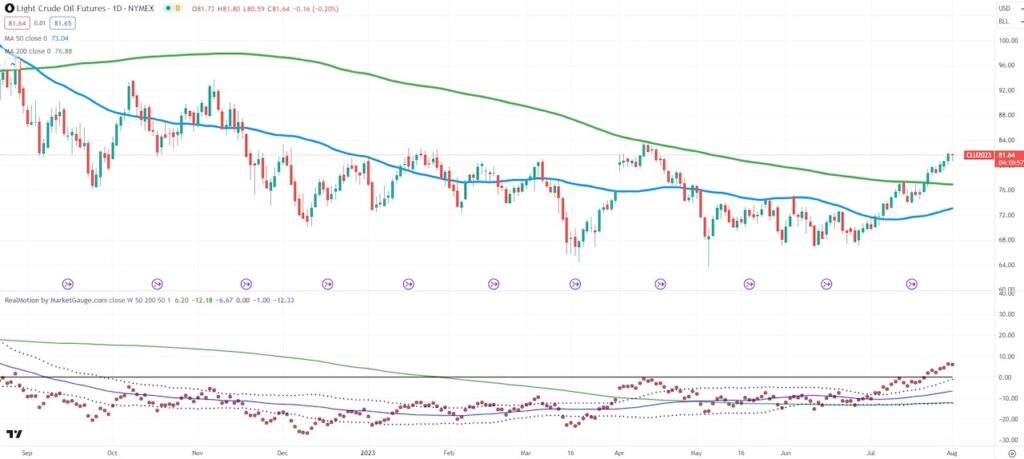
Oil is over $81 a barrel. We know if that continues, CPI PPI PCE-all of it will go up during the next round of economic releases.
That should curtail “Fed will pause” enthusiasm even if they do pause.
And clearly, high rates and high energy prices are bad for consumers.
Where should we look then to see what might happen next?
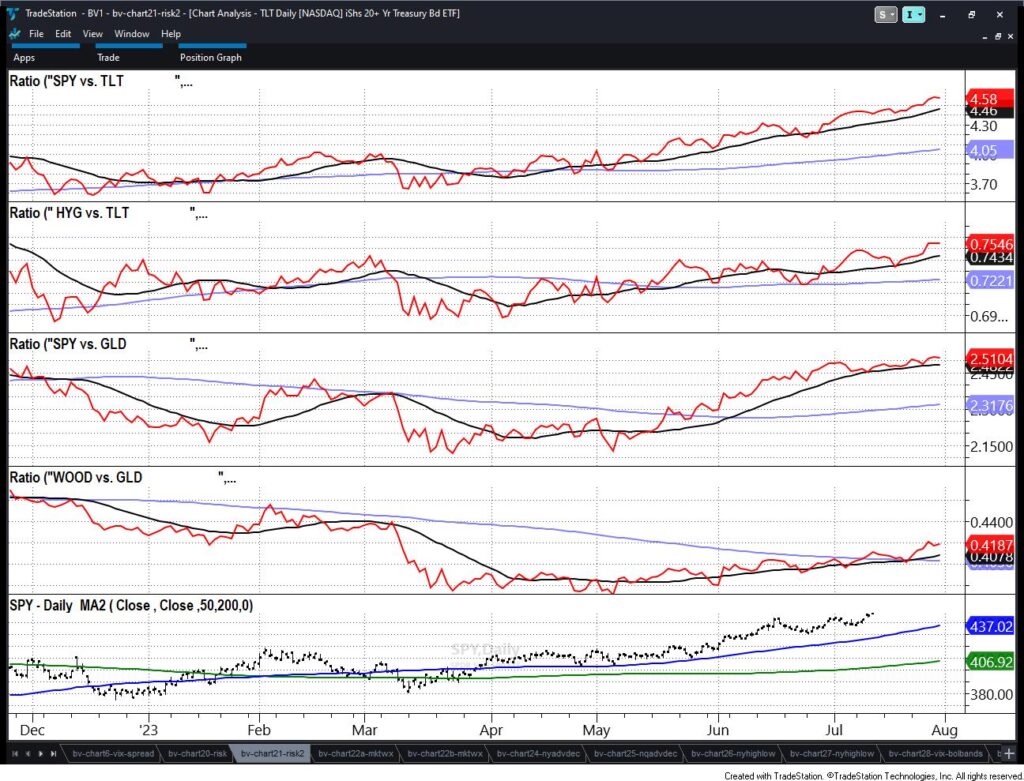
Our Big View has been useful in helping us see the various risk factors.
The key ones we look at are how the SPY is doing versus the long bonds TLT,
How the TLT is doing versus the junk bonds HYG.
How gold is doing versus the SPY.
How WOOD is doing versus gold and how utilities are doing versus the SPY.
All risk factors right now say risk on.
Hopefully that continues to be the case.
Should that change, we will be right on top of it to share with you.
Stock Market ETFs Trading Analysis & Summary:
S&P 500 (SPY): 452 July calendar range hi now support
Russell 2000 (IWM): 193 is the 23-month holy grail
Dow (DIA): 35,000 support
Nasdaq (QQQ): 384 pivotal based on the calendar range
Regional banks (KRE): Consolidating over its July calendar highs-positive
Semiconductors (SMH): Holds here ok-needs to clear 161 and under 147 trouble
Transportation (IYT): 240 is the key underlying area of support
Biotechnology (IBB): 128 support now to hold like to see it clear 130
Retail (XRT): 67.40 the calendar range and pivotal
Twitter: @marketminute
The author may have a position in mentioned securities at the time of publication. Any opinions expressed herein are solely those of the author and do not represent the views or opinions of any other person or entity.
The post Will Rising Oil Prices Smack the S&P 500? appeared first on See It Market.


Canadian Silver Co. Will See Big Changes in 2024
Source: Michael Ballanger 12/22/2023
Michael Ballanger of GGM Advisory Inc. takes a look at the current state of the market and shares on stock…
EGR options out Urban Berry project in Quebec to Harvest Gold – Richard Mills
2023.12.23
EGR Exploration Ltd. (TSXV: EGR) has moved from owner to shareholder at its Urban Berry project in Quebec, this week announcing it is optioning…
Crypto, Crude, & Crap Stocks Rally As Yield Curve Steepens, Rate-Cut Hopes Soar
Crypto, Crude, & Crap Stocks Rally As Yield Curve Steepens, Rate-Cut Hopes Soar
A weird week of macro data – strong jobless claims but…
