Disclaimer: opinions are personal to the author and do not reflect the opinions of Exness or LeapRate.
Precious Metals
Weekly data: Gold and Oil ahead of FOMC minutes
On the technical analysis point of view the price is currently trading around the $1,740just above the 61.8% of the Fibonacci retracement level. With a…


On the technical analysis point of view the price is currently trading around the $1,740just above the 61.8% of the Fibonacci retracement level. With a bear flag formation forming in the last 4 days we might see some continuation to the downside with a very strong area of support around the $1,712 price area which consists of the 50% of the Fibonacci retracement level and the 100 day moving average as well as an inside support area of early October.
If the bulls are proven to be strong in the short term we might see some correction to the upside with a first area of resistance being around the $1,770 just above the 78.6% of the Fibonacci and also the psychological resistance of a round number.
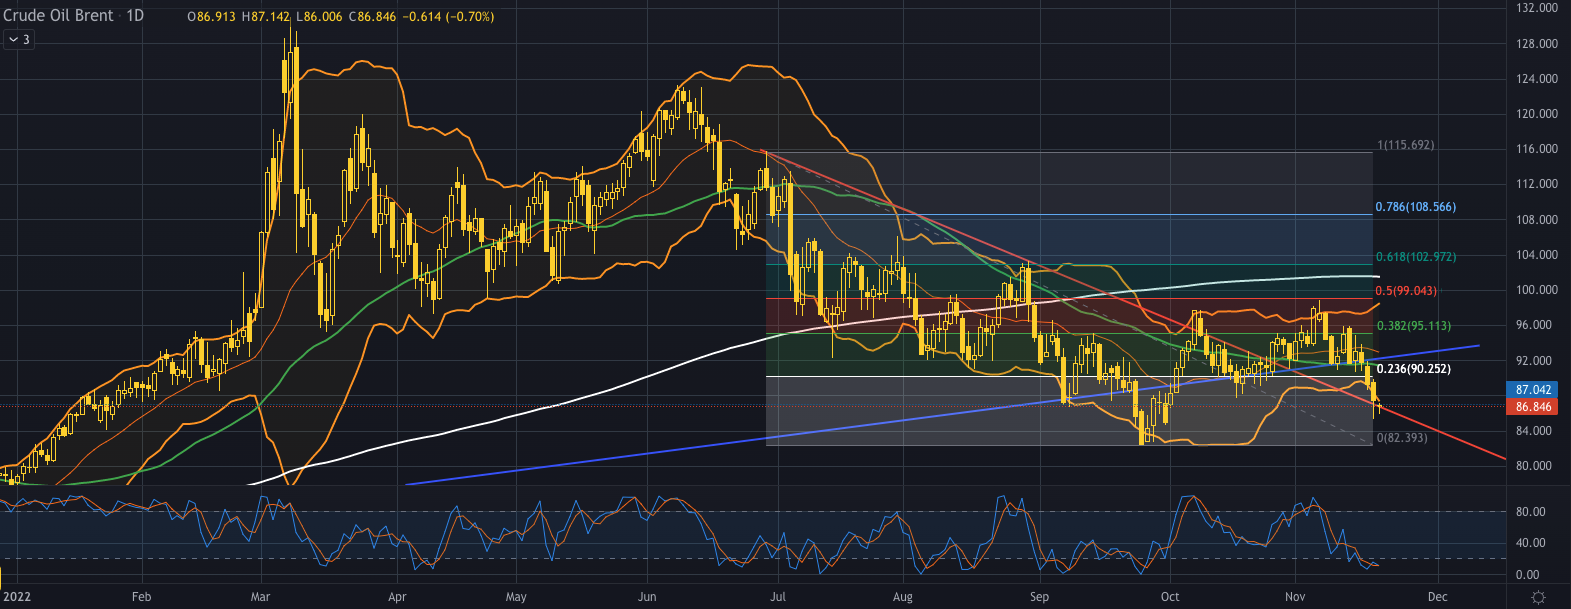
Oil, daily
Europe’s ability to pivot in acquiring the “black gold” from the Middle East, Latin America and the United States gave European refiners a sigh of relief. Asia demanded less oil against any analyst predictions especially because of the battle of China for its zero – covid goal. There were 3 deaths recorded over the weekend in China because of Covid reigniting the possibility of more lockdown’s in the world’s top oil importer which will result in denting the demand for it.
On the technical side the price of oil is currently trading at the $87 area, testing the daily bearish trendline after breaking below the major weekly trendline which was valid since November 2020. It is worth noting that the price is trading outside of the Bollinger bands indicating high volatility in the market and with the Stochastic indicator in the oversold levels we might expect some correction to the upside in the following days.
If the price corrects to the upside we might expect the first point of resistance being around the $91 area which is just above the 23.6% of the Fibonacci retracement level and also is a point on the major weekly trendline. In the event that the price continues to push down we might expect the first point of resistance being around the $82.40 price area which is the 0% of the Fibonacci and also the support area of the last major swing that happened in late September.
The post Weekly data: Gold and Oil ahead of FOMC minutes appeared first on LeapRate.


Canadian Silver Co. Will See Big Changes in 2024
Source: Michael Ballanger 12/22/2023
Michael Ballanger of GGM Advisory Inc. takes a look at the current state of the market and shares on stock…
EGR options out Urban Berry project in Quebec to Harvest Gold – Richard Mills
2023.12.23
EGR Exploration Ltd. (TSXV: EGR) has moved from owner to shareholder at its Urban Berry project in Quebec, this week announcing it is optioning…
Crypto, Crude, & Crap Stocks Rally As Yield Curve Steepens, Rate-Cut Hopes Soar
Crypto, Crude, & Crap Stocks Rally As Yield Curve Steepens, Rate-Cut Hopes Soar
A weird week of macro data – strong jobless claims but…


