Disclaimer: opinions are personal to the author and do not reflect the opinions of Exness or LeapRate.
Precious Metals
Weekly data: EURUSD & Gold price action before GDP data
On the technical side the price on the fiber chart has found resistance on the upper band of the Bollinger bands and has since corrected to the downside. …


On the technical side the price on the fiber chart has found resistance on the upper band of the Bollinger bands and has since corrected to the downside. The 50 SMA has crossed above the 100 SMA indicating the bull movement is still strong while the Stochastic oscillator is not indicating any overbought or oversold levels. The current level of $1.10 is a psychological resistance of the round number so in the event of a correction to the downside happens in the following sessions we might see some major support around the $1.09400 which is an area on the daily chart where the 20 SMA meets the 23.6% of the daily Fibonacci retracement level making this area a strong technical support.
XAUUSD, daily
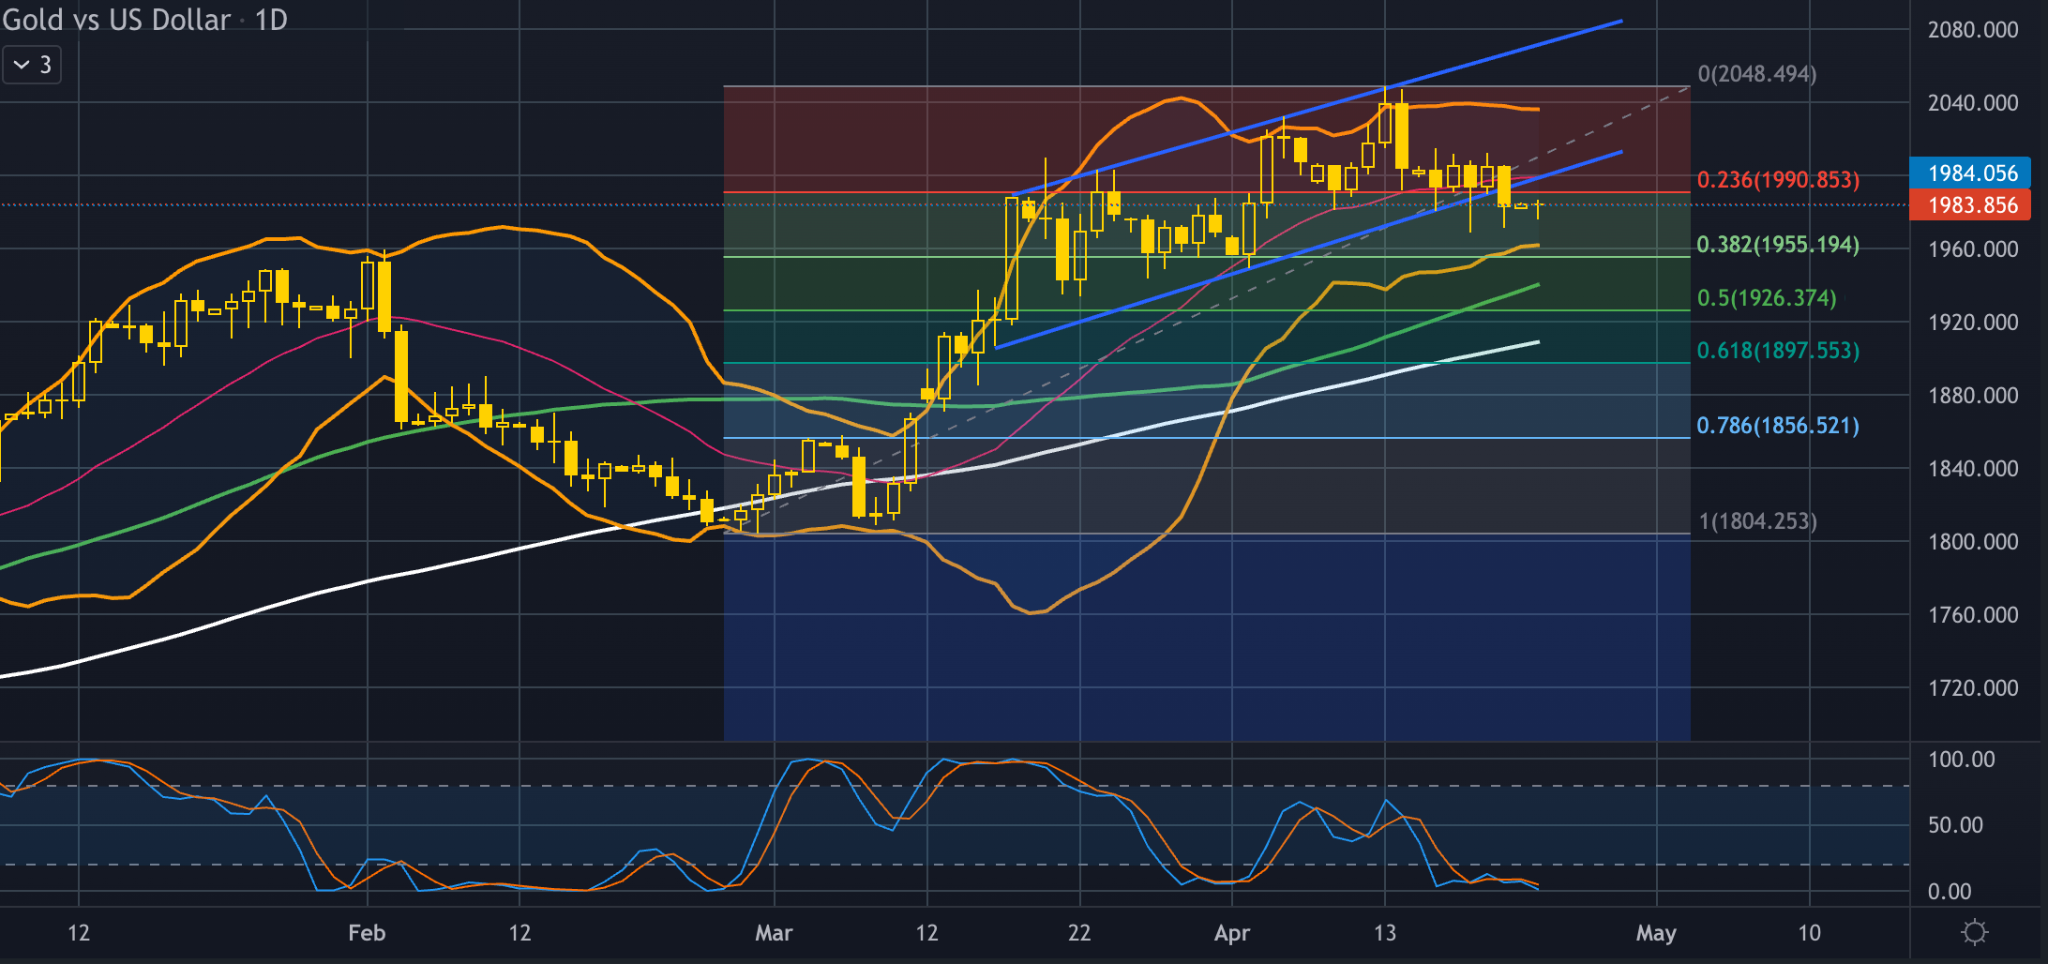
The price of gold is moving in a declining trend for the last 7 sessions since investors and traders are reducing their trading activity on the metal in anticipation of the upcoming FED meeting in early May. Geopolitical risks and recession fears are still high which helps the bulls in pushing the price of the safe-haven asset to the upside. At the time of this report the chances of the U.S. central bank raising rates by 25 basis points is at 90%, according to the CME FedWatch tool.
From the technical standpoint the price is trading in a bearish correction movement and has even broken out of the rising channel formation that was valid since mid March. The Bollinger bands are slowly contracting indicating that volatility in the market for the yellow metal is drying up while the Stochastic oscillator is recording oversold levels for the past week. The overall bullish momentum is still valid according to the moving averages since the slower 50 day has managed to stay above the 100 SMA indicating that the recent bearish correction is not accelerating just yet.
In the event of a continuation of the recent downward movement we might see some support around the $1,955 price area which consists of the lower band of the Bollinger bands and the 38.2% of the daily Fibonacci retracement.
In case of a reversal to the upside we might see some resistance laying around the $2,000 area which is just above the 23.6% of the Fibonacci, the lower boundary of the recent channel formation as well as the psychological resistance of the round number.
The post Weekly data: EURUSD & Gold price action before GDP data appeared first on LeapRate.


Canadian Silver Co. Will See Big Changes in 2024
Source: Michael Ballanger 12/22/2023
Michael Ballanger of GGM Advisory Inc. takes a look at the current state of the market and shares on stock…
EGR options out Urban Berry project in Quebec to Harvest Gold – Richard Mills
2023.12.23
EGR Exploration Ltd. (TSXV: EGR) has moved from owner to shareholder at its Urban Berry project in Quebec, this week announcing it is optioning…
Crypto, Crude, & Crap Stocks Rally As Yield Curve Steepens, Rate-Cut Hopes Soar
Crypto, Crude, & Crap Stocks Rally As Yield Curve Steepens, Rate-Cut Hopes Soar
A weird week of macro data – strong jobless claims but…


