Disclaimer: opinions are personal to the author and do not reflect the opinions of Exness or LeapRate.
Precious Metals
Weekly data: British quid and action on Gold ahead of UK inflation report and news coming up this week
On the technical analysis point of view the price is currently trading around the 1.17 price area which is a very strong point of resistance since it consists…


On the technical analysis point of view the price is currently trading around the 1.17 price area which is a very strong point of resistance since it consists of the 78.6% of the Fibonacci retracement level and the upper band of the Bollinger bands (even trading above the bands a couple of days ago indicating extreme volatility in the market). Given this is a major resistance level on the chart the continuation of the downward movement is the most probable scenario given that the Stochastic indicator is also showing overbought levels. If the price is to correct to the downside we can expect the first point of support being the 1.15500 price area which is a psychological support round number, the 61.8% of the Fibonacci retracement level and the 50 day moving average area. Trading the direction of the actual release happening on Wednesday instead of entering now (except to scalp) might make sense.
Gold-dollar, daily
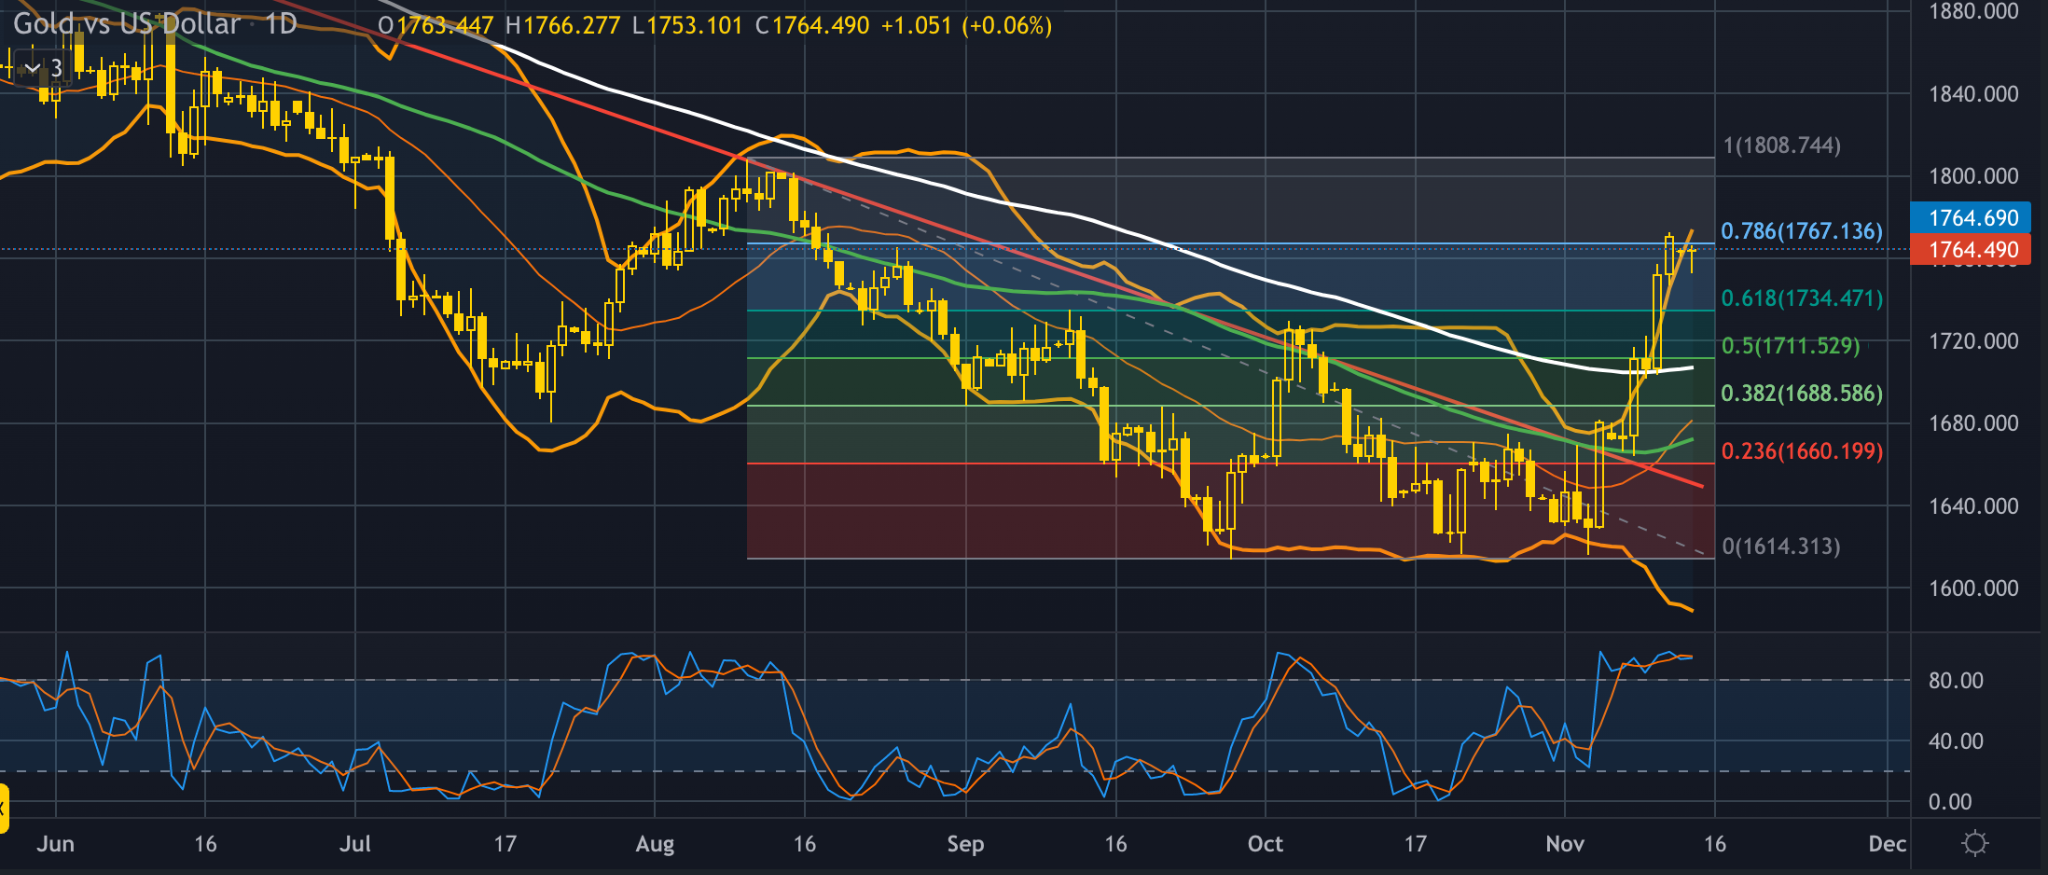
The “yellow metal” continued the bullish momentum hard with the price trading above the Bollinger bands for more than a week, signaling that the volatility is fueled up and holding strong to the day of this report.
The price broke above all the technical points on the chart including the major trendline, 50 and 100 moving averages and even the upper band of the Bollinger bands. Even Though the Stochastic indicator is in the overbought levels for the last week, there is no sign of decline in volume therefore the current trend is more likely to continue in the following days. Some minor corrections might happen intraday but the overall long term momentum is bullish for the time being.
A continuation to the upside could have a first point of resistance at the $1,810 price area which is the 100% of the Fibonacci retracement level and also the inside resistance of the last major swing since early August. A correction to the downside could find some support around the $1,735 price area just above the 61.8% of the Fibonacci and a second support at around the $1,710 area just below the 50% of the Fibonacci and also the 100 day moving average.
Buying the peaks is not a very successful or limited risk move so the most probable scenario we can expect to be the correction before resuming the strong upward movement since the price is already at least respecting the Bollinger bands for now.
The post Weekly data: British quid and action on Gold ahead of UK inflation report and news coming up this week appeared first on LeapRate.


Canadian Silver Co. Will See Big Changes in 2024
Source: Michael Ballanger 12/22/2023
Michael Ballanger of GGM Advisory Inc. takes a look at the current state of the market and shares on stock…
EGR options out Urban Berry project in Quebec to Harvest Gold – Richard Mills
2023.12.23
EGR Exploration Ltd. (TSXV: EGR) has moved from owner to shareholder at its Urban Berry project in Quebec, this week announcing it is optioning…
Crypto, Crude, & Crap Stocks Rally As Yield Curve Steepens, Rate-Cut Hopes Soar
Crypto, Crude, & Crap Stocks Rally As Yield Curve Steepens, Rate-Cut Hopes Soar
A weird week of macro data – strong jobless claims but…


