Disclaimer: opinions are personal to the author and do not reflect the opinions of Exness or LeapRate.
Precious Metals
Weekly data: British pound and action on Gold ahead of UK and US major news
On the technical analysis point of view the price is trading in a steady uptrend for the last month and it is currently at the $1.22800 area after finding…


On the technical analysis point of view the price is trading in a steady uptrend for the last month and it is currently at the $1.22800 area after finding resistance on the upper band of the Bollinger bands. With major economic news coming up and with the Stochastic indicator in the overbought level for almost a month, it is possible to see a correction to the downside before resuming the bullish movement. If this scenario is confirmed then we might see some support around the $1.18800 area which is just below the 23.6% of the daily Fibonacci retracement level, the lower band of the Bollinger bands and also a point on the daily bullish trendline.
If we witness a continuation to the upside after the publications we might expect some resistance around the $1.26470 area which is a strong inside resistance level since late May 2022. Any trading initiated is advised to take extreme caution and give priority to risk assessment and money management rules beforehand.
Gold-dollar, daily
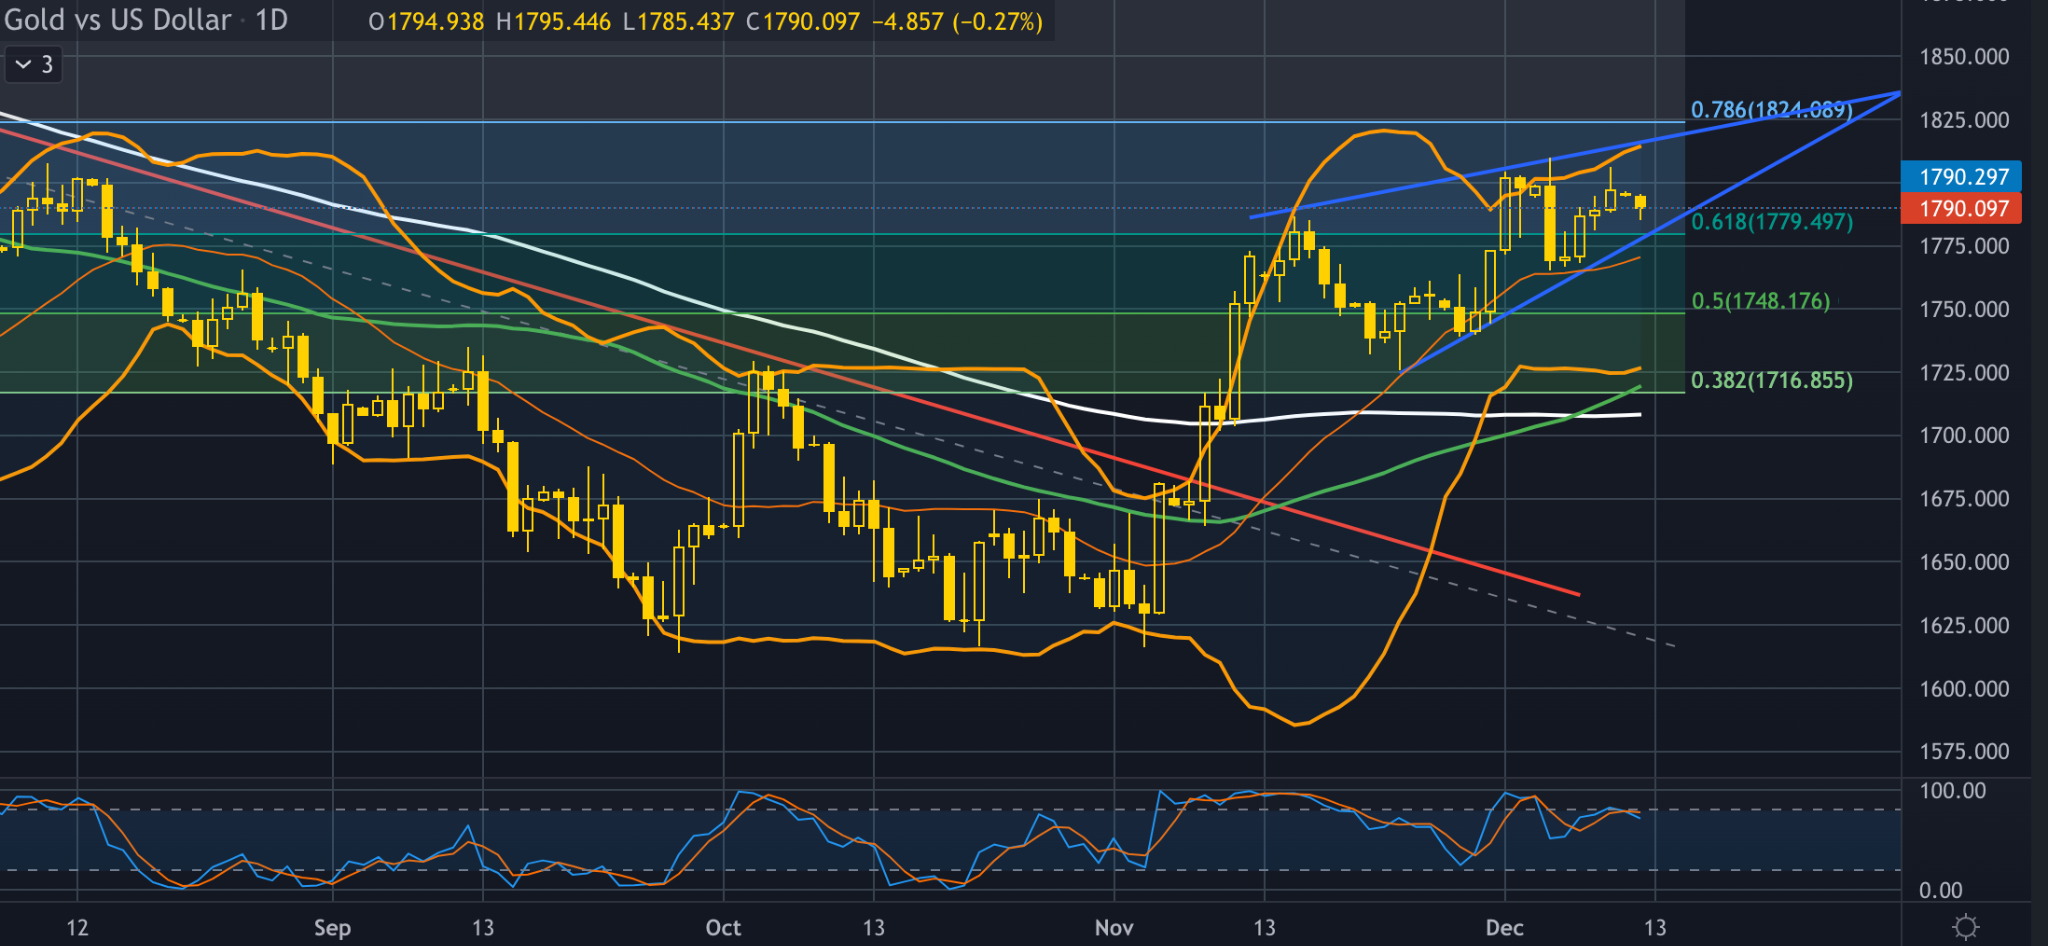
Price of gold declined on Monday against a stronger US Dollar right before major economic news like the US key inflation data and the Federal Reserve policy meeting.The dollar index rose 0.3% making dollar-priced bullion more expensive for overseas buyers. Traders expect a double hike which if confirmed might increase the opportunity cost of holding gold as it yields no interest.
From the technical side the price of gold continued the bullish momentum with the price trading in a rising wedge formation. A rising wedge is usually a bearish signal as it indicates a possible reversal during an up-trend especially if there is a break below the lower side of the wedge. If this is the case then we can expect further movement to the downside with a first point of support around $1,748 level which is the 50% of the daily Fibonacci retracement level and the psychological support area of the round number.
Further continuation to the upside we can expect the price to continue trading within the “boundaries” of the wedge with a strong point of resistance being around the $1,824 area which consists of the 78.6% of the Fibonacci, the upper band of the Bollinger bands and also the upper level of the wedge formation.
The post Weekly data: British pound and action on Gold ahead of UK and US major news appeared first on LeapRate.


Canadian Silver Co. Will See Big Changes in 2024
Source: Michael Ballanger 12/22/2023
Michael Ballanger of GGM Advisory Inc. takes a look at the current state of the market and shares on stock…
EGR options out Urban Berry project in Quebec to Harvest Gold – Richard Mills
2023.12.23
EGR Exploration Ltd. (TSXV: EGR) has moved from owner to shareholder at its Urban Berry project in Quebec, this week announcing it is optioning…
Crypto, Crude, & Crap Stocks Rally As Yield Curve Steepens, Rate-Cut Hopes Soar
Crypto, Crude, & Crap Stocks Rally As Yield Curve Steepens, Rate-Cut Hopes Soar
A weird week of macro data – strong jobless claims but…


