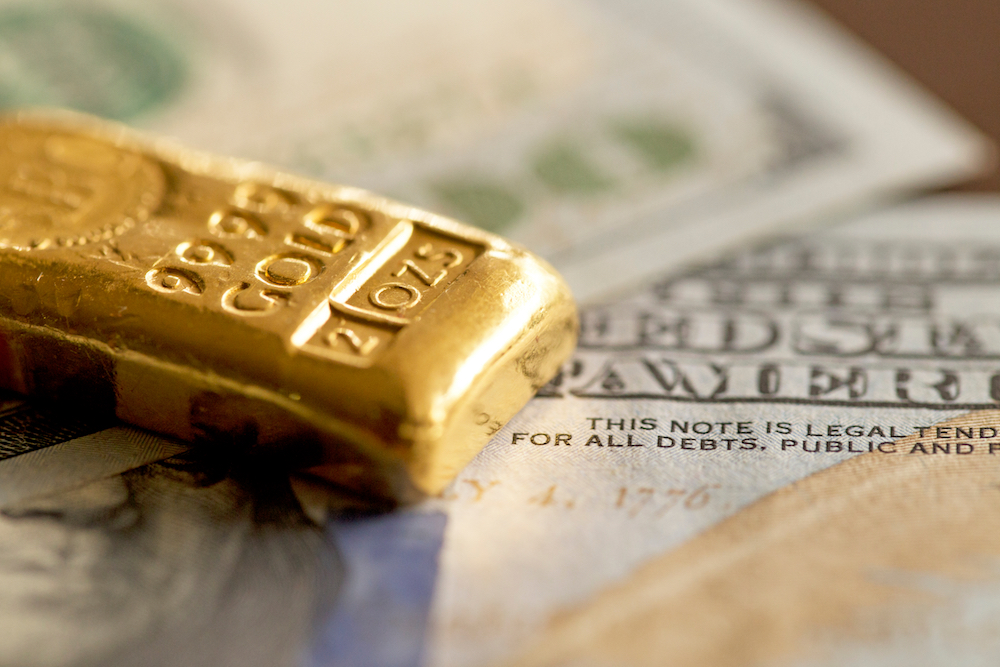
Precious Metals
One More Bottom Before Gold Bounces Through $2,000/oz
Gold prices have now tumbled lower over the last five trading sessions following bumper employment report…
- Gold prices have now tumbled lower over the last five trading sessions following bumper employment report
- “Gold could be under pressure a little while longer”: OANDA
Our Gold Digger column wraps all the news driving ASX stocks with exposure to precious metals.
A month ago, it seemed like interest rate increases were coming to an end. Gold prices were soaring, and bulls were rejoicing.
The precious metal generally exhibits a strong inverse relationship to real rates, which rise and fall in tandem with the Fed’s benchmark rate.
But gold prices have now tumbled lower over the last five trading sessions, sliding as much as 5% after a bumper employment report signalled that further hikes to the Fed Funds rate could be at hand.
A proper curveball for those skimming the headlines.

“The US labour market added a whopping 517,000 roles in January, the most since July of 2022 and easily topping consensus estimates of a 185,000-job print,” says Daniel Moss, Market Analyst at Vantage Markets.
“Indeed, the most recent print far surpasses the average monthly gain of 401,000 seen throughout 2022.
“This wave of hiring has resulted in the unemployment rate declining to 3.4%, the lowest level in over 50 years and far lower than market expectations of a 3.6% print.”
US Fed chair Jerome Powell says further rate increases may be necessary in response to a labour market that is “extraordinarily strong”.
His colleagues have also signalled the Fed Funds rate will peak at 5.4% — that’s three more 25-basis point hikes over the coming months.
Bad news for gold bulls in the near term.
“The risks of more than a couple quarter-point rate rises are growing and if the market starts to price that, gold could be under pressure a little while longer,” says Edward Moya, Senior Market Analyst at OANDA.
“Eventually slower growth and mounting earnings risk will trigger safe-haven flows back into gold, but we are not yet at that moment. “
#Gold (XAUUSD$1,871) is likely going to decline further to re-test a 5-year major rising trendline with support around $1,825. Slight violation is permissible. Once gold bottoms, next advance should take gold to $2,000 mark… pic.twitter.com/K4vFHk3pI3
— Rashad Hajiyev (@hajiyev_rashad) February 6, 2023

The money men are keen on De Grey’s Mallina gold project
14 leading financial institutions are expressing interest in providing traditional debt funding for De Grey Mining’s (ASX:DEG) monster gold development in WA’s Pilbara region.
Most have indicated that Mallina supports funding of about $800m based on the September 2022 Pre-Feasibility Study, which had estimated capital costs at about $985m.
Expected average annual gold production is estimated to hit 540,000oz per annum during the first 10 years – most of it from Hemi, with total production expected to hit 6.4Moz during the current planned 13.6 year mine life.
Payback on the project is expected in less than two years.
A DFS is due mid-year. The project financing process is expected to conclude in the second half of 2023.
Winners & Losers
Here’s how ASX-listed precious metals stocks are performing:
Scroll or swipe to reveal table. Click headings to sort. Best viewed on a laptop.
Stocks missing from this list? Email [email protected]
| CODE | COMPANY | 1 WEEK RETURN % | 1 MONTH RETURN % | 6 MONTH RETURN % | 1 YEAR RETURN % | PRICE | MARKET CAP |
|---|---|---|---|---|---|---|---|
| DCX | Discovex Res | 33% | 33% | -33% | -65% | 0.004 | $9,907,704 |
| TRM | Truscott Mining Corp | 33% | 118% | 145% | 275% | 0.12 | $20,894,633 |
| BNR | Bulletin Res | 25% | 14% | -11% | 0% | 0.125 | $38,166,843 |
| XTC | Xantippe Res | 20% | 20% | -40% | -45% | 0.006 | $51,725,174 |
| BM8 | Battery Age Minerals | 19% | 19% | 19% | 51% | 0.595 | $44,159,807 |
| REZ | Resourc & En Grp | 17% | -13% | -39% | -73% | 0.014 | $6,997,281 |
| SMI | Santana Minerals | 16% | 35% | 4% | 145% | 0.92 | $122,741,518 |
| PNT | Panthermetals | 15% | -5% | -14% | -21% | 0.19 | $5,842,500 |
| KAI | Kairos Minerals | 14% | 0% | -27% | -8% | 0.024 | $45,174,150 |
| OAU | Ora Gold Limited | 14% | 0% | -27% | -50% | 0.008 | $7,873,850 |
| CAZ | Cazaly Resources | 14% | 6% | -15% | -27% | 0.033 | $12,270,119 |
| MRZ | Mont Royal Resources | 11% | 29% | -14% | -23% | 0.245 | $16,778,254 |
| OBM | Ora Banda Mining | 11% | 14% | 45% | 95% | 0.1 | $139,727,639 |
| SPQ | Superior Resources | 11% | 3% | 5% | 40% | 0.063 | $108,878,107 |
| MVL | Marvel Gold Limited | 10% | 0% | -27% | -61% | 0.022 | $15,498,876 |
| AVM | Advance Metals | 10% | 22% | 10% | -39% | 0.011 | $6,090,463 |
| PRX | Prodigy Gold NL | 9% | 0% | -16% | -53% | 0.012 | $20,974,594 |
| CDT | Castle Minerals | 9% | -4% | -31% | -56% | 0.024 | $22,988,339 |
| WCN | White Cliff Min | 8% | -7% | -7% | -58% | 0.013 | $9,408,653 |
| VRC | Volt Resources | 8% | -13% | -35% | -38% | 0.013 | $50,432,510 |
| THR | Thor Energy PLC | 8% | 8% | -32% | -62% | 0.0065 | $7,378,064 |
| NCM | Newcrest Mining | 7% | 9% | 26% | 8% | 24.79 | $22,539,336,491 |
| BBX | BBX Minerals | 7% | 52% | 105% | -6% | 0.15 | $68,701,007 |
| ADV | Ardiden | 7% | -6% | -17% | -56% | 0.0075 | $20,162,515 |
| SFM | Santa Fe Minerals | 7% | -6% | -12% | -62% | 0.075 | $5,097,315 |
| CPM | Coopermetalslimited | 7% | 24% | -37% | -43% | 0.31 | $11,895,800 |
| ADT | Adriatic Metals | 6% | 8% | 64% | 51% | 3.48 | $741,191,299 |
| AL8 | Alderan Resource | 6% | 6% | -6% | -66% | 0.0085 | $4,626,129 |
| SXG | Southern Cross Gold | 6% | -3% | 32% | 0% | 0.705 | $65,572,954 |
| NML | Navarre Minerals | 6% | -12% | -34% | -56% | 0.038 | $56,796,226 |
| KCC | Kincora Copper | 5% | 8% | 14% | -36% | 0.08 | $7,913,688 |
| CYL | Catalyst Metals | 5% | 23% | 17% | -23% | 1.43 | $132,915,800 |
| CBY | Canterbury Resources | 5% | 3% | -7% | -41% | 0.041 | $5,760,941 |
| IPT | Impact Minerals | 5% | 50% | 31% | -23% | 0.0105 | $24,813,706 |
| MOH | Moho Resources | 5% | 0% | -32% | -63% | 0.021 | $4,360,906 |
| MEG | Megado Minerals | 5% | -7% | -50% | -53% | 0.042 | $5,912,500 |
| AM7 | Arcadia Minerals | 5% | 2% | 48% | -4% | 0.23 | $10,740,515 |
| RXL | Rox Resources | 3% | -8% | -34% | -57% | 0.185 | $40,181,602 |
| HMX | Hammer Metals | 3% | 4% | 12% | 15% | 0.076 | $65,712,588 |
| AWV | Anova Metals | 3% | 28% | 37% | 28% | 0.205 | $35,158,072 |
| KWR | Kingwest Resources | 3% | 11% | -41% | -78% | 0.041 | $11,550,800 |
| LEX | Lefroy Exploration | 2% | -6% | -19% | -26% | 0.24 | $40,114,501 |
| FG1 | Flynngold | 2% | 2% | 17% | -37% | 0.097 | $9,978,733 |
| KIN | KIN Min NL | 2% | -18% | -41% | -45% | 0.054 | $55,571,640 |
| MLS | Metals Australia | 2% | 15% | -11% | -8% | 0.055 | $33,386,991 |
| GIB | Gibb River Diamonds | 2% | -6% | 20% | -8% | 0.06 | $13,959,623 |
| AWJ | Auric Mining | 2% | 0% | -33% | -39% | 0.064 | $6,006,056 |
| NWM | Norwest Minerals | 2% | 38% | 65% | 14% | 0.066 | $14,214,873 |
| PGD | Peregrine Gold | 2% | 22% | -31% | -11% | 0.5 | $19,381,445 |
| HAV | Havilah Resources | 1% | 13% | 30% | 94% | 0.35 | $110,823,724 |
| GBR | Greatbould Resources | 1% | -3% | -26% | -39% | 0.089 | $39,234,777 |
| NPM | Newpeak Metals | 0% | 0% | 0% | 0% | 0.001 | $9,145,132 |
| ASO | Aston Minerals | 0% | 12% | 5% | -43% | 0.092 | $99,104,253 |
| FFX | Firefinch | 0% | 0% | 0% | -18% | 0.2 | $236,248,644 |
| TMX | Terrain Minerals | 0% | 0% | -25% | -25% | 0.006 | $7,040,795 |
| CST | Castile Resources | 0% | 1% | -26% | -50% | 0.1 | $24,190,243 |
| FAU | First Au | 0% | 13% | -44% | -57% | 0.0045 | $4,283,970 |
| CWX | Carawine Resources | 0% | 0% | 0% | -35% | 0.11 | $21,649,921 |
| RND | Rand Mining | 0% | -1% | -7% | -8% | 1.4 | $79,626,345 |
| SRN | Surefire Rescs NL | 0% | 17% | -22% | -13% | 0.014 | $22,139,089 |
| SIH | Sihayo Gold Limited | 0% | 0% | -33% | -78% | 0.002 | $12,204,256 |
| ASR | Asra Minerals | 0% | -21% | -21% | -50% | 0.015 | $20,539,661 |
| MCT | Metalicity Limited | 0% | 0% | 0% | -61% | 0.003 | $10,476,118 |
| CTO | Citigold Corp | 0% | 0% | 0% | -33% | 0.006 | $17,001,955 |
| TRY | Troy Resources | 0% | 0% | 0% | 0% | 0.0295 | $62,920,961 |
| CGN | Crater Gold Min | 0% | 0% | 0% | 0% | 0.017 | $21,063,474 |
| SVG | Savannah Goldfields | 0% | 3% | 0% | -33% | 0.18 | $33,048,477 |
| NAE | New Age Exploration | 0% | -7% | 0% | -61% | 0.007 | $11,487,191 |
| MTH | Mithril Resources | 0% | 17% | -42% | -73% | 0.0035 | $11,420,816 |
| RMX | Red Mount Min | 0% | 20% | -8% | -40% | 0.006 | $11,930,093 |
| BYH | Bryah Resources | 0% | -4% | -17% | -59% | 0.024 | $6,750,083 |
| ICL | Iceni Gold | 0% | 0% | 5% | -20% | 0.1 | $12,819,643 |
| RML | Resolution Minerals | 0% | -13% | -33% | -59% | 0.007 | $8,098,096 |
| TBA | Tombola Gold | 0% | 0% | -21% | -13% | 0.026 | $33,129,243 |
| HRN | Horizon Gold | 0% | 10% | -11% | -18% | 0.34 | $42,561,758 |
| QML | Qmines Limited | 0% | 9% | 9% | -42% | 0.18 | $16,237,626 |
| AGC | AGC | 0% | -2% | -21% | -40% | 0.059 | $5,900,000 |
| RVR | Red River Resources | 0% | 0% | -48% | -63% | 0.073 | $37,847,908 |
| TSO | Tesoro Gold | 0% | -11% | -30% | -58% | 0.031 | $34,680,846 |
| WMC | Wiluna Mining Corp | 0% | 0% | 0% | -77% | 0.205 | $74,238,031 |
| BAT | Battery Minerals | 0% | -20% | -33% | -65% | 0.004 | $11,740,969 |
| POL | Polymetals Resources | 0% | 12% | 31% | 41% | 0.19 | $8,584,711 |
| CXU | Cauldron Energy | 0% | 7% | -17% | -64% | 0.008 | $5,589,408 |
| HXG | Hexagon Energy | 0% | 0% | 13% | -67% | 0.018 | $9,232,486 |
| VAN | Vango Mining | 0% | 14% | 11% | 23% | 0.05 | $60,477,006 |
| LCY | Legacy Iron Ore | 0% | -11% | -18% | -20% | 0.016 | $102,509,219 |
| SAU | Southern Gold | 0% | -14% | -36% | -58% | 0.025 | $7,206,847 |
| A8G | Australasian Metals | 0% | -5% | -34% | -67% | 0.19 | $7,822,394 |
| NES | Nelson Resources | 0% | 14% | -14% | -59% | 0.008 | $4,708,755 |
| TLM | Talisman Mining | 0% | 0% | 10% | -6% | 0.17 | $30,977,017 |
| M24 | Mamba Exploration | 0% | 27% | 36% | -7% | 0.19 | $8,435,001 |
| DEX | Duke Exploration | 0% | 0% | -34% | -67% | 0.053 | $5,587,240 |
| KNB | Koonenberrygold | 0% | -22% | -38% | -64% | 0.05 | $3,787,822 |
| AYM | Australia United Min | 0% | -20% | -33% | -33% | 0.004 | $7,370,310 |
| ANL | Amani Gold | 0% | 0% | -33% | -33% | 0.001 | $24,693,441 |
| GCY | Gascoyne Res | 0% | 0% | -24% | -25% | 0.195 | $83,082,880 |
| FEG | Far East Gold | 0% | -13% | -5% | 0% | 0.4 | $53,344,043 |
| IGO | IGO Limited | 0% | 3% | 22% | 18% | 14.57 | $11,086,400,782 |
| MAU | Magnetic Resources | -1% | -1% | -12% | -45% | 0.795 | $182,462,343 |
| YRL | Yandal Resources | -1% | -5% | -43% | -73% | 0.093 | $14,675,686 |
| GRL | Godolphin Resources | -1% | 11% | 3% | -34% | 0.089 | $10,298,142 |
| AAR | Astral Resources NL | -1% | -5% | -4% | -35% | 0.073 | $48,574,928 |
| AME | Alto Metals Limited | -1% | 4% | 3% | -14% | 0.072 | $44,122,714 |
| TTM | Titan Minerals | -1% | -8% | 15% | -41% | 0.068 | $97,377,850 |
| LM8 | Lunnonmetalslimited | -2% | 7% | 1% | 12% | 0.96 | $107,678,604 |
| MEU | Marmota Limited | -2% | -4% | -15% | 0% | 0.044 | $47,646,026 |
| KTA | Krakatoa Resources | -2% | -4% | -25% | -14% | 0.043 | $15,167,236 |
| EMR | Emerald Res NL | -2% | 21% | 26% | 43% | 1.49 | $908,515,504 |
| SFR | Sandfire Resources | -2% | 4% | 33% | -11% | 6.3 | $2,933,246,178 |
| MGV | Musgrave Minerals | -3% | -13% | -29% | -38% | 0.195 | $115,285,550 |
| G50 | Gold50Limited | -3% | -22% | 23% | -14% | 0.19 | $10,819,170 |
| STK | Strickland Metals | -3% | -10% | -37% | -44% | 0.036 | $51,730,560 |
| TGM | Theta Gold Mines | -3% | 1% | -9% | -56% | 0.068 | $42,092,617 |
| XAM | Xanadu Mines | -3% | -2% | 7% | 15% | 0.03 | $43,761,242 |
| TG1 | Techgen Metals | -3% | 5% | -43% | -37% | 0.085 | $4,841,692 |
| E2M | E2 Metals | -3% | -13% | -20% | -43% | 0.14 | $27,878,525 |
| TBR | Tribune Res | -3% | -8% | -9% | -24% | 3.63 | $194,131,885 |
| AGG | AngloGold Ashanti | -4% | -8% | 24% | 2% | 5.68 | $504,023,872 |
| ERM | Emmerson Resources | -4% | -4% | -27% | -41% | 0.077 | $41,942,654 |
| BNZ | Benzmining | -4% | 22% | 20% | -26% | 0.48 | $37,811,290 |
| CDR | Codrus Minerals | -4% | -9% | 58% | -4% | 0.12 | $4,851,600 |
| TUL | Tulla Resources | -4% | 4% | -33% | -40% | 0.35 | $73,432,716 |
| ARN | Aldoro Resources | -4% | -10% | -13% | -48% | 0.23 | $25,969,833 |
| PUR | Pursuit Minerals | -4% | 35% | 35% | 0% | 0.023 | $25,136,097 |
| STN | Saturn Metals | -4% | -9% | -39% | -58% | 0.1725 | $26,142,120 |
| M2R | Miramar | -4% | -1% | -21% | -61% | 0.079 | $5,583,858 |
| BEZ | Besragoldinc | -4% | -13% | 43% | -59% | 0.045 | $16,631,509 |
| CHN | Chalice Mining | -4% | -8% | 27% | -17% | 6.43 | $2,446,906,761 |
| G88 | Golden Mile Res | -4% | 5% | -24% | -58% | 0.022 | $4,500,975 |
| TAM | Tanami Gold NL | -5% | 0% | -13% | -32% | 0.041 | $48,178,979 |
| AZS | Azure Minerals | -5% | 36% | 27% | -30% | 0.305 | $101,868,976 |
| GED | Golden Deeps | -5% | 0% | -29% | -9% | 0.01 | $11,552,267 |
| DCN | Dacian Gold | -5% | -9% | -13% | -43% | 0.1 | $127,764,098 |
| MXR | Maximus Resources | -5% | -7% | -35% | -43% | 0.039 | $12,762,231 |
| KSN | Kingston Resources | -5% | 6% | -1% | -42% | 0.095 | $39,902,751 |
| ADG | Adelong Gold Limited | -5% | 36% | -53% | -68% | 0.0095 | $4,804,401 |
| TAR | Taruga Minerals | -5% | -24% | -21% | -51% | 0.019 | $12,002,455 |
| GAL | Galileo Mining | -5% | -16% | -19% | 286% | 0.83 | $167,981,188 |
| PGO | Pacgold | -5% | -1% | -32% | -61% | 0.36 | $19,786,253 |
| KAL | Kalgoorliegoldmining | -5% | -12% | -45% | -57% | 0.071 | $5,420,422 |
| MRR | Minrex Resources | -5% | -13% | -39% | -51% | 0.035 | $37,970,363 |
| OKR | Okapi Resources | -5% | 3% | -24% | -44% | 0.175 | $25,117,921 |
| A1G | African Gold . | -5% | -10% | 10% | -57% | 0.086 | $13,352,560 |
| ALY | Alchemy Resource | -6% | -29% | 13% | 31% | 0.017 | $18,849,220 |
| GMD | Genesis Minerals | -6% | -10% | -12% | -28% | 1.215 | $512,467,852 |
| GMR | Golden Rim Resources | -6% | 3% | -42% | -71% | 0.032 | $18,834,828 |
| OZM | Ozaurum Resources | -6% | 21% | -33% | -30% | 0.08 | $10,414,000 |
| ENR | Encounter Resources | -6% | -18% | 7% | 14% | 0.16 | $58,661,754 |
| HRZ | Horizon | -6% | 0% | -19% | -52% | 0.063 | $38,616,465 |
| X64 | Ten Sixty Four | -6% | -10% | -10% | -15% | 0.5875 | $134,752,048 |
| MTC | Metalstech | -6% | 0% | 26% | 72% | 0.465 | $88,602,295 |
| BMR | Ballymore Resources | -6% | 0% | -16% | -14% | 0.155 | $15,410,793 |
| SLZ | Sultan Resources | -6% | -28% | -55% | -61% | 0.061 | $5,163,632 |
| EMC | Everest Metals Corp | -6% | 14% | -14% | -36% | 0.09 | $9,578,980 |
| BGD | Bartongoldholdings | -6% | -4% | 13% | -17% | 0.225 | $20,266,941 |
| CEL | Challenger Exp | -6% | -14% | -21% | -46% | 0.15 | $156,872,256 |
| CHZ | Chesser Resources | -6% | -1% | -3% | -9% | 0.09 | $52,974,121 |
| AQI | Alicanto Min | -6% | -13% | -20% | -59% | 0.045 | $20,525,826 |
| S2R | S2 Resources | -6% | -12% | 3% | -17% | 0.15 | $53,531,228 |
| PNR | Pantoro Limited | -6% | -1% | -53% | -72% | 0.089 | $156,536,210 |
| FAL | Falconmetals | -6% | -23% | -2% | -55% | 0.22 | $38,055,000 |
| MKG | Mako Gold | -7% | -2% | -45% | -53% | 0.042 | $19,809,357 |
| ARL | Ardea Resources | -7% | -16% | -34% | 3% | 0.7 | $120,909,454 |
| BCN | Beacon Minerals | -7% | -3% | -3% | -13% | 0.028 | $112,703,045 |
| MM8 | Medallion Metals. | -7% | 0% | -30% | -39% | 0.14 | $20,293,484 |
| PKO | Peako Limited | -7% | 17% | -30% | -26% | 0.014 | $5,309,014 |
| PDI | Predictive Disc | -7% | -9% | -22% | -31% | 0.1725 | $303,540,446 |
| NAG | Nagambie Resources | -7% | -17% | -26% | 10% | 0.055 | $29,882,186 |
| VMC | Venus Metals Cor | -7% | 0% | -23% | -34% | 0.135 | $24,040,622 |
| GSR | Greenstone Resources | -7% | -10% | -56% | -27% | 0.027 | $29,046,032 |
| NMR | Native Mineral Res | -7% | -20% | -24% | -63% | 0.08 | $9,611,099 |
| IVR | Investigator Res | -7% | -13% | -20% | -37% | 0.039 | $58,923,710 |
| RGL | Riversgold | -7% | -7% | -21% | 37% | 0.026 | $23,636,693 |
| EVN | Evolution Mining | -7% | -6% | 12% | -15% | 3.12 | $5,908,752,547 |
| CLZ | Classic Min | -7% | -28% | -80% | -96% | 0.0065 | $7,293,594 |
| DEG | De Grey Mining | -7% | -11% | 42% | 13% | 1.405 | $2,279,303,696 |
| AAU | Antilles Gold | -7% | 3% | -28% | -58% | 0.038 | $18,517,804 |
| WRM | White Rock Min | -7% | -9% | -32% | -71% | 0.063 | $16,342,307 |
| AMI | Aurelia Metals | -7% | -7% | -54% | -73% | 0.125 | $160,866,838 |
| BC8 | Black Cat Syndicate | -8% | -4% | 1% | -37% | 0.37 | $101,137,742 |
| SMS | Starmineralslimited | -8% | 1% | -27% | -64% | 0.073 | $2,159,340 |
| NSM | Northstaw | -8% | -8% | 3% | -35% | 0.175 | $21,022,225 |
| BGL | Bellevue Gold | -8% | -16% | 25% | 38% | 1.1275 | $1,304,139,112 |
| KRM | Kingsrose Mining | -8% | -10% | 13% | -8% | 0.069 | $51,924,330 |
| GWR | GWR Group | -8% | 8% | -39% | -67% | 0.057 | $18,951,783 |
| BRB | Breaker Res NL | -8% | -19% | 36% | 16% | 0.285 | $94,730,317 |
| ZNC | Zenith Minerals | -8% | -13% | -25% | -42% | 0.225 | $79,133,860 |
| EM2 | Eagle Mountain | -8% | 27% | -10% | -65% | 0.225 | $68,617,544 |
| SSR | SSR Mining Inc. | -8% | -11% | -2% | -9% | 22.46 | $427,334,036 |
| GTR | Gti Energy | -8% | -8% | -39% | -50% | 0.011 | $18,065,803 |
| PUA | Peak Minerals | -8% | -8% | -31% | -59% | 0.0055 | $5,206,883 |
| GSM | Golden State Mining | -8% | -6% | -15% | -51% | 0.044 | $5,148,625 |
| MDI | Middle Island Res | -8% | 38% | -42% | -59% | 0.055 | $6,733,002 |
| MKR | Manuka Resources. | -8% | -10% | -44% | -72% | 0.087 | $43,743,733 |
| PNM | Pacific Nickel Mines | -8% | -8% | 1% | -24% | 0.076 | $28,580,662 |
| HAW | Hawthorn Resources | -9% | -23% | 13% | 5% | 0.096 | $32,161,499 |
| ICG | Inca Minerals | -9% | -19% | -62% | -81% | 0.021 | $10,139,921 |
| PRU | Perseus Mining | -9% | -17% | 12% | 28% | 1.9525 | $2,789,624,751 |
| CY5 | Cygnus Gold Limited | -9% | 3% | 133% | 158% | 0.465 | $88,259,622 |
| MI6 | Minerals260Limited | -9% | -22% | -5% | -46% | 0.31 | $69,300,000 |
| AUC | Ausgold Limited | -9% | -2% | 2% | 6% | 0.051 | $107,562,151 |
| RDN | Raiden Resources | -9% | 0% | -38% | -72% | 0.005 | $8,272,912 |
| NST | Northern Star | -9% | 0% | 44% | 38% | 12.01 | $14,247,824,249 |
| NVA | Nova Minerals | -9% | -13% | -21% | -31% | 0.625 | $131,283,832 |
| LCL | Los Cerros Limited | -10% | -22% | 9% | -68% | 0.038 | $29,182,662 |
| FML | Focus Minerals | -10% | -10% | 36% | -24% | 0.19 | $54,446,143 |
| SVY | Stavely Minerals | -10% | 16% | 58% | -38% | 0.285 | $96,088,497 |
| ALK | Alkane Resources | -10% | -6% | -22% | -23% | 0.65 | $413,166,888 |
| DTM | Dart Mining NL | -10% | -27% | -34% | -44% | 0.046 | $7,158,546 |
| BMO | Bastion Minerals | -10% | 35% | -65% | -75% | 0.046 | $6,770,825 |
| ARV | Artemis Resources | -10% | -13% | -46% | -67% | 0.0225 | $33,394,041 |
| RDS | Redstone Resources | -10% | 13% | -10% | -25% | 0.009 | $6,631,492 |
| MOM | Moab Minerals | -10% | -10% | -67% | -64% | 0.009 | $6,819,635 |
| RRL | Regis Resources | -10% | -11% | 6% | 8% | 1.9975 | $1,547,803,146 |
| KCN | Kingsgate Consolid. | -10% | -16% | -18% | -10% | 1.525 | $340,833,498 |
| HCH | Hot Chili | -10% | -3% | -4% | -41% | 0.91 | $108,695,137 |
| TIE | Tietto Minerals | -10% | -20% | 34% | 10% | 0.685 | $788,457,430 |
| KAU | Kaiser Reef | -11% | -19% | 0% | -11% | 0.17 | $24,088,606 |
| ZAG | Zuleika Gold | -11% | -15% | -26% | -61% | 0.017 | $8,891,861 |
| LRL | Labyrinth Resources | -11% | -11% | -26% | -61% | 0.017 | $16,311,285 |
| RSG | Resolute Mining | -11% | 0% | -7% | -11% | 0.25 | $553,541,708 |
| ANX | Anax Metals | -11% | 13% | -13% | -29% | 0.066 | $27,020,059 |
| MAT | Matsa Resources | -11% | -6% | -29% | -48% | 0.033 | $14,832,166 |
| MZZ | Matador Mining | -11% | -22% | -22% | -68% | 0.098 | $31,521,883 |
| NXM | Nexus Minerals | -11% | -11% | -17% | -46% | 0.2 | $65,090,662 |
| SBR | Sabre Resources | -11% | -22% | -20% | -20% | 0.04 | $11,950,934 |
| SBM | St Barbara Limited | -11% | -26% | -46% | -53% | 0.6575 | $543,000,194 |
| GML | Gateway Mining | -11% | -20% | -39% | -58% | 0.055 | $15,250,651 |
| GOR | Gold Road Res | -11% | -20% | 2% | 7% | 1.49 | $1,678,753,368 |
| ADN | Andromeda Metals | -12% | -4% | -53% | -76% | 0.046 | $143,060,388 |
| LYN | Lycaonresources | -12% | -10% | 10% | -31% | 0.265 | $9,217,250 |
| DTR | Dateline Resources | -12% | -19% | -70% | -64% | 0.03 | $16,955,536 |
| RDT | Red Dirt Metals | -12% | -3% | -1% | -30% | 0.445 | $200,208,371 |
| KZR | Kalamazoo Resources | -12% | -14% | -18% | -43% | 0.185 | $30,507,972 |
| GNM | Great Northern | -13% | -13% | -30% | -42% | 0.0035 | $5,981,678 |
| TCG | Turaco Gold Limited | -13% | -5% | -20% | -52% | 0.055 | $23,096,700 |
| IDA | Indiana Resources | -13% | -9% | -18% | -7% | 0.054 | $27,555,265 |
| AAJ | Aruma Resources | -13% | 40% | -8% | -25% | 0.074 | $11,615,151 |
| WAF | West African Res | -13% | -19% | -31% | -19% | 0.975 | $1,018,331,000 |
| CMM | Capricorn Metals | -13% | -21% | -3% | 18% | 4.1 | $1,619,517,734 |
| GUL | Gullewa Limited | -13% | -13% | -13% | -22% | 0.052 | $10,180,201 |
| SLR | Silver Lake Resource | -13% | -20% | -27% | -29% | 1.135 | $1,087,800,870 |
| MBK | Metal Bank | -14% | -16% | -36% | -47% | 0.032 | $9,124,022 |
| MEK | Meeka Metals Limited | -14% | -18% | 2% | -7% | 0.051 | $56,583,273 |
| MEI | Meteoric Resources | -14% | 140% | 862% | 658% | 0.125 | $198,480,217 |
| GBZ | GBM Rsources | -14% | -7% | -37% | -64% | 0.043 | $25,324,451 |
| RMS | Ramelius Resources | -14% | -16% | -17% | -37% | 0.905 | $820,853,751 |
| RED | Red 5 Limited | -14% | -28% | -41% | -40% | 0.18 | $530,635,175 |
| WWI | West Wits Mining | -15% | -28% | -37% | -65% | 0.0145 | $32,720,603 |
| AUT | Auteco Minerals | -15% | -26% | -8% | -52% | 0.046 | $93,277,634 |
| SKY | SKY Metals | -16% | 0% | -27% | -48% | 0.048 | $18,839,174 |
| CLA | Celsius Resource | -16% | -6% | 14% | -47% | 0.016 | $29,715,265 |
| TMZ | Thomson Res | -16% | -6% | -43% | -79% | 0.016 | $14,789,168 |
| GMN | Gold Mountain | -17% | 0% | -17% | -71% | 0.005 | $10,146,579 |
| EMU | EMU NL | -17% | -38% | -58% | -75% | 0.005 | $2,749,072 |
| SI6 | SI6 Metals Limited | -17% | -17% | -29% | -55% | 0.005 | $7,476,973 |
| DRE | Dreadnought Resources | -17% | -3% | 19% | 117% | 0.0955 | $329,372,822 |
| SNG | Siren Gold | -17% | -24% | -44% | -47% | 0.145 | $18,123,449 |
| PRS | Prospech Limited | -18% | 22% | -3% | -46% | 0.028 | $2,384,062 |
| CAI | Calidus Resources | -18% | -31% | -70% | -66% | 0.23 | $109,838,881 |
| HMG | Hamelingoldlimited | -19% | -24% | -24% | -37% | 0.11 | $11,550,000 |
| SVL | Silver Mines Limited | -20% | -20% | -15% | -21% | 0.165 | $251,907,268 |
| GSN | Great Southern | -20% | -20% | -37% | -56% | 0.024 | $14,793,925 |
| BTR | Brightstar Resources | -21% | -5% | 0% | -44% | 0.019 | $15,753,448 |
| VKA | Viking Mines | -21% | 38% | 57% | -31% | 0.011 | $12,303,101 |
| WGX | Westgold Resources. | -22% | -3% | -22% | -48% | 1.04 | $516,248,776 |
| AQX | Alice Queen | -25% | -25% | -50% | -81% | 0.0015 | $4,400,500 |
| PNX | PNX Metals Limited | -25% | -20% | -20% | -47% | 0.003 | $15,554,202 |
| MHC | Manhattan Corp | -28% | 8% | -35% | -57% | 0.0065 | $10,683,951 |
| AVW | Avira Resources | -33% | -33% | -43% | -60% | 0.002 | $5,334,475 |
The post Gold Digger: One more bottom before gold bounces through US$2000/oz, expert says appeared first on Stockhead.


Canadian Silver Co. Will See Big Changes in 2024
Source: Michael Ballanger 12/22/2023
Michael Ballanger of GGM Advisory Inc. takes a look at the current state of the market and shares on stock…
EGR options out Urban Berry project in Quebec to Harvest Gold – Richard Mills
2023.12.23
EGR Exploration Ltd. (TSXV: EGR) has moved from owner to shareholder at its Urban Berry project in Quebec, this week announcing it is optioning…
Crypto, Crude, & Crap Stocks Rally As Yield Curve Steepens, Rate-Cut Hopes Soar
Crypto, Crude, & Crap Stocks Rally As Yield Curve Steepens, Rate-Cut Hopes Soar
A weird week of macro data – strong jobless claims but…


