Precious Metals
Macro Drivers Point to a Gold Bull Market. Why Hasn’t it Happened Yet?
Despite a bullish backdrop – COVID, war, inflation shocks, bank failures – gold has traded in an oddly tight range. … Read More
The post Gold Digger:…

- Despite a bullish backdrop – COVID, war, inflation shocks, bank failures – gold has traded in an oddly tight range
- Liberum says all these demand drivers are being ‘cancelled out’ by Fed-led inflation-targeting rate hikes
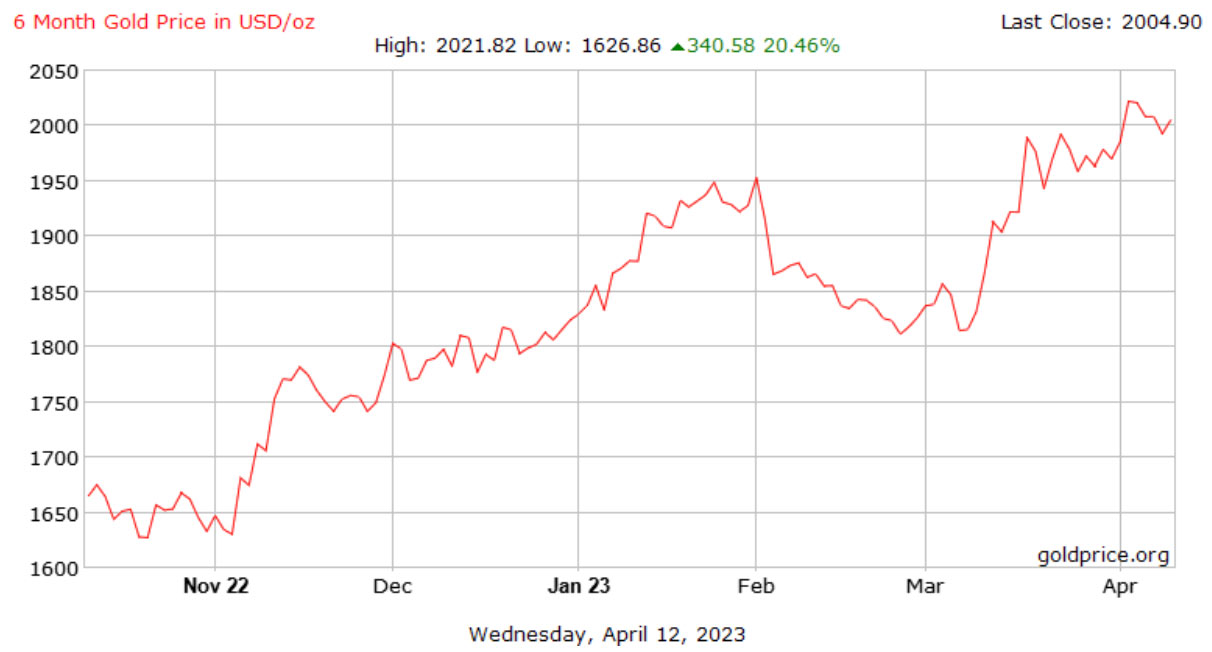
- Gold paying US$2014/oz at 4:30pm EST Wednesday; Silver sitting pretty at US$25.40/oz
Our Gold Digger column wraps all the news driving ASX stocks with exposure to precious metals.
“Mate, I don’t get it: we’ve had a virus sweep the planet, multiple inflation shocks, bank failures, deteriorating growth/trade conditions – and Russia’s war drags on … but this wonderfully bullish backdrop for gold can’t lift its price much above $2,000/oz.
“Why?”
A great question from London-New York based investment bank Liberum, recognising there are lots of frustrated gold investors out there right now.
“For years now, anyone buying gold for some longer-term price upside on this collection of dramatic macro-themes has had a tough time,” write Liberum analysts Tim Price, Ben Davis and Yuen Low in an April 12 note.
“Since 2020’s lockdown, gold’s price has traded at US$1,800/oz, +/-10% – an oddly tight range.”
Why is this happening?
Liberum says all these bullish demand drivers are being ‘cancelled out’ by Fed-led inflation-targeting rate hikes.
That’s why the price for gold is merely being supported.
“So far, price bullishness tied to this bank-related crisis + mixed US macro-data is being offset by the Fed’s on-going determination to cut US inflation via monetary policy,” Liberum says.
“For us, we expect the Fed’s inflation targeting to deliver a net-bearish outcome to gold’s price. That is, global market anxiety over trade conflicts, Russia’s war, etc. will pass before the Fed’s policy will.
“On this basis, we continue to expect the price to fall to below $1,800/oz in 2023-24.”
There’s bullish upside to this outlook, however.
“Any surprise moderation in the Fed’s cash rate hike cycle, on an unchanged macro-backdrop, may allow gold’s bullish price drivers to emerge,” Liberum says.
Other bullish signals to watch out for include another round of energy-related inflation shocks akin to 2022’s, escalating trade tensions, and USD weakness independent of US Fed policy.
Gold to remain supported this week
Gold’s demand should remain healthy as a plethora of risks remain on the table this week, OANDA analyst Ed Moya says.
“This is the week Wall Street starts to focus more on Main Street and that should keep safe haven flows coming gold’s way,” he says.
“Gold’s path to record territory could become very clear post inflation report and if more signs of banking stress emerge.”
Gold was paying ~US$2020/oz at 4:30pm EST Wednesday. Silver was also sitting pretty at US$25.40/oz, close to its highest point in ~12 months.
How did precious metals stocks perform yesterday?
Every stock above $1bn market cap finished flat or eked out a small win (largest: 7% for Resolute Mining (ASX:RSG), which is now up ~150% YTD).
All up, 84 stocks on our list went up, 85 went down, and 103 stayed the same.
Winners & Losers
Here’s how ASX-listed precious metals stocks are performing:
Scroll or swipe to reveal table. Click headings to sort. Best viewed on a laptop.
Stocks missing from this list? Email [email protected]
| CODE | COMPANY | WEDNESDAY RETURN % | 1 MONTH RETURN % | YTD RETURN % | 12 MONTH RETURN % | PRICE | MARKET CAP |
|---|---|---|---|---|---|---|---|
| CDR | Codrus Minerals Ltd | 40% | 25% | -8% | 20% | 0.12 | $3,476,980 |
| BEZ | Besragoldinc | 38% | 538% | 390% | 317% | 0.255 | $65,464,449 |
| GIB | Gibb River Diamonds | 30% | 11% | 2% | -2% | 0.061 | $9,940,944 |
| AVM | Advance Metals Ltd | 25% | 11% | 0% | -41% | 0.01 | $4,656,353 |
| OZM | Ozaurum Resources | 25% | 40% | 0% | -37% | 0.066 | $6,731,000 |
| CAI | Calidus Resources | 18% | 35% | 7% | -70% | 0.29 | $107,689,956 |
| GWR | GWR Group Ltd | 18% | 11% | 42% | -46% | 0.084 | $22,806,383 |
| AVW | Avira Resources Ltd | 17% | 17% | 17% | -50% | 0.0035 | $6,401,370 |
| RMX | Red Mount Min Ltd | 14% | -11% | -20% | -56% | 0.004 | $7,951,479 |
| THR | Thor Energy PLC | 13% | -10% | -25% | -72% | 0.0045 | $5,904,451 |
| XAM | Xanadu Mines Ltd | 12% | 47% | 62% | 62% | 0.047 | $68,788,616 |
| SKY | SKY Metals Ltd | 11% | 2% | 4% | -50% | 0.05 | $16,955,256 |
| OBM | Ora Banda Mining Ltd | 11% | 25% | 79% | 200% | 0.15 | $217,468,923 |
| ENR | Encounter Resources | 11% | 19% | -14% | -3% | 0.155 | $49,773,609 |
| IVR | Investigator Res Ltd | 11% | 85% | 50% | -7% | 0.063 | $81,918,463 |
| MEK | Meeka Metals Limited | 10% | 38% | -19% | 12% | 0.055 | $53,380,447 |
| TMX | Terrain Minerals | 9% | 9% | 0% | -48% | 0.006 | $5,957,596 |
| IPT | Impact Minerals | 9% | 33% | 71% | -5% | 0.012 | $27,295,076 |
| KZR | Kalamazoo Resources | 9% | 16% | -14% | -49% | 0.18 | $24,929,943 |
| RML | Resolution Minerals | 9% | 0% | -25% | -63% | 0.006 | $5,938,604 |
| GSM | Golden State Mining | 9% | -8% | -16% | -61% | 0.036 | $3,861,469 |
| IDA | Indiana Resources | 9% | -4% | -9% | -19% | 0.05 | $23,124,422 |
| ADG | Adelong Gold Limited | 8% | 100% | 100% | -53% | 0.014 | $6,939,690 |
| GBZ | GBM Rsources Ltd | 7% | -3% | -30% | -75% | 0.03 | $15,757,436 |
| ALY | Alchemy Resource Ltd | 7% | 0% | -35% | -17% | 0.015 | $16,493,068 |
| AAJ | Aruma Resources Ltd | 7% | 28% | 45% | -49% | 0.077 | $11,301,228 |
| MOH | Moho Resources | 7% | 7% | -24% | -73% | 0.016 | $3,114,933 |
| ALK | Alkane Resources Ltd | 7% | 37% | 67% | -27% | 0.895 | $502,985,777 |
| RSG | Resolute Mining | 7% | 72% | 145% | 66% | 0.49 | $979,343,022 |
| TG1 | Techgen Metals Ltd | 6% | 10% | -20% | -56% | 0.066 | $3,429,645 |
| AUT | Auteco Minerals | 6% | 28% | 0% | -36% | 0.051 | $111,016,142 |
| CY5 | Cygnus Metals Ltd | 6% | -24% | -32% | 53% | 0.26 | $45,049,182 |
| BCN | Beacon Minerals | 6% | 23% | 25% | 6% | 0.035 | $123,973,350 |
| BBX | BBX Minerals Ltd | 5% | -26% | -5% | -23% | 0.1 | $48,043,540 |
| MEU | Marmota Limited | 5% | 8% | -17% | -10% | 0.04 | $40,234,422 |
| GSN | Great Southern | 5% | 0% | -28% | -64% | 0.021 | $13,270,140 |
| KAI | Kairos Minerals Ltd | 5% | 31% | -9% | -28% | 0.021 | $39,281,870 |
| AWJ | Auric Mining | 5% | 29% | -2% | -27% | 0.063 | $7,851,575 |
| SNG | Siren Gold | 5% | -9% | -42% | -74% | 0.105 | $13,425,881 |
| PGO | Pacgold | 5% | 17% | 22% | -38% | 0.44 | $23,083,962 |
| MKR | Manuka Resources. | 5% | 36% | 6% | -69% | 0.09 | $43,240,932 |
| KRM | Kingsrose Mining Ltd | 5% | 13% | 5% | -16% | 0.068 | $48,914,224 |
| FAL | Falconmetalsltd | 4% | 12% | 30% | -1% | 0.365 | $61,950,000 |
| AUC | Ausgold Limited | 4% | 15% | 13% | -29% | 0.053 | $103,503,202 |
| DCN | Dacian Gold Ltd | 4% | -16% | -20% | -70% | 0.08 | $93,693,672 |
| CAZ | Cazaly Resources | 4% | -4% | -21% | -34% | 0.027 | $9,667,367 |
| M24 | Mamba Exploration | 4% | 13% | -7% | -4% | 0.135 | $7,927,834 |
| DEG | De Grey Mining | 4% | 16% | 27% | 33% | 1.63 | $2,451,032,057 |
| TSO | Tesoro Gold Ltd | 4% | -13% | -22% | -66% | 0.028 | $28,444,839 |
| S2R | S2 Resources | 3% | 15% | -12% | -12% | 0.15 | $59,463,271 |
| MI6 | Minerals260Limited | 3% | 34% | 32% | -10% | 0.45 | $101,790,000 |
| CWX | Carawine Resources | 3% | 8% | -2% | -53% | 0.098 | $18,697,659 |
| WAF | West African Res Ltd | 3% | 12% | -11% | -20% | 1.05 | $1,044,049,302 |
| KCC | Kincora Copper | 3% | -3% | -4% | -36% | 0.07 | $8,109,698 |
| TGM | Theta Gold Mines Ltd | 3% | 8% | 3% | -53% | 0.07 | $42,160,617 |
| AAU | Antilles Gold Ltd | 3% | 0% | 20% | -43% | 0.036 | $17,055,879 |
| RED | Red 5 Limited | 3% | 38% | -12% | -55% | 0.18 | $562,054,364 |
| BGL | Bellevue Gold Ltd | 3% | 29% | 30% | 55% | 1.47 | $1,614,667,454 |
| LM8 | Lunnonmetalslimited | 3% | 18% | 26% | 9% | 1.13 | $120,863,740 |
| FML | Focus Minerals Ltd | 3% | 6% | -25% | -24% | 0.19 | $53,013,349 |
| TAM | Tanami Gold NL | 3% | 10% | 0% | -34% | 0.039 | $44,653,688 |
| MKG | Mako Gold | 3% | -5% | 0% | -53% | 0.04 | $18,394,403 |
| MLS | Metals Australia | 3% | -2% | -8% | -73% | 0.041 | $24,281,448 |
| AGG | AngloGold Ashanti | 2% | 61% | 38% | 26% | 8.09 | $704,741,344 |
| RRL | Regis Resources | 2% | 36% | 9% | 7% | 2.25 | $1,661,057,035 |
| SVL | Silver Mines Limited | 2% | 69% | 23% | 7% | 0.245 | $336,964,714 |
| LEX | Lefroy Exploration | 2% | 11% | -4% | -22% | 0.25 | $39,312,210 |
| GOR | Gold Road Res Ltd | 2% | 27% | 6% | 13% | 1.795 | $1,898,021,648 |
| CMM | Capricorn Metals | 2% | 28% | 5% | 15% | 4.85 | $1,788,608,913 |
| NST | Northern Star | 2% | 30% | 26% | 28% | 13.7 | $15,478,265,892 |
| HRZ | Horizon | 2% | 22% | -2% | -56% | 0.06 | $41,122,037 |
| TBR | Tribune Res Ltd | 2% | 20% | -1% | -19% | 3.98 | $205,674,862 |
| TUL | Tulla Resources | 2% | 52% | 0% | -46% | 0.335 | $106,195,321 |
| SFR | Sandfire Resources | 1% | 26% | 25% | 24% | 6.8 | $3,061,175,918 |
| PNR | Pantoro Limited | 1% | 45% | -23% | -76% | 0.074 | $221,103,902 |
| DTM | Dart Mining NL | 1% | 79% | 36% | -7% | 0.075 | $11,515,921 |
| SXG | Southern Cross Gold | 1% | 27% | -5% | 0% | 0.76 | $67,369,474 |
| BGD | Bartongoldholdings | 1% | -2% | 15% | -2% | 0.23 | $19,640,780 |
| PRU | Perseus Mining Ltd | 1% | 23% | 14% | 29% | 2.41 | $3,269,232,172 |
| CHN | Chalice Mining Ltd | 1% | 26% | 25% | 11% | 7.85 | $2,936,288,113 |
| SMI | Santana Minerals Ltd | 1% | 1% | 22% | 43% | 0.8 | $118,278,190 |
| CHZ | Chesser Resources | 1% | -8% | -3% | -25% | 0.0825 | $48,265,311 |
| EMR | Emerald Res NL | 1% | 20% | 46% | 45% | 1.735 | $1,024,306,696 |
| EVN | Evolution Mining Ltd | 1% | 27% | 18% | -20% | 3.53 | $6,440,907,280 |
| SSR | SSR Mining Inc. | 0% | 22% | 2% | -22% | 23.6 | $431,639,916 |
| SLR | Silver Lake Resource | 0% | 27% | 5% | -40% | 1.25 | $1,157,531,695 |
| IGO | IGO Limited | 0% | -2% | -7% | -10% | 12.58 | $9,503,711,053 |
| MRR | Minrex Resources Ltd | 0% | -47% | -50% | -78% | 0.016 | $17,357,880 |
| NPM | Newpeak Metals | 0% | 0% | 0% | 0% | 0.001 | $9,145,132 |
| FFX | Firefinch Ltd | 0% | 0% | 0% | -46% | 0.2 | $236,569,315 |
| NMR | Native Mineral Res | 0% | -49% | -69% | -83% | 0.034 | $4,084,717 |
| AQX | Alice Queen Ltd | 0% | 0% | -50% | -86% | 0.001 | $2,530,288 |
| KSN | Kingston Resources | 0% | 35% | 42% | -34% | 0.115 | $47,800,170 |
| PNX | PNX Metals Limited | 0% | 0% | -29% | -47% | 0.003 | $16,141,874 |
| CST | Castile Resources | 0% | 1% | -2% | -47% | 0.093 | $22,496,926 |
| FAU | First Au Ltd | 0% | 71% | 50% | -63% | 0.006 | $6,568,700 |
| GTR | Gti Energy Ltd | 0% | -8% | -17% | -63% | 0.009 | $16,132,352 |
| PUA | Peak Minerals Ltd | 0% | -20% | -33% | -76% | 0.004 | $4,165,506 |
| MRZ | Mont Royal Resources | 0% | -45% | -40% | -72% | 0.105 | $7,190,680 |
| SMS | Starmineralslimited | 0% | 7% | 0% | -64% | 0.072 | $2,170,209 |
| PRX | Prodigy Gold NL | 0% | 9% | 0% | -39% | 0.012 | $20,974,594 |
| RND | Rand Mining Ltd | 0% | 2% | -2% | -13% | 1.33 | $75,645,028 |
| BMR | Ballymore Resources | 0% | 14% | 7% | -20% | 0.16 | $15,410,793 |
| ZNC | Zenith Minerals Ltd | 0% | -30% | -43% | -62% | 0.15 | $52,755,907 |
| REZ | Resourc & En Grp Ltd | 0% | 0% | -19% | -72% | 0.013 | $6,497,475 |
| GMR | Golden Rim Resources | 0% | 17% | 10% | -54% | 0.034 | $20,114,005 |
| KAL | Kalgoorliegoldmining | 0% | -26% | -40% | -69% | 0.05 | $3,876,051 |
| ADN | Andromeda Metals Ltd | 0% | 4% | 11% | -57% | 0.049 | $152,390,413 |
| SIH | Sihayo Gold Limited | 0% | 0% | 0% | -56% | 0.002 | $12,204,256 |
| WRM | White Rock Min Ltd | 0% | -3% | -5% | -69% | 0.063 | $17,373,121 |
| MCT | Metalicity Limited | 0% | -17% | -17% | -57% | 0.0025 | $8,761,348 |
| CTO | Citigold Corp Ltd | 0% | 20% | 0% | -33% | 0.006 | $17,241,955 |
| M2R | Miramar | 0% | -24% | -45% | -73% | 0.044 | $3,437,357 |
| MHC | Manhattan Corp Ltd | 0% | 0% | -9% | -64% | 0.005 | $14,681,393 |
| GRL | Godolphin Resources | 0% | 10% | -22% | -50% | 0.065 | $7,694,014 |
| TRY | Troy Resources Ltd | 0% | 0% | 0% | 0% | 0.0295 | $62,920,961 |
| CGN | Crater Gold Min Ltd | 0% | 0% | 0% | 0% | 0.014499 | $17,965,037 |
| SVG | Savannah Goldfields | 0% | -3% | -13% | -31% | 0.165 | $31,159,992 |
| GUL | Gullewa Limited | 0% | -5% | -8% | -23% | 0.055 | $10,767,521 |
| ADV | Ardiden Ltd | 0% | 14% | 14% | -43% | 0.008 | $21,506,683 |
| AAR | Astral Resources NL | 0% | 19% | 15% | -20% | 0.083 | $55,229,028 |
| MGV | Musgrave Minerals | 0% | 36% | 7% | -34% | 0.225 | $133,021,789 |
| NAE | New Age Exploration | 0% | 20% | -14% | -57% | 0.006 | $8,615,393 |
| VKA | Viking Mines Ltd | 0% | 10% | 10% | 0% | 0.011 | $11,277,843 |
| MTH | Mithril Resources | 0% | 0% | -43% | -82% | 0.002 | $6,526,180 |
| XTC | Xantippe Res Ltd | 0% | -27% | -20% | -69% | 0.004 | $42,320,399 |
| MAU | Magnetic Resources | 0% | -6% | -21% | -53% | 0.68 | $156,068,419 |
| EM2 | Eagle Mountain | 0% | -20% | -12% | -66% | 0.15 | $45,745,029 |
| BYH | Bryah Resources Ltd | 0% | 5% | -12% | -59% | 0.023 | $6,468,830 |
| PGD | Peregrine Gold | 0% | -9% | 0% | -20% | 0.385 | $18,513,598 |
| ICL | Iceni Gold | 0% | -23% | -13% | -36% | 0.07 | $8,973,750 |
| WWI | West Wits Mining Ltd | 0% | 42% | 6% | -47% | 0.017 | $36,706,069 |
| AL8 | Alderan Resource Ltd | 0% | 14% | 14% | -69% | 0.008 | $4,859,271 |
| GMN | Gold Mountain Ltd | 0% | -13% | -50% | -50% | 0.0035 | $6,894,764 |
| HMG | Hamelingoldlimited | 0% | 6% | -34% | -37% | 0.095 | $10,450,000 |
| TBA | Tombola Gold Ltd | 0% | 0% | 0% | -50% | 0.026 | $33,129,243 |
| HRN | Horizon Gold Ltd | 0% | 13% | 10% | -13% | 0.34 | $42,561,758 |
| CLA | Celsius Resource Ltd | 0% | -6% | -6% | -42% | 0.015 | $28,090,775 |
| QML | Qmines Limited | 0% | 0% | -9% | -48% | 0.15 | $13,531,355 |
| RDN | Raiden Resources Ltd | 0% | -20% | -20% | -73% | 0.004 | $6,618,330 |
| EMU | EMU NL | 0% | -20% | -59% | -87% | 0.002 | $2,900,043 |
| X64 | Ten Sixty Four Ltd | 0% | 0% | -11% | -34% | 0.57 | $130,184,182 |
| HAW | Hawthorn Resources | 0% | -19% | -33% | -33% | 0.077 | $25,796,202 |
| AGC | AGC Ltd | 0% | 10% | -8% | -35% | 0.055 | $5,500,000 |
| RVR | Red River Resources | 0% | 0% | 0% | -69% | 0.073 | $37,847,908 |
| OKR | Okapi Resources | 0% | -16% | -10% | -69% | 0.135 | $24,784,085 |
| MM8 | Medallion Metals. | 0% | 17% | -13% | -52% | 0.135 | $31,135,390 |
| CBY | Canterbury Resources | 0% | -13% | -15% | -44% | 0.035 | $5,058,324 |
| LYN | Lycaonresources | 0% | -28% | -38% | -60% | 0.17 | $5,596,188 |
| TMZ | Thomson Res Ltd | 0% | 0% | -74% | -90% | 0.005 | $4,349,755 |
| WMC | Wiluna Mining Corp | 0% | 0% | 0% | -73% | 0.205 | $74,238,031 |
| BMO | Bastion Minerals | 0% | -24% | -24% | -83% | 0.026 | $4,144,701 |
| NSM | Northstaw | 0% | -4% | -16% | -54% | 0.13 | $15,616,510 |
| MDI | Middle Island Res | 0% | -25% | -5% | -71% | 0.036 | $4,407,056 |
| BAT | Battery Minerals Ltd | 0% | 11% | 25% | -44% | 0.005 | $14,676,212 |
| POL | Polymetals Resources | 0% | 3% | -27% | 50% | 0.18 | $8,132,885 |
| KAU | Kaiser Reef | 0% | 6% | 9% | -12% | 0.18 | $25,505,583 |
| MXR | Maximus Resources | 0% | 27% | 5% | -45% | 0.042 | $13,400,342 |
| CXU | Cauldron Energy Ltd | 0% | 0% | 0% | -64% | 0.007 | $6,520,981 |
| HXG | Hexagon Energy | 0% | 0% | -29% | -71% | 0.012 | $6,154,991 |
| PDI | Predictive Disc Ltd | 0% | 3% | 0% | -10% | 0.18 | $321,413,766 |
| ZAG | Zuleika Gold Ltd | 0% | 0% | -38% | -59% | 0.013 | $6,799,658 |
| SBM | St Barbara Limited | 0% | 21% | -17% | -55% | 0.645 | $526,669,361 |
| STK | Strickland Metals | 0% | 5% | 0% | -26% | 0.04 | $62,197,150 |
| CEL | Challenger Exp Ltd | 0% | 38% | -6% | -48% | 0.165 | $172,696,981 |
| AQI | Alicanto Min Ltd | 0% | -9% | -2% | -60% | 0.042 | $18,740,972 |
| ARN | Aldoro Resources | 0% | -20% | 13% | -33% | 0.18 | $20,324,217 |
| A8G | Australasian Metals | 0% | 17% | -8% | -65% | 0.175 | $7,204,836 |
| TAR | Taruga Minerals | 0% | 0% | -33% | -38% | 0.016 | $11,296,429 |
| NES | Nelson Resources. | 0% | 0% | -14% | -62% | 0.006 | $3,531,566 |
| RMS | Ramelius Resources | 0% | 55% | 56% | 4% | 1.45 | $1,266,210,573 |
| PKO | Peako Limited | 0% | -25% | -38% | -53% | 0.009 | $4,236,583 |
| ICG | Inca Minerals Ltd | 0% | -18% | -22% | -86% | 0.018 | $8,703,261 |
| GNM | Great Northern | 0% | -14% | -25% | -50% | 0.003 | $5,127,153 |
| TRM | Truscott Mining Corp | 0% | -8% | 15% | 2% | 0.047 | $7,856,382 |
| DEX | Duke Exploration | 0% | 0% | 0% | -66% | 0.053 | $5,587,240 |
| MOM | Moab Minerals Ltd | 0% | -13% | -22% | -75% | 0.007 | $4,773,744 |
| KNB | Koonenberrygold | 0% | 11% | -3% | -37% | 0.06 | $4,545,387 |
| PNM | Pacific Nickel Mines | 0% | 29% | 2% | -23% | 0.085 | $32,300,360 |
| AYM | Australia United Min | 0% | 33% | 33% | -43% | 0.004 | $7,370,310 |
| ANL | Amani Gold Ltd | 0% | 0% | 0% | -50% | 0.001 | $24,693,441 |
| GCY | Gascoyne Res Ltd | 0% | 19% | -25% | -51% | 0.125 | $86,704,763 |
| PNT | Panthermetalsltd | 0% | -11% | -44% | -53% | 0.105 | $3,228,750 |
| GMD | Genesis Minerals | 0% | 9% | -12% | -44% | 1.1 | $456,618,702 |
| CLZ | Classic Min Ltd | 0% | -50% | -89% | -99% | 0.001 | $3,093,095 |
| TMB | Tambourahmetals | 0% | -11% | -19% | -69% | 0.085 | $3,501,371 |
| NCM | Newcrest Mining | 0% | 27% | 44% | 5% | 29.66 | $26,594,421,970 |
| HCH | Hot Chili Ltd | -1% | 14% | 18% | -30% | 1.03 | $124,223,014 |
| RXL | Rox Resources | -1% | 70% | 129% | 6% | 0.4 | $90,863,475 |
| RXL | Rox Resources | -1% | 70% | 129% | 6% | 0.4 | $90,863,475 |
| TIE | Tietto Minerals | -1% | 33% | 6% | 49% | 0.745 | $821,083,255 |
| ERM | Emmerson Resources | -1% | 0% | -1% | -47% | 0.074 | $40,853,234 |
| BM8 | Battery Age Minerals | -1% | -9% | -27% | -27% | 0.365 | $27,460,720 |
| AME | Alto Metals Limited | -1% | 6% | 3% | -18% | 0.069 | $42,897,084 |
| EMC | Everest Metals Corp | -1% | -15% | -13% | -56% | 0.069 | $7,450,318 |
| TCG | Turaco Gold Limited | -1% | 5% | 17% | -38% | 0.068 | $29,512,450 |
| CYL | Catalyst Metals | -2% | -17% | -17% | -49% | 0.985 | $174,684,823 |
| SFM | Santa Fe Minerals | -2% | -12% | -25% | -50% | 0.06 | $4,441,946 |
| HAV | Havilah Resources | -2% | -10% | -9% | 54% | 0.3 | $96,574,959 |
| WGX | Westgold Resources. | -2% | 59% | 70% | -20% | 1.485 | $715,170,322 |
| GML | Gateway Mining | -2% | 28% | -2% | -46% | 0.059 | $15,980,013 |
| TTM | Titan Minerals | -2% | -6% | -15% | -42% | 0.057 | $81,853,845 |
| KCN | Kingsgate Consolid. | -2% | 7% | -9% | -12% | 1.565 | $401,969,539 |
| HMX | Hammer Metals Ltd | -2% | 61% | 44% | -2% | 0.098 | $82,140,735 |
| BRB | Breaker Res NL | -2% | 81% | 53% | 96% | 0.49 | $163,441,091 |
| FG1 | Flynngold | -2% | 19% | -6% | -45% | 0.094 | $9,875,860 |
| MAT | Matsa Resources | -2% | 10% | 19% | -36% | 0.044 | $18,540,208 |
| MEG | Megado Minerals Ltd | -2% | 2% | -7% | -62% | 0.042 | $6,151,389 |
| NWM | Norwest Minerals | -2% | 27% | -22% | -30% | 0.042 | $10,636,962 |
| A1G | African Gold Ltd. | -2% | -7% | -2% | -45% | 0.081 | $14,052,831 |
| BNZ | Benzmining | -2% | 0% | -2% | -43% | 0.4 | $29,952,468 |
| ADT | Adriatic Metals | -3% | -7% | 11% | 37% | 3.51 | $800,468,006 |
| STN | Saturn Metals | -3% | 39% | 8% | -50% | 0.195 | $30,309,705 |
| MZZ | Matador Mining Ltd | -3% | -4% | -34% | -70% | 0.076 | $24,587,069 |
| ANX | Anax Metals Ltd | -3% | 15% | 34% | -27% | 0.071 | $29,885,822 |
| DTR | Dateline Resources | -3% | -17% | -53% | -85% | 0.0175 | $11,588,752 |
| MTC | Metalstech Ltd | -3% | -16% | -35% | 13% | 0.34 | $62,109,107 |
| SVY | Stavely Minerals Ltd | -3% | -11% | -31% | -61% | 0.17 | $57,097,900 |
| USL | Unico Silver Limited | -3% | 31% | 0% | -26% | 0.17 | $43,637,504 |
| DRE | Dreadnought Resources Ltd | -3% | -1% | -36% | 56% | 0.067 | $228,578,247 |
| NML | Navarre Minerals Ltd | -3% | 6% | -20% | -62% | 0.033 | $51,097,891 |
| AMI | Aurelia Metals Ltd | -3% | 45% | 16% | -70% | 0.145 | $185,615,582 |
| LCL | Los Cerros Limited | -3% | -12% | -49% | -73% | 0.029 | $23,829,134 |
| MBK | Metal Bank Ltd | -3% | 0% | -15% | -52% | 0.029 | $8,294,566 |
| TLM | Talisman Mining | -3% | 7% | 4% | -15% | 0.145 | $28,160,925 |
| KTA | Krakatoa Resources | -3% | -13% | -36% | -53% | 0.028 | $9,996,588 |
| RDT | Red Dirt Metals Ltd | -4% | 0% | -19% | -28% | 0.385 | $178,042,996 |
| SPQ | Superior Resources | -4% | -17% | -11% | 4% | 0.05 | $88,463,462 |
| SPD | Southernpalladium | -4% | 4% | -38% | 0% | 0.5 | $22,400,730 |
| SRN | Surefire Rescs NL | -4% | 33% | 100% | 50% | 0.024 | $39,534,087 |
| BC8 | Black Cat Syndicate | -4% | 15% | 27% | -32% | 0.45 | $125,285,293 |
| GBR | Greatbould Resources | -4% | -9% | 0% | -26% | 0.09 | $42,202,706 |
| ASO | Aston Minerals Ltd | -4% | 2% | 38% | -31% | 0.11 | $128,194,057 |
| YRL | Yandal Resources | -4% | -5% | -10% | -60% | 0.088 | $14,517,883 |
| AZS | Azure Minerals | -4% | 54% | 91% | 28% | 0.43 | $175,606,232 |
| KIN | KIN Min NL | -4% | -14% | -34% | -52% | 0.043 | $53,016,775 |
| GSR | Greenstone Resources | -5% | -13% | -34% | -43% | 0.021 | $26,568,937 |
| G50 | Gold50Limited | -5% | -13% | -20% | -23% | 0.2 | $11,958,030 |
| SLZ | Sultan Resources Ltd | -5% | -33% | -54% | -75% | 0.039 | $4,234,660 |
| GAL | Galileo Mining Ltd | -5% | 6% | -16% | 252% | 0.74 | $154,147,443 |
| AM7 | Arcadia Minerals | -5% | -22% | -15% | -33% | 0.175 | $8,639,110 |
| KWR | Kingwest Resources | -5% | 17% | 0% | -81% | 0.035 | $10,423,892 |
| BNR | Bulletin Res Ltd | -6% | -15% | -9% | -60% | 0.085 | $26,423,199 |
| MVL | Marvel Gold Limited | -6% | -6% | -35% | -62% | 0.017 | $12,691,699 |
| PUR | Pursuit Minerals | -6% | -23% | 6% | -48% | 0.017 | $46,495,516 |
| CPM | Coopermetalslimited | -6% | 36% | 30% | -15% | 0.305 | $13,355,875 |
| GED | Golden Deeps | -6% | -21% | -17% | -64% | 0.0075 | $9,241,814 |
| SBR | Sabre Resources | -6% | -22% | -41% | -68% | 0.0225 | $6,995,668 |
| ORN | Orion Minerals Ltd | -6% | -9% | -6% | -38% | 0.015 | $87,452,173 |
| LRL | Labyrinth Resources | -7% | 17% | -18% | -68% | 0.014 | $14,392,310 |
| WA8 | Warriedarresourltd | -7% | -10% | -21% | -4% | 0.135 | $62,503,528 |
| WCN | White Cliff Min Ltd | -7% | -41% | -54% | -79% | 0.0065 | $5,488,381 |
| ARV | Artemis Resources | -7% | -7% | -48% | -82% | 0.013 | $21,859,857 |
| NXM | Nexus Minerals Ltd | -7% | -9% | -23% | -57% | 0.155 | $54,513,429 |
| VMC | Venus Metals Cor Ltd | -8% | 23% | 37% | -3% | 0.185 | $35,615,737 |
| NVA | Nova Minerals Ltd | -8% | -33% | -56% | -65% | 0.3 | $68,539,177 |
| ARL | Ardea Resources Ltd | -8% | -18% | -44% | -78% | 0.4 | $74,603,706 |
| FEG | Far East Gold | -8% | -11% | -41% | 10% | 0.285 | $47,444,945 |
| ASR | Asra Minerals Ltd | -8% | -8% | -45% | -61% | 0.011 | $17,605,424 |
| VRC | Volt Resources Ltd | -8% | -8% | -27% | -45% | 0.011 | $47,273,087 |
| MEI | Meteoric Resources | -9% | -9% | 98% | 556% | 0.105 | $176,173,110 |
| SAU | Southern Gold | -9% | -5% | -16% | -60% | 0.021 | $6,906,561 |
| SI6 | SI6 Metals Limited | -10% | -25% | -25% | -55% | 0.0045 | $7,476,973 |
| G88 | Golden Mile Res Ltd | -11% | 47% | 23% | -62% | 0.025 | $7,376,103 |
| RDS | Redstone Resources | -11% | -11% | 0% | -27% | 0.008 | $6,631,492 |
| PRS | Prospech Limited | -11% | 112% | 75% | -15% | 0.047 | $5,381,799 |
| RGL | Riversgold | -12% | -17% | -50% | -81% | 0.015 | $16,072,951 |
| LCY | Legacy Iron Ore | -13% | -22% | -26% | -50% | 0.014 | $102,509,219 |
| NAG | Nagambie Resources | -13% | -27% | -39% | -18% | 0.04 | $24,641,915 |
| BTR | Brightstar Resources | -13% | -19% | -24% | -61% | 0.013 | $12,489,432 |
| OAU | Ora Gold Limited | -17% | -17% | -50% | -75% | 0.0025 | $11,810,775 |
| CDT | Castle Minerals | -21% | -32% | -29% | -74% | 0.015 | $21,365,367 |
| DCX | Discovex Res Ltd | -25% | 0% | 0% | -61% | 0.003 | $13,210,272 |
The post Gold Digger: Macro drivers point to a gold bull market. Why hasn’t it happened yet? appeared first on Stockhead.


Canadian Silver Co. Will See Big Changes in 2024
Source: Michael Ballanger 12/22/2023
Michael Ballanger of GGM Advisory Inc. takes a look at the current state of the market and shares on stock…
EGR options out Urban Berry project in Quebec to Harvest Gold – Richard Mills
2023.12.23
EGR Exploration Ltd. (TSXV: EGR) has moved from owner to shareholder at its Urban Berry project in Quebec, this week announcing it is optioning…
Crypto, Crude, & Crap Stocks Rally As Yield Curve Steepens, Rate-Cut Hopes Soar
Crypto, Crude, & Crap Stocks Rally As Yield Curve Steepens, Rate-Cut Hopes Soar
A weird week of macro data – strong jobless claims but…


