Precious Metals
These 3 Indicators Point to an Imminent Crash
What we’re about to tell you will shake you to your core. Everything you’ve been taught about safe-haven assets? It’s all a LIE. A deception created…

What we’re about to tell you will shake you to your core.
Everything you’ve been taught about safe-haven assets? It’s all a LIE.
A deception created by those in power to keep you in the dark and in line. And we’re not just saying this to rile you up or to push some hidden agenda.
We have the PROOF.
Dr. Mark Skousen, a renowned economist and university professor, understands this better than anyone.
In fact, he recently sat down for an interview to discuss his Biden Disaster Plan. He explains how folks can fight back against the triple threat facing every American: inflation, supply shortages and what we’d argue is a full-blown energy crisis.
It’s a rare chance to take a peek behind the curtain that you don’t want to miss.
Click here to catch Dr. Mark Skousen’s interview
Now, we aren’t just bringing this up out of convenience…
…because what we’re about to show you, HOW gold and two other leading indicators work, will change the way you look at the markets forever.
What Gold Says
I want to start off by showing you the long-term correlation between gold and the S&P 500.
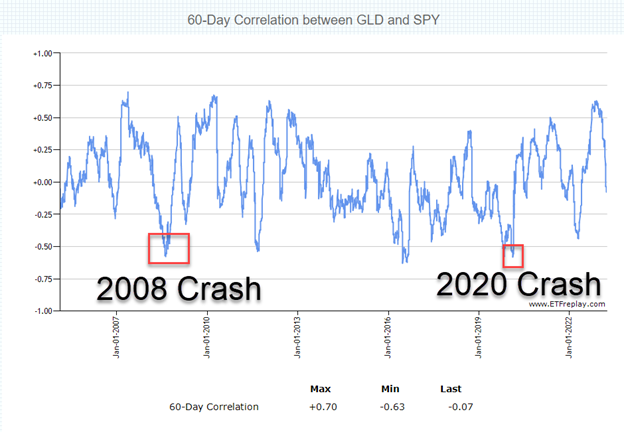
Source: ETFreplay.com
For those not familiar with correlations, they measure how well two assets move together on a scale from -1 to +1.
- -1 means they move perfectly in opposite directions
- +1 means they move perfectly in the same direction
- 0 means they have no connection whatsoever
Generally speaking, gold and equities have no connection…not what you expected, right?
We could spend hours discussing why, but for now, let’s accept the facts as they are.
Now, let’s pull up a chart of gold.
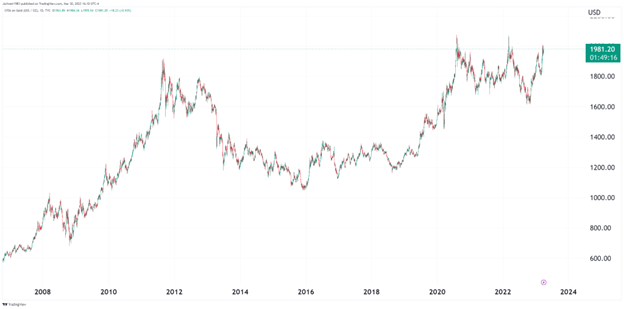
Source: www.tradingview.com
Gold is closing in on and likely to break $2,000 an ounce.
Well, if they’re not correlated, then who cares?
That’s where most folks stop without looking at the next layer.
You see, the current correlation has gone from positive to negative.
Now, go back to the correlation chart and look at 2008 and 2020. In both instances, the correlation between gold and equities went from positive to negative, and in the case of 2008, from very positive to negative.
This points to gold’s role as a traditional safety for IMMINENT MARKET CRASHES.
Let’s take this a step further to the greenback.
Dollar for Dollar
Ready for mind-blowing round #2?
Check out the correlation between the U.S. dollar and the S&P 500.
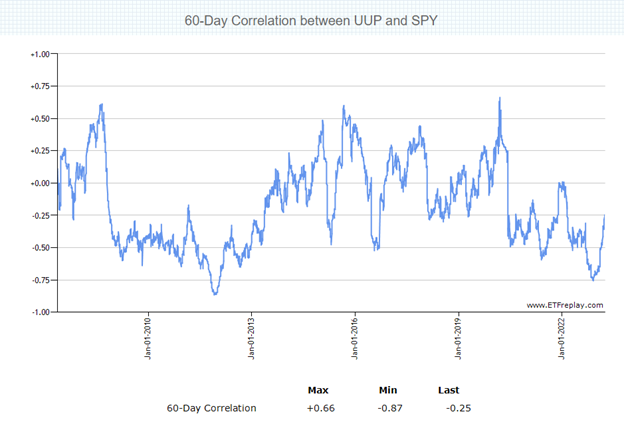
Source: ETFreplay.com
Oh yes, the correlation changes over time!
Prior to the 2008 crash, the dollar and equities had a positive relationship. After the crash, they went negative. The same thing happened in 2020 as investors flocked to the dollar for safety.
So, the rising correlation should be a good sign, right?
Well, it would be if the dollar was going higher. But it’s not.
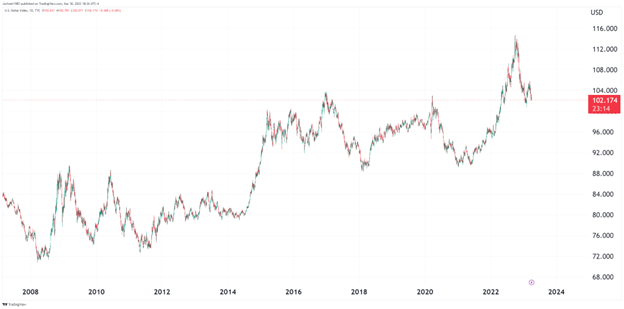
Source: www.tradingview.com
Right now, the dollar is dropping hard and fast… exactly what the Fed DOESN’T WANT!
They don’t want international demand for U.S. products to increase when they’re trying to slow down the economy.
A lower dollar means higher inflation. Higher inflation means the Fed needs to raise rates higher.
And since banks are already failing under the weight of current rates, what do you think happens when they go unexpectedly higher?
But alas, there is one last indicator that EVERYONE is misreading.
Fear as Measured by the VIX
The Chicago Board of Exchange (CBOE) publishes an index known as the Volatility Index, or the VIX.
Most of us know it as the “fear gauge.”
The VIX measures options demand on the S&P 500 index for an expiration 30 days in the future.
Big money buys puts on the S&P 500 as a hedge for their stock portfolio. When the market tanks, the puts pay out since they profit from drops in the S&P 500. This offsets losses from their stock portfolio.
Here’s what’s important to know: The VIX and S&P 500 move almost perfectly in opposite directions.
It is one of the tightest correlations in the market.
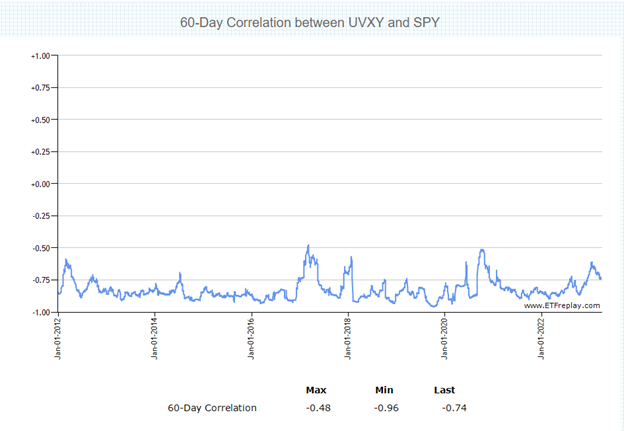
Source: ETFreplay.com
So, it’s pretty safe to say stocks usually go up when the VIX goes down. Think of it like a see-saw.
Even though the correlation is tightly woven, the VIX is mean-reverting and generally less prone to price spikes.
In layman’s terms — the further from the average it gets, the greater the odds it snaps back. And once it snaps back, it tends not to move away for quite a while.
On a chart, this is what it looks like.
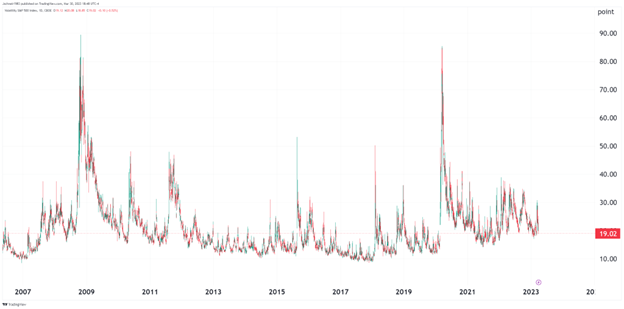
Source: ETFreplay.com
Now, I want to show you something that isn’t quite so obvious at first glance.
Take a look at the same chart with markups below.
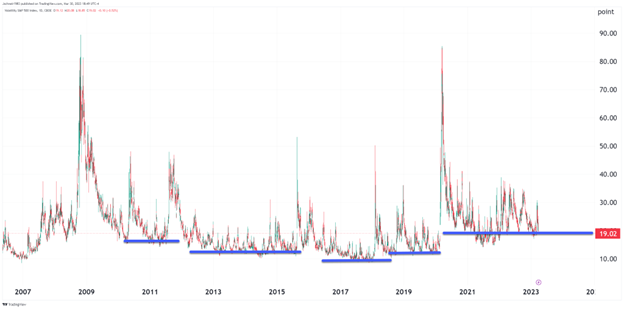
Source: www.tradingview.com
These lines represent the lower levels for the VIX during multi-year periods. The majority of those fell between the historical average of 15-18.
The current one sits closer to 20. It did go below for part of 2021. Otherwise, we’ve been in a period of elevated volatility ever since the pandemic.
Right now, we’re at that lower boundary again, except there’s a problem.
When the VIX last came down off elevated levels, it was August 2022. Back then, the S&P 500 was around $4,300. It trades at $4,050 right now.
Think of it this way…
Right now, market drops are far more frequent compared to the decade before the pandemic. Back then, they happened maybe once a year. Now they happen every month or two.
Every time the VIX returns to the bottom end of the range, it resets for another market drop. That’s fine so long as the S&P 500 is at the same level or higher as the last reset.
It is a BIG PROBLEM when the reset happens at a lower level.
So, while everyone on television is giddy about fear leaving the market, you now know that’s just complacency ready to be cracked like an egg.
Taking Charge
We’ve said it before, and we’ll say it again…
You need a well-crafted PLAN to survive what’s coming – one built on experience and, frankly, healthy skepticism.
That’s why if you do nothing else today, set aside just a few minutes to watch this important interview with Dr. Mark Skousen. We promise you won’t be disappointed.
Click here to catch Dr. Mark Skousen’s interview!
The post These 3 Indicators Point to an Imminent Crash appeared first on Stock Investor.


Canadian Silver Co. Will See Big Changes in 2024
Source: Michael Ballanger 12/22/2023
Michael Ballanger of GGM Advisory Inc. takes a look at the current state of the market and shares on stock…
EGR options out Urban Berry project in Quebec to Harvest Gold – Richard Mills
2023.12.23
EGR Exploration Ltd. (TSXV: EGR) has moved from owner to shareholder at its Urban Berry project in Quebec, this week announcing it is optioning…
Crypto, Crude, & Crap Stocks Rally As Yield Curve Steepens, Rate-Cut Hopes Soar
Crypto, Crude, & Crap Stocks Rally As Yield Curve Steepens, Rate-Cut Hopes Soar
A weird week of macro data – strong jobless claims but…


