Precious Metals
The actual Big News in this morning’s housing report was – positive
– by New Deal democratFor the second month in a row, the biggest news in the housing report was not in the headlines. Most of what you are going to…
– by New Deal democrat
For the second month in a row, the biggest news in the housing report was not in the headlines.
Most of what you are going to read is about how bad housing permits and starts were, and that they are recessionary.
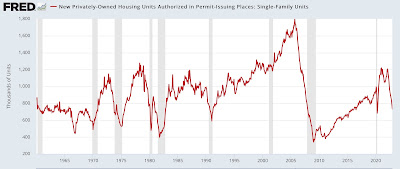
And it’s true. In particular, the most leading and least noisy housing metric of all is single family permits, and they declined another 6%+ to 830,000 annualized, their lowest reading in over 5 years excepting the pandemic lockdown month of April 2020:

They are also down 39% from their peak in early 2022. This is recessionary, plain and simple.
The recessionary or near-recessionary figures also include total permits (gold in the graph below), down 1.5% to 1330 for the month and down 30% from their 2022 peak, also the lowest in 4 years except for two pandemic lockdown months; and total starts (blue), down 1.4% for the month, down 19% from their 2022 peak, and also the lowest since the pandemic lockdowns. I’ve also included housing permitted but not started (gray, right scale), which is down 4% from its peak in October. We’ll come back to the red line later:

But that’s not the most important story in this morning’s report.
As shown in the two graphs below, going back 50+ years, the typical pattern in the housing market is:
1. Permits (gold) peak
2. Within a month or two later, starts (blue) peak.
3. After that, units permitted but not started (gray) peak.
4. Finally, housing units under construction (red) peaks:


To make the relationship easier to see, below I’ve simply included permits (blue) and units under construction (red):

Going back 50+ years, units under construction have *always* peaked with a delay, and *always* declined, almost always by over 5% (the exceptions being 2001 and the pandemic) before a recession began.
And what happened with housing units under construction in December? They made an all-time high, that’s what (as best shown in the close-up graph of the last two years above).
Most importantly, it is housing units under construction, not permits and not starts, that are the “real” economic activity in housing.
I am surprised that actual housing construction has held up this long – and this past year has been the biggest lag ever between the downturns in permits and starts, and a downturn in construction. And I *do* expect it to ultimately follow suit, and turn down in a big way. But until this happens, new housing construction is making a *positive* contribution to the economy.
That’s the actual big news from the December report.


Canadian Silver Co. Will See Big Changes in 2024
Source: Michael Ballanger 12/22/2023
Michael Ballanger of GGM Advisory Inc. takes a look at the current state of the market and shares on stock…
EGR options out Urban Berry project in Quebec to Harvest Gold – Richard Mills
2023.12.23
EGR Exploration Ltd. (TSXV: EGR) has moved from owner to shareholder at its Urban Berry project in Quebec, this week announcing it is optioning…
Crypto, Crude, & Crap Stocks Rally As Yield Curve Steepens, Rate-Cut Hopes Soar
Crypto, Crude, & Crap Stocks Rally As Yield Curve Steepens, Rate-Cut Hopes Soar
A weird week of macro data – strong jobless claims but…
