Precious Metals
Stock Market Outlook: New Year, New Calendar Range
Welcome to the new year and the new January reset! The January 6-month calendar range could be even more influential than usual. Let me explain before…
Welcome to the new year and the new January reset! The January 6-month calendar range could be even more influential than usual.
Let me explain before showing you the S&P 500 ETF (SPY) price chart…
After the first 10-trading days in January, a range is established.
That range becomes a guideline for the next 6 months until it resets in July. Should an instrument clear the top of the range by the end of the 10-days, the statistical chance of follow through to the upside is more significant.
Conversely, should an instrument break the bottom of the range by the end of the 10-days, the statistical chance of follow through to the downside is more significant.
Should the instrument remain within the trading range, then one would expect more chop until the range resolves one way or another.
We at MarketGauge, are particularly focused on this upcoming calendar range because of how seamlessly it corresponds with resistance both in price and the moving averages.
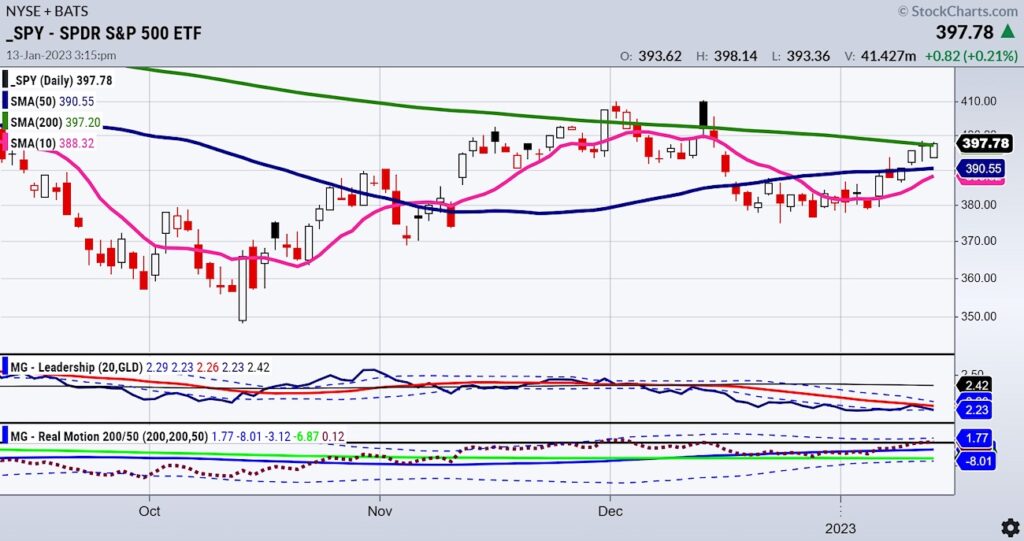
Here is a chart of SPY on a daily timeframe.

And for fun, we use Gold (GLD) as our Benchmark, straight from our ACP Plug-in and Triple Play Leadership Indicator.
We have completed the first 9 days of trading, which means by Thursday the 19th, the January 6-month calendar range will be set.
The price and very likely the top of full 10 days of the trading range corresponds beautifully with the 200-day moving average (green line).
And the price and very likely the bottom of the full 10 days of trading range corresponds beautifully with the 50 and 10-day moving averages (blue and cyan lines).
How clean is that?
A break above the price range will also take the SPY into an accumulation phase clearing the 200-DMA, most likely yielding more upside.
Conversely, a break below the price range will also take the SPY into a bearish phase below the 50 and 10-DMAs, most likely yielding more downside.
Look how SPY is underperforming gold? Inflation peaked you say? Gold versus the SPY says otherwise.
Also note that our other ACP Plug-In from Triple Play or Real Motion (momentum indicator), is stronger, above both the positively sloped and stacked 50 and 200 moving averages.
However, the RM indicator is also into resistance at the Bollinger Band, which could suggest an overbought SPY with a mean reversion on the horizon.
Regardless, we are ready and excitedly waiting to see which way the January calendar range resolves.
Of course, there are other factors to watch along with the calendar ranges.
And every instrument will create a range.
So, keep big eyes on what happens once the 6-month range is established.
At that point, you will have another reliable indicator to follow, which should help you eliminate the noise of the talking heads.
Stock Market ETFs Trading Analysis & Summary:
S&P 500 (SPY) Closed above the 200-DMA, now has to stay above and clear 400.
Russell 2000 (IWM) Can it get through 190? A gamechanger if it does.
Dow Jones Industrials (DIA) Dec high 348.22 now looms.
Nasdaq (QQQ) Confirmed recuperation phase and right at the 200-WMA resistance 281.
Regional banks (KRE) Still the most concerning sector with 60 pivotal and under 57 lights out. Needs to clear 65 to stay in the game.
Semiconductors (SMH) Another nail-biter stopping right at the 50-WMA or 226.
Transportation (IYT) Also stopped at the 50-WMA or 231.50
Biotechnology (IBB) 138.74 December high the place to clear with 130 key support.
Retail (XRT) Amazing how the Jan 6-month range and these 50-WMAs line up in the Economic Modern Family. 66.70 to clear and hold if good.
Twitter: @marketminute
The author may have a position in mentioned securities at the time of publication. Any opinions expressed herein are solely those of the author and do not represent the views or opinions of any other person or entity.
The post Stock Market Outlook: New Year, New Calendar Range appeared first on See It Market.


Canadian Silver Co. Will See Big Changes in 2024
Source: Michael Ballanger 12/22/2023
Michael Ballanger of GGM Advisory Inc. takes a look at the current state of the market and shares on stock…
EGR options out Urban Berry project in Quebec to Harvest Gold – Richard Mills
2023.12.23
EGR Exploration Ltd. (TSXV: EGR) has moved from owner to shareholder at its Urban Berry project in Quebec, this week announcing it is optioning…
Crypto, Crude, & Crap Stocks Rally As Yield Curve Steepens, Rate-Cut Hopes Soar
Crypto, Crude, & Crap Stocks Rally As Yield Curve Steepens, Rate-Cut Hopes Soar
A weird week of macro data – strong jobless claims but…
