Precious Metals
Stock Market Outlook: Gold Drops & Semiconductors Pop
Today I’ve got a handful of bullish stock charts for your watchlist next week. The importance of these stock charts begins with the table shown above….
Today I’ve got a handful of bullish stock charts for your watchlist next week.
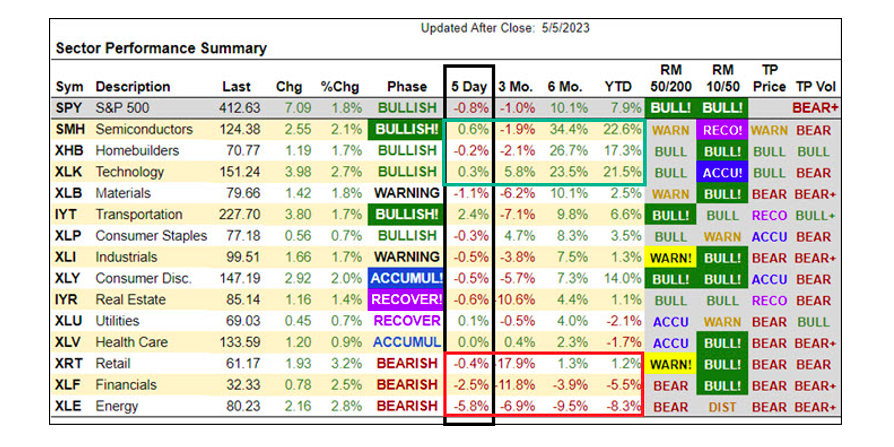
The importance of these stock charts begins with the table shown above. You can find this Sector Summary table updated daily at www.marketgauge.com/sectors.
If you were watching the market last week, it probably didn’t feel cal or uneventful. However, as you can see from the “5 day” column highlighted in the Sector Summary table above, the end result was relatively unchanged in most sectors.
One notable pattern, also highlighted, is that the top 3 sectors based on 6-month percent change were also the better performers for the week and on Friday.

Likewise, the worst performing sectors for the week are also the worst performers over the last 6 months and year-to-date.
This pattern of the relatively strongest groups or stocks continuing to outperform while the laggards continue to lag is a well known tendency of the market that we exploit in several of our trading systems.
In recent Mish’s Daily articles I’ve suggested that gold was poised to move higher, and the semiconductor sector ETF (SMH) was weak and likely to break below its 50-day moving average and decline.
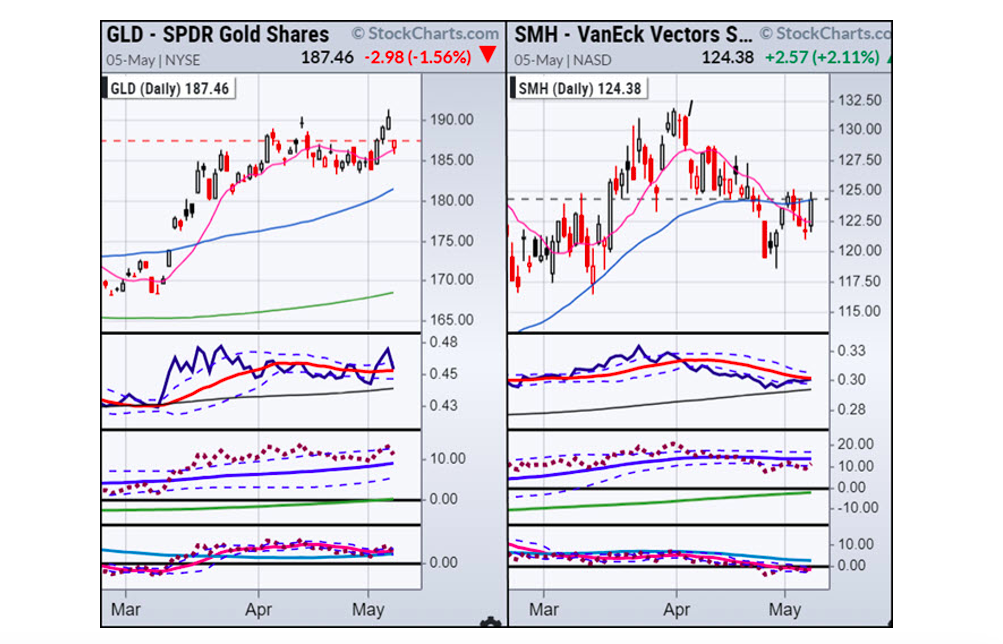
Leading up to the employment report on Friday gold was rallying and SMH was rolling over.
However, the report suggested that the economy was stronger than expected, which pushed the stock indexes and the semiconductor sector (SMH) higher. If it trades back over $125 its pattern will turn bullish.
At the same time, gold gapped down on Friday, and then it rallied though out the day.
Is the gap down in gold a dip to buy or a significant top? Will SMH break higher?
In both cases, a move over Friday’s high would be a good reason to look at long trades in the ETFs or in leading stocks in their respective groups.
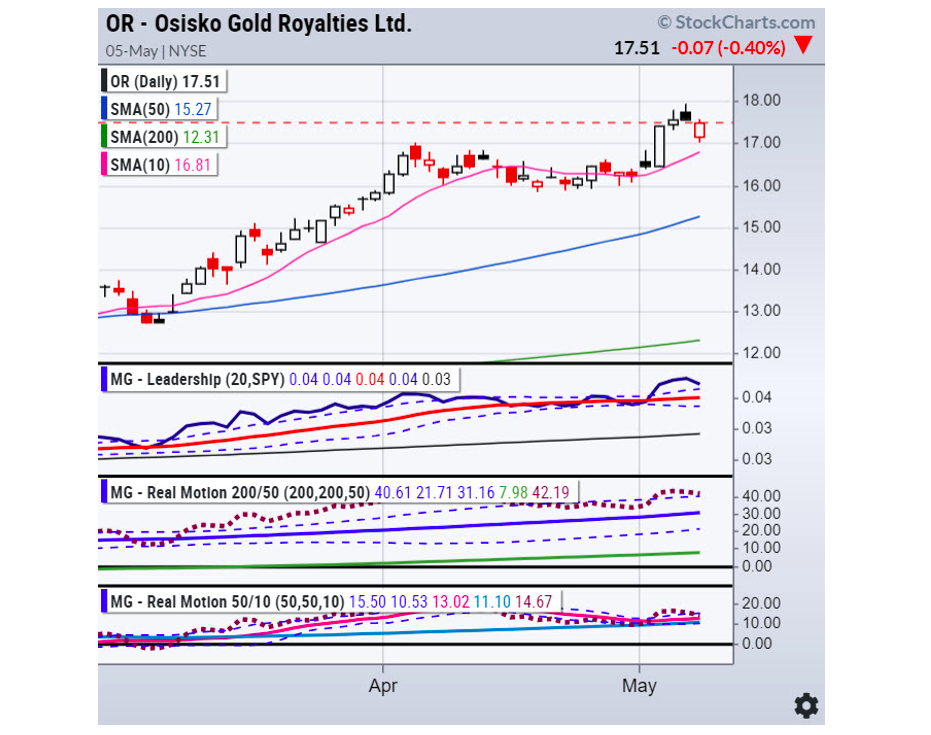
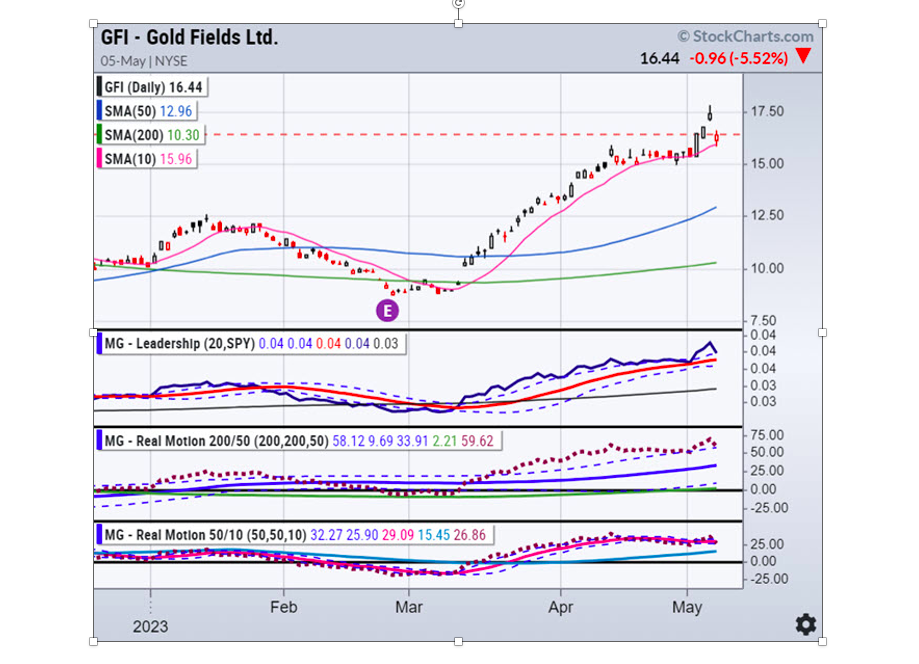
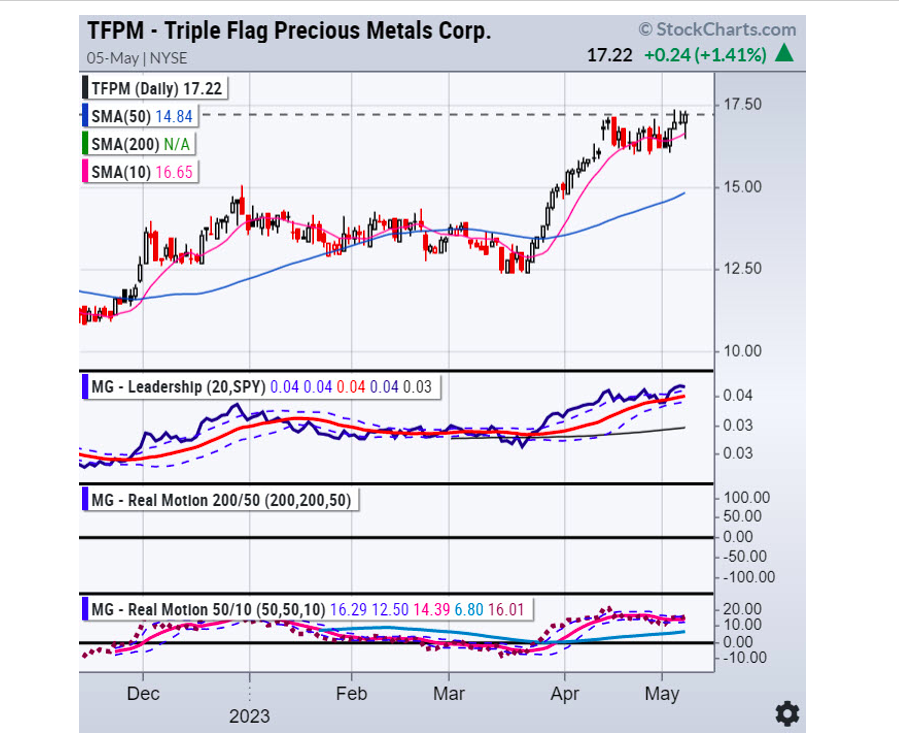
Here are a few gold stocks that have bullish patterns.
These stocks are in bullish patterns as long as they stay over their 10-day moving average (red line).
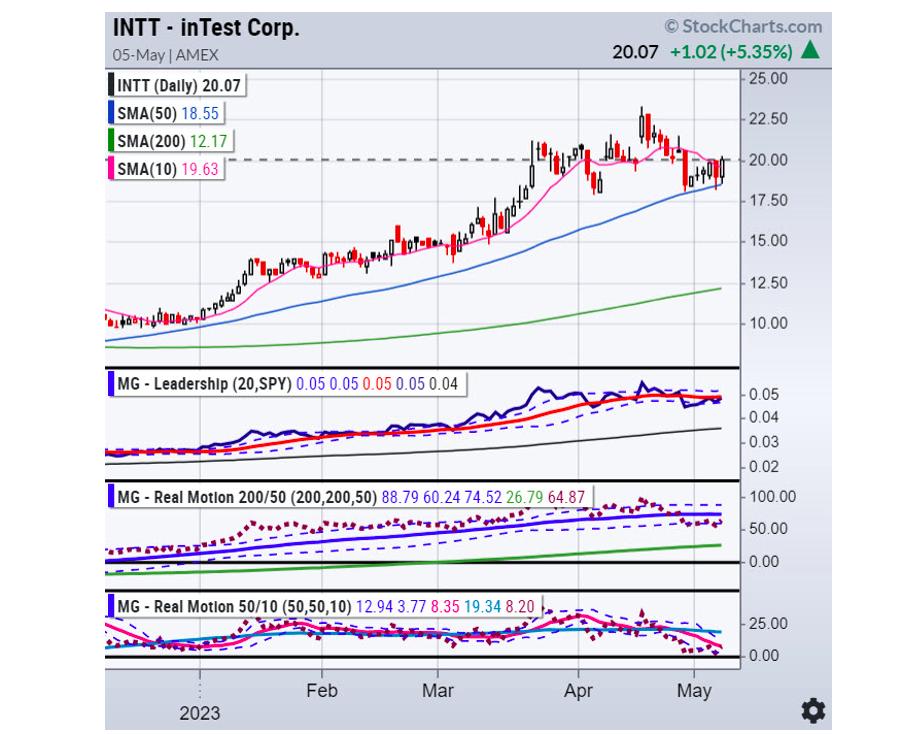
Here are some bullish semiconductor stocks
Warning: The semiconductor group is risky. It still needs to trade higher to confirm the resumption of its bullish trend. If any of these stocks or the SMH trade below last week’s low, it would be very bearish.
However, if QQQ breaks out and SMH breaks over $125, these stocks could be market leaders.
Stock Market ETFs Trading Analysis & Summary:
S&P 500 (SPY) 23-month MA 420
Russell 2000 (IWM) 170 support – 180 resistance
Dow (DIA) Over the 23-month MA-only index
Nasdaq (QQQ) 329 the 23-month MA
Regional banks (KRE) 43 now pivotal resistance
Semiconductors (SMH) 246 the 23-month MA
Transportation (IYT) 202-240 biggest range to watch
Biotechnology (IBB) 121-135 range to watch from monthly charts
Retail (XRT) 56-75 trading range to break one way or another
Twitter: @marketminute
The author may have a position in mentioned securities at the time of publication. Any opinions expressed herein are solely those of the author and do not represent the views or opinions of any other person or entity.
The post Stock Market Outlook: Gold Drops & Semiconductors Pop appeared first on See It Market.


Canadian Silver Co. Will See Big Changes in 2024
Source: Michael Ballanger 12/22/2023
Michael Ballanger of GGM Advisory Inc. takes a look at the current state of the market and shares on stock…
EGR options out Urban Berry project in Quebec to Harvest Gold – Richard Mills
2023.12.23
EGR Exploration Ltd. (TSXV: EGR) has moved from owner to shareholder at its Urban Berry project in Quebec, this week announcing it is optioning…
Crypto, Crude, & Crap Stocks Rally As Yield Curve Steepens, Rate-Cut Hopes Soar
Crypto, Crude, & Crap Stocks Rally As Yield Curve Steepens, Rate-Cut Hopes Soar
A weird week of macro data – strong jobless claims but…


