Precious Metals
Stock Market Analysts are Bearish While Risk On Explodes!
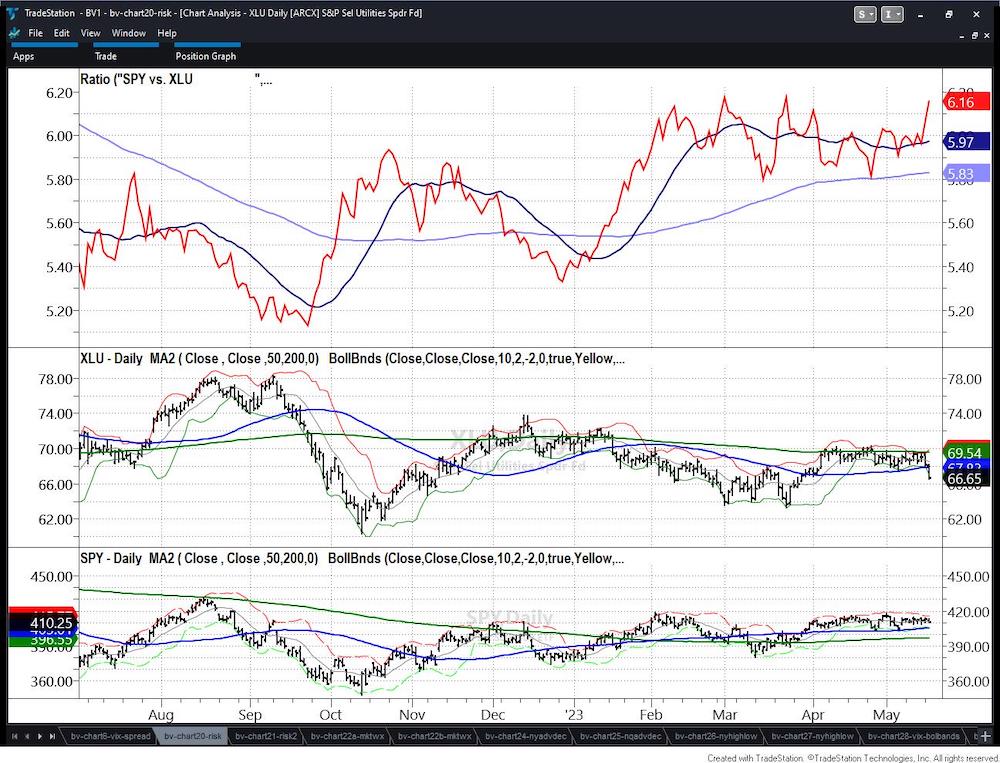
The four ratio indicators track key intermarket relationships which identify risk on/off market conditions. These four indicators can be used together…

The four ratio indicators track key intermarket relationships which identify risk on/off market conditions.
These four indicators can be used together to confirm or identify the strength of the core risk on/off indicator which is the S&P 500 v. Utilities.
These charts come from our Big View product, which is superior in assessing market internals, sentiment, sector and world views, picks and pans plus the health of the Economic Modern Family.
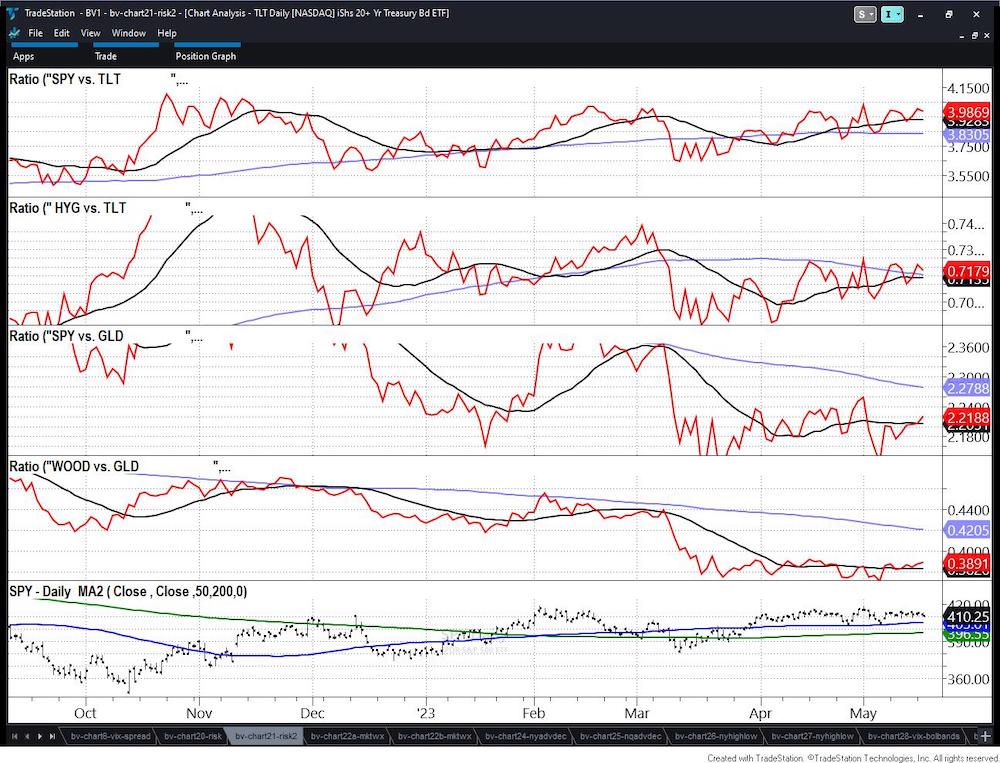
As clearly illustrated, all the ratios are flashing 100% risk on.
Is it time to put your cash to work?
The bottom of the recent trading range appears to be holding at this point.
And, what led to more confidence in our recent picks (USO, LIT, GME, 3 most recent examples) was the ratio between SPY and Long Bonds (TLT).
I have been vocal on media about junk bonds (HYG) versus long bonds (TLT). When high yield outperforms long bonds, it is hard to make a case for recession.
Furthermore, we have mentioned that gold appeared to be in for a rest.
As you can see, SPY and WOOD are both outperforming gold-a good thing for the stock market.
These ratios gave us a comfort level as bulls want SPY in the lead.
However, let us not lose sight of the ratios for first, they could flip.
Secondly, the trading range is still very much so a trading range.
Finally, the small caps (IWM) may have gotten a pass for now, but still need to prove a lot more.
In fact, we continue to believe that the economy may not contract further, which is still quite different than predicting the economy can grow.
Stagflation is still a thing.
Stock Market ETFs Trading Analysis & Summary:
S&P 500 (SPY) 23-month MA 420 Support 410
Russell 2000 (IWM) 170 support – 180 resistance
Dow (DIA) 336 the 23-month MA
Nasdaq (QQQ) 328 cleared or the 23-mont MA-now its all about staying above
Regional banks (KRE) 42 now pivotal resistance-37 support
Semiconductors (SMH) 23-month MA at 124 now more in the rear view mirror
Transportation (IYT) 202-240 biggest range to watch
Biotechnology (IBB) 121-135 range to watch from monthly charts
Retail (XRT) 59.74 held so now we watch the 50-DMA at 62.00
Twitter: @marketminute
The author may have a position in mentioned securities at the time of publication. Any opinions expressed herein are solely those of the author and do not represent the views or opinions of any other person or entity.
The post Stock Market Analysts are Bearish While Risk On Explodes! appeared first on See It Market.


Canadian Silver Co. Will See Big Changes in 2024
Source: Michael Ballanger 12/22/2023
Michael Ballanger of GGM Advisory Inc. takes a look at the current state of the market and shares on stock…
EGR options out Urban Berry project in Quebec to Harvest Gold – Richard Mills
2023.12.23
EGR Exploration Ltd. (TSXV: EGR) has moved from owner to shareholder at its Urban Berry project in Quebec, this week announcing it is optioning…
Crypto, Crude, & Crap Stocks Rally As Yield Curve Steepens, Rate-Cut Hopes Soar
Crypto, Crude, & Crap Stocks Rally As Yield Curve Steepens, Rate-Cut Hopes Soar
A weird week of macro data – strong jobless claims but…


