Precious Metals
Silver Price Analysis: Forecast as the Gold/Silver Ratio Soars
Silver price has come under elevated pressure after the relatively weak China industrial growth data. After soaring to a high of $26.12 on May 5, the XAG/USD…


Silver price has come under elevated pressure after the relatively weak China industrial growth data. After soaring to a high of $26.12 on May 5, the XAG/USD pair has plunged to $24, the lowest point since April 4th of this year. On the other hand, the gold/silver ratio has jumped to $84, the highest level since March 30th.
Gold silver ratio jumps
The biggest silver news on Tuesday was the relatively weak performance of China’s industrial production sector. According to the statistics agency, China’s industrial production jumped by 5.6% on a year-on-year basis in April. Analysts were expecting the figure to come in at 10.9%.
While the 5.6% is not necessarily a bad growth rate, it was a big disappointment since the country’s was in a lockdown in the same month in 2022. The production jumped by just 3.6% on a month-on-month basis.
Silver is usually affected by the economic performance of key countries because of its role as an industrial metal. It is used to manufacture products like kitchenware, mirrors, and solar panels among others.
Silver has also declined because of the performance of the US dollar index (DXY). The dollar index jumped to a high of $102.25 last week as it staged a major comeback. It remains close to the year-to-date low of $100.
Silver has an inverse relationship with the US dollar because it is usually affected by monetary policy of the Federal Reserve. The same applies to gold, which is usually seen as an alternative to the US dollar.
Meanwhile, the gold/silver ratio has jumped to the highest point since March 30. This happened even as gold price retreated from an all-time high of $2,081 to the current $2,016.
Silver price forecast
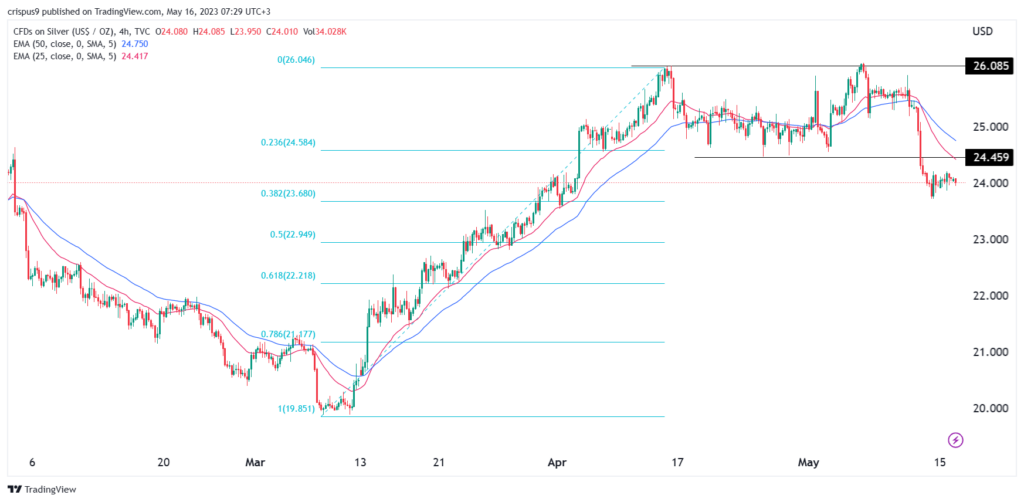
Silver has made a bearish breakout in the past few days. It has managed to move below the key support level at $24.45, the lowest point on April 25. This price was also the neckline of the double-top pattern at $26.08 that formed on April 14 and May 5. It also moved below the 23.6% Fibonacci retracement level.
Silver price has also moved below the 25-day and 50-day exponential moving averages (EMA). It has also formed a bearish pennant pattern. Therefore, there is a likelihood that silver will have a bearish breakout as sellers target the next key support at $23. A move above the key resistance point at $24.45 will invalidate the bearish view.
The post Silver price analysis: forecast as the gold/silver ratio soars appeared first on Invezz.
dollar
gold
silver
monetary
reserve
policy
us dollar
monetary policy


Canadian Silver Co. Will See Big Changes in 2024
Source: Michael Ballanger 12/22/2023
Michael Ballanger of GGM Advisory Inc. takes a look at the current state of the market and shares on stock…
EGR options out Urban Berry project in Quebec to Harvest Gold – Richard Mills
2023.12.23
EGR Exploration Ltd. (TSXV: EGR) has moved from owner to shareholder at its Urban Berry project in Quebec, this week announcing it is optioning…
Crypto, Crude, & Crap Stocks Rally As Yield Curve Steepens, Rate-Cut Hopes Soar
Crypto, Crude, & Crap Stocks Rally As Yield Curve Steepens, Rate-Cut Hopes Soar
A weird week of macro data – strong jobless claims but…


