Precious Metals
Precious Metals and Mining Stocks Ready to Rally
Is it time to get in or buy more if already in?
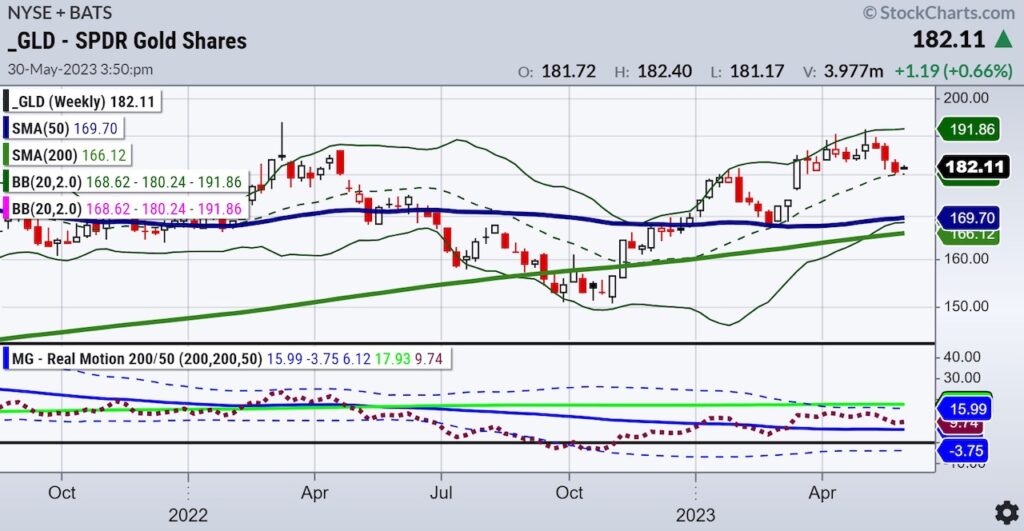
In gold futures, we were looking for a correction to around $1940 an ounce.
The June contract fell to $1932.
Now, it closed on the exchange at $1958.
Plus, it had a new 60-day low and potential reversal pattern.
The GLD ETF has begun this week trading inside the range of Friday and with a very narrow trading range at that. That means a pause and uncertainty.
Our Real Motion Indicator shows support at its blueline or 50-DMA.
Is it time to get in or buy more if already in?
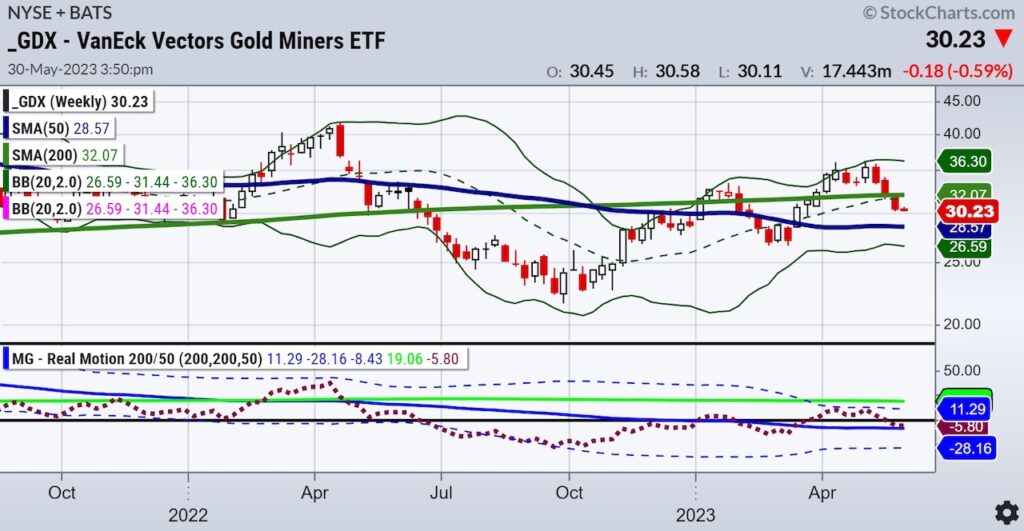
The gold miners ETF GDX is a holding in 2 of our quant models-Sector Rotation and GEMS.
Sector Rotation entered in March. This model uses our trend strength indicator to measure performance and gives it a ranking.
Currently the conservative model has the ETF ranked number 5.
The GEMS model uses a component of sector rotation. Similarly, GDX is ranked number 5.
On the daily chart, our Real Motion indicator sits right on its 50-DMA.
Furthermore, the price of GDX is above the 50-DMA.
Momentum needs to catch up and price, ultimately, needs to return over the 200-DMA (green line).
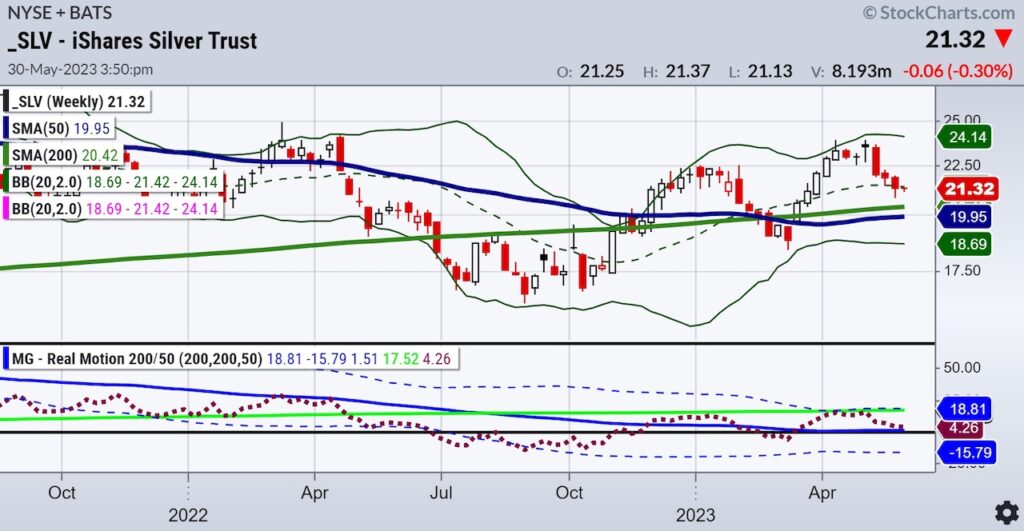
Silver SLV ETF is in our GEMS model as part of the global Macro algo.
That too had an inside and narrow range trading day. SLV’s momentum sits on support while the price is above it.
Based on our quant models (pure math) and our discretionary read of these charts (math and art), it appears the correction in all 3 (GLD, GDX, SLV) could be done.
That means the risk is super tight as these recent support levels should hold.
It also means that should they get follow through to the upside, it is possible to see a much bigger rally than the one in early April.
Stock Market ETFs Trading Analysis & Summary:
S&P 500 (SPY) 23-month MA 420-the dance
Russell 2000 (IWM) 170 support – 180 resistance
Dow (DIA) 327-333 trading range for the week to hold or break
Nasdaq (QQQ) Opened on the highs, closed on the intraday low-needs to hold 348.50 to prevent a reversal top.
Regional banks (KRE) Did the initial damage now sidelining
Semiconductors (SMH) No doubt-she is showing expansion
Transportation (IYT) Like to see this hold 220 this week
Biotechnology (IBB) 121-135 range
Retail (XRT) 56.00 the 80-month MA while momentum is at least flatlining
Twitter: @marketminute
The author may have a position in mentioned securities at the time of publication. Any opinions expressed herein are solely those of the author and do not represent the views or opinions of any other person or entity.
The post Precious Metals and Mining Stocks Ready to Rally appeared first on See It Market.


Canadian Silver Co. Will See Big Changes in 2024
Source: Michael Ballanger 12/22/2023
Michael Ballanger of GGM Advisory Inc. takes a look at the current state of the market and shares on stock…
EGR options out Urban Berry project in Quebec to Harvest Gold – Richard Mills
2023.12.23
EGR Exploration Ltd. (TSXV: EGR) has moved from owner to shareholder at its Urban Berry project in Quebec, this week announcing it is optioning…
Crypto, Crude, & Crap Stocks Rally As Yield Curve Steepens, Rate-Cut Hopes Soar
Crypto, Crude, & Crap Stocks Rally As Yield Curve Steepens, Rate-Cut Hopes Soar
A weird week of macro data – strong jobless claims but…


