Precious Metals
Investment Seesaw Update
Many times over the years its been argued that gold and the world’s most important equity index (the S&P500 Index — SPX) are at opposite ends…

Many times over the years we’ve argued that gold and the world’s most important equity index (the S&P500 Index — SPX) are at opposite ends of a virtual investment seesaw. If one is in a long-term bull market then the other must be in a long-term bear market, with the gold/SPX ratio determining where the real bull market lies. As discussed in a TSI commentary and blog post about five months ago, our ‘investment seesaw’ concept was part of the inspiration for a model, called the Synchronous Equity and Gold Price Model (SEGPM)*, that defines a quantitative relationship between the SPX, the US$ gold price and the US money supply. What is the SEGPM’s current message?
Before we answer the above question, a brief recap is in order.
In general terms and as explained in the above-linked blog post, the SEGPM is based on the concept that there are periods when an increase in the money supply will boost the SPX more than it will boost the gold price and other periods when an increase in the money supply will boost the gold price more than it will boost the SPX, with the general level of trust/confidence in money, the financial system and government determining whether the SPX or gold is the primary beneficiary of monetary inflation. During long periods when trust/confidence is high or trending upward, increases in the money supply will tend to do a lot for the SPX and very little for gold. The opposite is the case during long periods when trust/confidence is low or falling.
More specifically, the SEGPM is based on the concept that adding the SPX to 1.5-times the US$ gold price (and applying a scaling factor) results in a number that tracks the US money supply over the long-term.
The following monthly chart replicates the model using our calculation of US True Money Supply (TMS). The money supply is shown in red and the SEGPM (the sum of the S&P500 Index and 1.5-times the US$ gold price) is shown in blue.
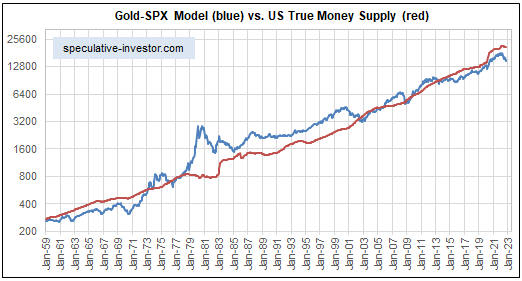
Currently the SEGPM is as far below the money supply as it has been since 1970-1971, when the gold price was fixed at US$35/ounce. This suggests scope for a catch-up move by the gold-SPX combination over the next two years. Furthermore, if we are right to think that the US and the world are about 6 months into a 1-3 year economic bust, then the catch-up will have to happen via a rise in the US$ gold price.
*The model was created by Dietmar Knoll.


Canadian Silver Co. Will See Big Changes in 2024
Source: Michael Ballanger 12/22/2023
Michael Ballanger of GGM Advisory Inc. takes a look at the current state of the market and shares on stock…
EGR options out Urban Berry project in Quebec to Harvest Gold – Richard Mills
2023.12.23
EGR Exploration Ltd. (TSXV: EGR) has moved from owner to shareholder at its Urban Berry project in Quebec, this week announcing it is optioning…
Crypto, Crude, & Crap Stocks Rally As Yield Curve Steepens, Rate-Cut Hopes Soar
Crypto, Crude, & Crap Stocks Rally As Yield Curve Steepens, Rate-Cut Hopes Soar
A weird week of macro data – strong jobless claims but…


