Precious Metals
Investing Performance: Comparing Gold vs S&P 500
This coming week is a big one. We have FOMC on tap with some Fed members calling for .50 bps rate hike on the heels of the hot Producer Price Index and…

This coming week is a big one.
We have FOMC on tap with some Fed members calling for .50 bps rate hike on the heels of the hot Producer Price Index and inflation.
We have Gross Domestic Product on the heels of a strong retail sales number while also record amount of credit card debt could hurt later on.
We have 600 companies reporting earnings-the largest week of earnings for the last quarter.
We have 2 of the 4 key indices posting 2 inside trading weeks, meaning a range within a range within a range. In other words, the market has taken a giant pause near the recent highs.
We have written about the the 23-month moving average and the correlation to the 2-year business cycle.
The S&P 500 ETF (SPY), and most key sectors, have stopped dead in their tracks right at that moving average.
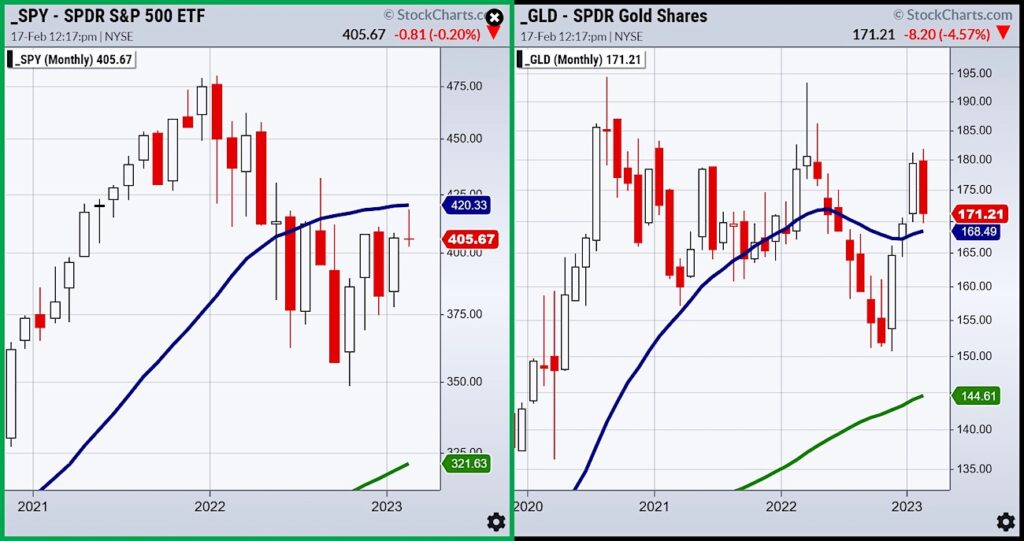
Why is this significant?
Because, until proven otherwise, it not only supports the trading range theory for 2023, it also shows that the rally since October is still looking like a bear market rally.
Should a soft landing turn out as a possibility, then we would want to see the price of the indices and key sectors move beyond that 2-year cycle.
Meanwhile, as so many are dismissing gold citing a stronger dollar and stronger rates will not help the shiny metal, the chart looks very different stepping back to the same 2-year cycle.
Although gold sold off for most of last week, it closed green on Friday.
Gold held the key weekly and monthly moving averages. Gold, silver, soft and food commodities all closed in the green. Inflation is far from dead. Again, all rallied in the face of higher yields and firmer U.S. dollar.
Now, it could be that we saw the dip in gold futures to around $1820 an ounce, then the bounce back to $1850, a key pivotal point and that’s that.
It could also mean that the market remains highly optimistic that higher yields, even ½% higher will not hurt the economy or the market too much.
It could mean that countries and hedge funds that have been accumulating gold bought this dip, while retail investors have turned their focus more to AI, defense stocks and consumer staples.
Too soon to say.
Nonethless, if just looking at the chart, what we can see is that gold is following through above it 23-month MA or 2-year business cycle while the market remains agnostic at best.
Stock Market ETFs Trading Analysis & Summary:
S&P 500 (SPY) 420 resistance with 390-400 support
Russell 2000 (IWM) 190 pivotal support and 202 major resistance
Dow Jones Industrial Average (DIA) 343.50 resistance 338 support
Nasdaq (QQQ) Still 2 inside weeks working so watch 311 as a good point to clear or fail from
Regional banks (KRE) 65.00 resistance 61 support
Semiconductors (SMH) 248 now has to clear again with 238 support
Transportation (IYT) The 23-month MA is 244-now resistance 228 support
Biotechnology (IBB) Sideways action 130-139 range
Retail (XRT) 78.00 the 23-month MA resistance and nearest support 68.00
Twitter: @marketminute
The author may have a position in mentioned securities at the time of publication. Any opinions expressed herein are solely those of the author and do not represent the views or opinions of any other person or entity.
The post Investing Performance: Comparing Gold vs S&P 500 appeared first on See It Market.


Canadian Silver Co. Will See Big Changes in 2024
Source: Michael Ballanger 12/22/2023
Michael Ballanger of GGM Advisory Inc. takes a look at the current state of the market and shares on stock…
EGR options out Urban Berry project in Quebec to Harvest Gold – Richard Mills
2023.12.23
EGR Exploration Ltd. (TSXV: EGR) has moved from owner to shareholder at its Urban Berry project in Quebec, this week announcing it is optioning…
Crypto, Crude, & Crap Stocks Rally As Yield Curve Steepens, Rate-Cut Hopes Soar
Crypto, Crude, & Crap Stocks Rally As Yield Curve Steepens, Rate-Cut Hopes Soar
A weird week of macro data – strong jobless claims but…


