Precious Metals
Collapsed Complexity Predicts Heart Attacks And Market Reversals
Collapsed Complexity Predicts Heart Attacks And Market Reversals
By Dhaval Joshi of BCA Research
Executive Summary
The world we inhabit,…
Collapsed Complexity Predicts Heart Attacks And Market Reversals
By Dhaval Joshi of BCA Research
Executive Summary
-
The world we inhabit, physiologic systems, and even the healthy functioning of markets are all founded on complexity.
-
The complexity arises from the number of crucial interacting drivers that are driving the system.
-
When this complexity collapses, it is warning that some of the crucial drivers are not working sympathetically.
-
Therefore, the collapsed complexity of a heartbeat is a warning of cardiac risk.
-
In the financial markets, the collapsed complexity of price action is an excellent predictor of market turning-points – rebounds after depression, and reversals after euphoria.
-
Right now, some rebound candidates are USD/CZK, TSN and CVS.
-
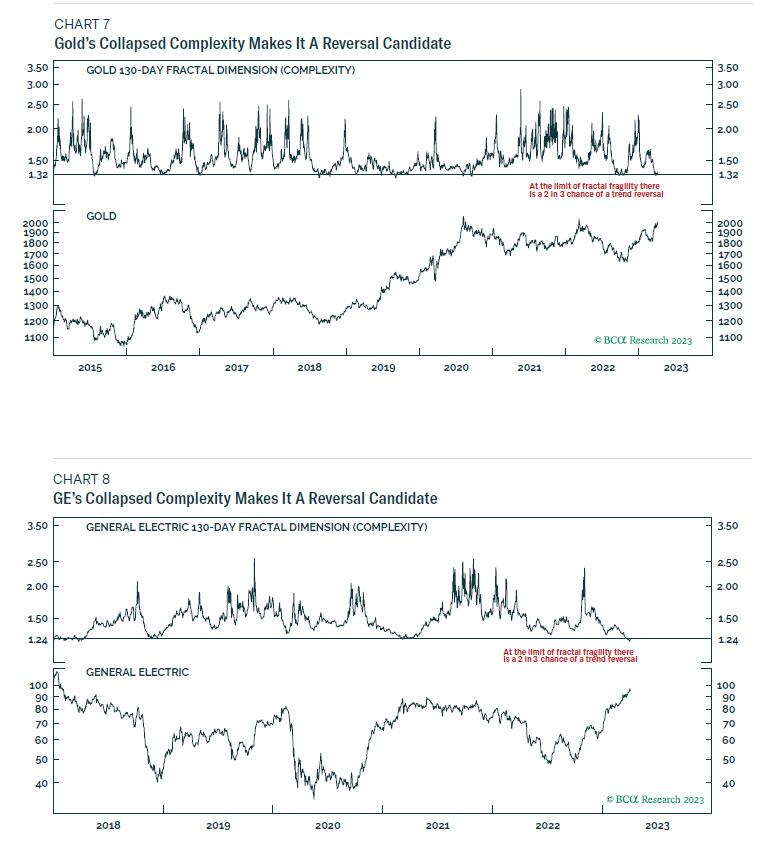
And some reversal candidates are Gold and GE.
The world we inhabit, physiologic systems, and even the healthy functioning of markets are all founded on complexity. So, when this complexity collapses, it is a warning of impending tail-events, heart attacks, and reversals in the markets. But what is complexity, and how do we know when it has collapsed?
Measuring Complexity, And Its Collapse
Intuitively, the complexity of any structure can be measured by the length of its shortest description. This intuition was codified as long ago as the 14th century in the principle of Occam’s Razor, which states that the simplest explanation is the shortest one. Hence, if the shortest description is long, it indicates complexity. But if it is short, it indicates a lack of complexity. Consider the following three patterns of daily returns:
-4, 1, -2, 0, 5, 4, 1, 5, -2, -3, 1, 4, -1, 1, 5, 1
1, 1, 1, 1, 1, 1, 1, 1, 1, 1, 1, 1, 1, 1, 3, -1
1, 1, 1, 1, 1, 1, 1, 1, 1, 1, 1, 1, 1, 1, 1, 1
The first pattern we cannot describe in any shorter way than writing out the string in full. The shortest description is long, signifying complexity.
The second pattern we can describe as ‘14 1s, then 3, then -1.’ A much shorter description, signifying low complexity.
The third pattern we can describe as just ‘16 1s’. The shortest possible description, signifying no complexity.
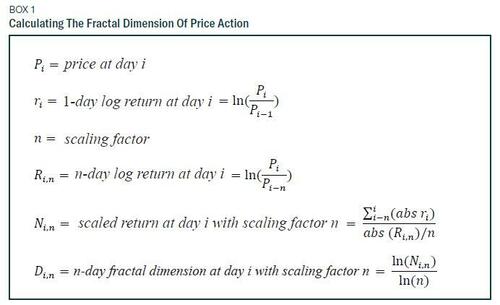
Can we go one step further and formalize this complexity more precisely? The answer is yes. The so-called ‘fractal structure’ or ‘fractal dimension’ of a structure or pattern is the mathematical measure of its complexity, with 1 indicating no complexity and a number higher than 1 indicating increasing complexity (Box 1).
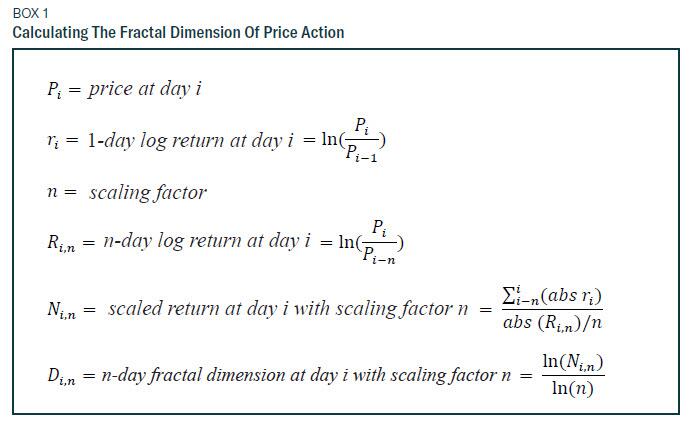
The first pattern has a fractal dimension of 1.34, confirming its complexity. The second pattern has a fractal dimension of 1.04, confirming its low complexity. And the third pattern has the lowest possible fractal dimension of 1, confirming it has no complexity.
What do these dimensions 1.34, 1.04, and 1 represent? The answer is they measure how much extra information you see by looking at the whole pattern through a magnifying glass. In the first pattern, zooming in on the differing daily returns provides 1.34 times more information. Thereby, it exhibits some complexity. By contrast, in the third pattern, zooming in on the 16 consecutive ‘1s’ provides no extra information. It exhibits no complexity (A fractal dimension is a scaling rule comparing how a pattern’s detail changes with the scale at which it is considered. This is what we mean by complexity).
Collapsed Complexity Predicts Heart Attacks
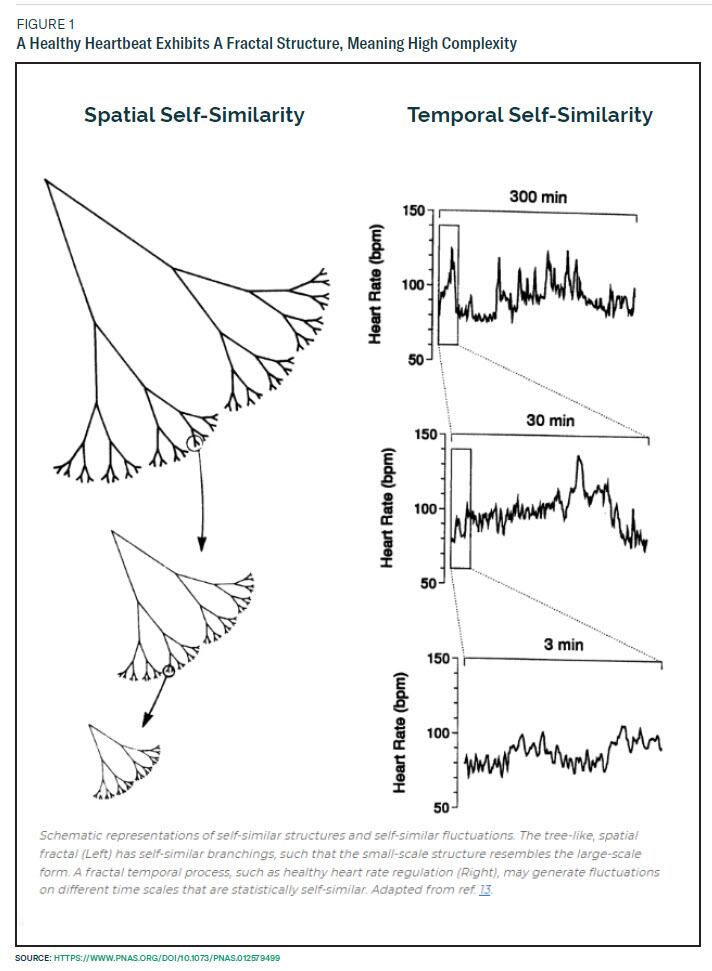
If all this sounds like abstract mathematics, think again. It is a matter of life or death. A collapsed complexity of your heartbeat is a warning sign of an impending heart attack. Medical researchers point out “the output of healthy physiologic systems reveals complexity, as measured by a high fractal dimension. This complexity appears to degrade with ageing and disease. Further, this collapse in complexity may be quantified, with applications for diagnosis and prognosis.”
What is the source of this complexity? The answer is that it arises from the number of distinguishable interacting drivers that are driving a system. A healthy heartbeat exhibits high complexity – a high fractal dimension – because the heartbeat is the output of many interacting parts of the heart working sympathetically. The result is complexity (Figure 1).
Unfortunately, when this complexity collapses, it is warning that some of the crucial drivers are not working sympathetically, and therefore presages cardiac risk (Figure 2).
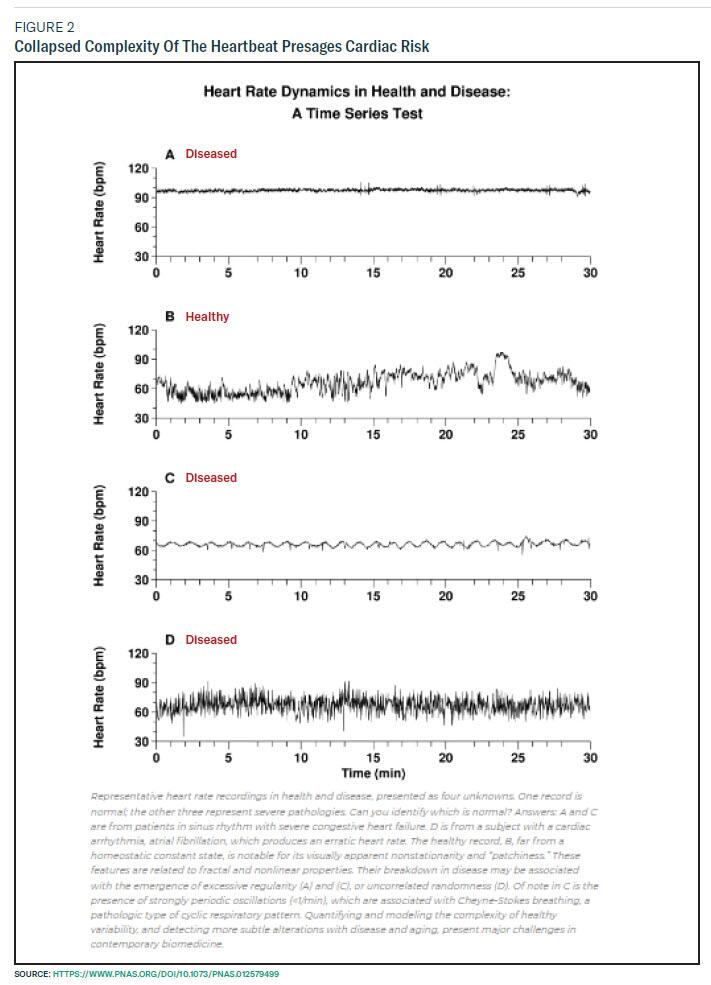
For subjects at high risk of sudden death, fractal organization breaks down. Application of fractal analysis may provide new approaches to assessing cardiac risk and forecasting sudden cardiac death, as well as to monitoring the ageing process.
So, the best piece of advice you get from me may not be investment advice. It may be medical advice. Get a fractal analysis of your heartbeat.
Collapsed Complexity Predicts Market Reversals
Just as the output of healthy physiologic systems reveals complexity, so does the output of healthy financial markets. And just as physiologic complexity arises from the sympathetic output of interacting parts, so does financial market complexity. But what are the interacting parts in the financial markets?
The interacting parts in the financial market are the different investment time-horizons.
A healthy market exhibits high complexity – a high fractal dimension – because the price action is the output of more than one investment time-horizon working sympathetically. This creates the price action’s complexity. Hence, when complexity and the fractal dimension collapse, it is a red flag that the time-horizons are no longer working sympathetically, and therefore presages a potential price rebound or reversal.
Essentially, a fractal dimension of a price action quantifies the relative contribution of the longer-term investor versus the shorter-term investor in driving that price action. For example, the 130-day fractal dimension compares the contribution of the 130-day investment horizon relative to the 1-day investment horizon in driving the 130-day price action. The lower the fractal dimension and complexity, the lower the contribution from the longer-term investor.
It follows that when the fractal dimension has collapsed to its lower bound, the longer-term investor is no longer driving the price action. It has become a pure short-term momentum market, characterised by a complete loss of complexity.
So just as fractal organization breaks down for the heart ahead of a sudden cardiac event, fractal organization also breaks down for investments ahead of a sudden reversal.
This is because if the short-term momentum is upwards and a shorter-term investor wishes to get off the trend, there are no more shorter-term investors left to sell to. The buyer must be a longer-term investor, who will buy only at a value-based lower price, catalyzing a price reversal.
Of course, there is the alternative possibility that the longer-term investor joins the mania (or depression), continuing the momentum market. But this is both theoretically and empirically a lower likelihood outcome.
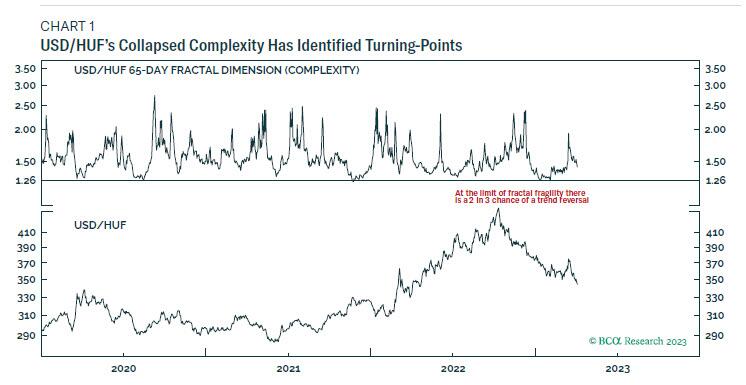
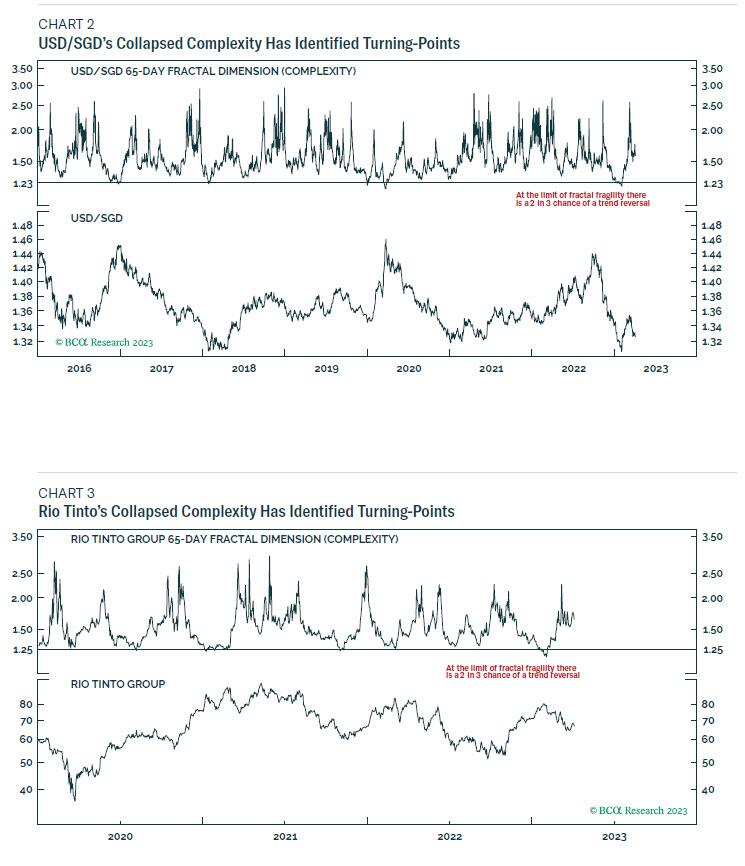
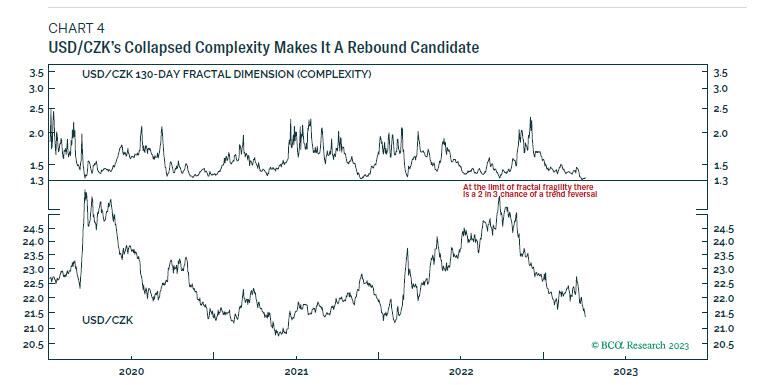
Therefore, the collapsed complexity of price action is an excellent predictor of market turning-points – rebounds after depression, and reversals after euphoria.
Using this approach, recent successes include pinpointing the sharp rebounds in USD/HUF (Chart 1) and USD/SGD (Chart 2). And pinpointing the sharp reversal in Rio Tinto after the ‘China reopening’ induced euphoria (Chart 3). In fact, the approach has generated a 77 percent success rate over the past six months and a 68 percent success rate over the past year.
A full and evolving list of current investments exhibiting collapsed complexity – and therefore vulnerable to reversal or rebound – is available on our website: BCA Research – Counterpoint.
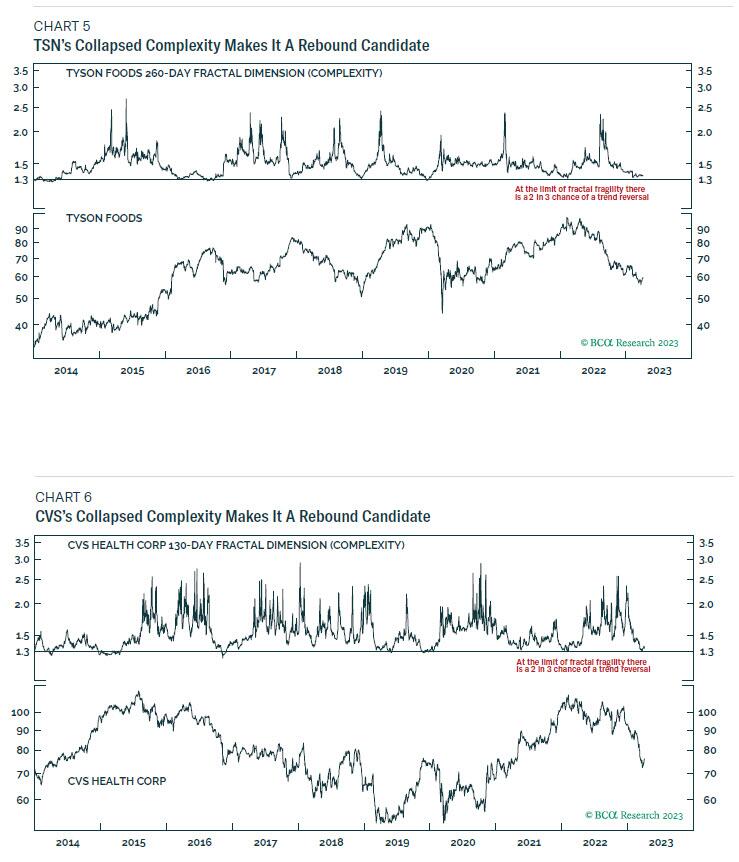
Right now, some rebound candidates are USD/CZK, TSN and CVS (Charts 4-6).
And some reversal candidates are Gold and GE (Charts 7-8).
Out of these, our chosen structured trade is to go long USD/CZK, setting a profit-target and symmetrical stop-loss of 5 percent.
But I will finish by repeating the much more important message. Get a fractal analysis of your heartbeat. It might save your life.
Tyler Durden
Mon, 04/10/2023 – 19:00
gold


Canadian Silver Co. Will See Big Changes in 2024
Source: Michael Ballanger 12/22/2023
Michael Ballanger of GGM Advisory Inc. takes a look at the current state of the market and shares on stock…
EGR options out Urban Berry project in Quebec to Harvest Gold – Richard Mills
2023.12.23
EGR Exploration Ltd. (TSXV: EGR) has moved from owner to shareholder at its Urban Berry project in Quebec, this week announcing it is optioning…
Crypto, Crude, & Crap Stocks Rally As Yield Curve Steepens, Rate-Cut Hopes Soar
Crypto, Crude, & Crap Stocks Rally As Yield Curve Steepens, Rate-Cut Hopes Soar
A weird week of macro data – strong jobless claims but…


