Precious Metals
All of the World’s Money and Markets in One Visualization (2022)
From the wealth held to billionaires to all debt in the global financial system, we look at the vast universe of money and markets in 2022.
The post All…


All of the World’s Money and Markets in One Visualization
The era of easy money is now officially over.
For 15 years, policymakers have tried to stimulate the global economy through money creation, zero interest-rate policies, and more recently, aggressive post-COVID spending.
With capital at near-zero costs over this stretch, investors started to place more value on cash flows in the distant future. Assets inflated and balance sheets expanded, and money inevitably chased more speculative assets like NFTs, crypto, or unproven venture-backed startups.
But the free money party has since ended, after persistent inflation prompted the sudden reversal of many of these policies. And as Warren Buffett says, it’s only when the tide goes out do you get to see “who’s been swimming naked.”
Measuring Money and Markets in 2022
Every time we publish this visualization, our common unit of measurement is a two-dimensional box with a value of $100 billion.
Even though you need many of these to convey the assets on the balance sheet of the U.S. Federal Reserve, or the private wealth held by the world’s billionaires, it’s quite amazing to think what actually fits within this tiny building block of measurement:
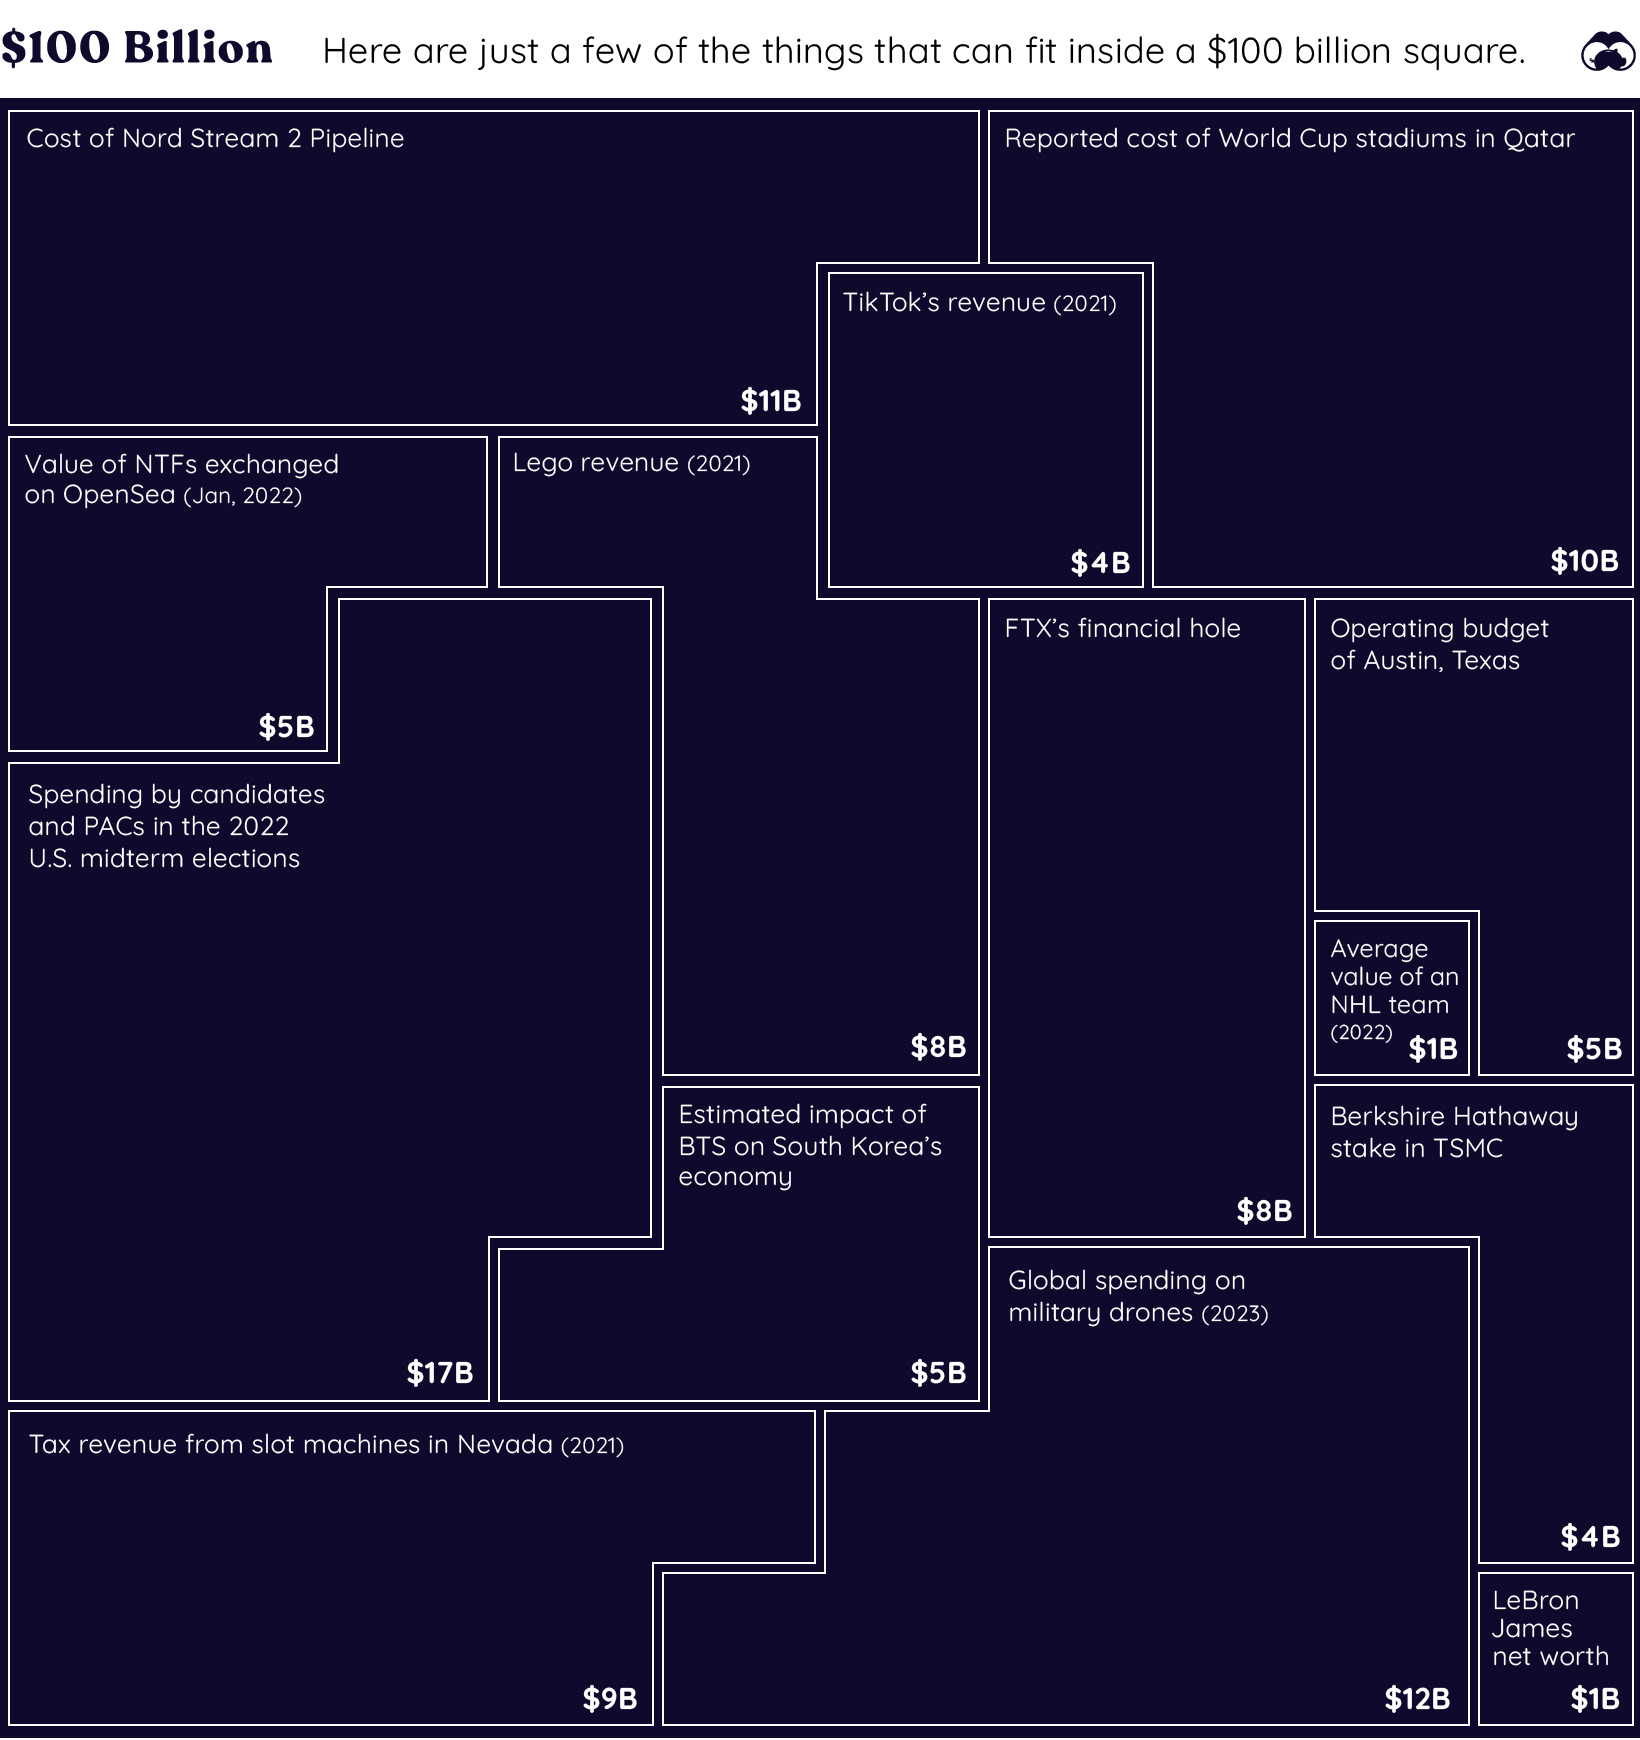
Our little unit of measurement is enough to pay for the construction of the Nord Stream 2 pipeline, while also buying every team in the NHL, and digging FTX out of its financial hole several times over.
Here’s an overview of all the items we have listed in this year’s visualization:
| Asset category | Value | Source | Notes |
|---|---|---|---|
| SBF (Peak Net Worth) | $26 billion | Bloomberg | Now sits at |
| Pro Sports Teams | $340 billion | Forbes | Major pro teams in North America |
| Cryptocurrency | $760 billion | CoinMarketCap | Peaked at $2.8T in 2021 |
| Ukraine GDP | $130 billion | World Bank | Comparable to GDP of Mississippi |
| Russia GDP | $1.8 trillion | World Bank | The world’s 11th largest economy |
| Annual Military Spending | $2.1 trillion | SIPRI | 2021 data |
| Physical currency | $8.0 trillion | BIS | 2020 data |
| Gold | $11.5 trillion | World Gold Council | There are 205,238 tonnes of gold in existence |
| Billionaires | $12.7 trillion | Forbes | Sum of fortunes of all 2,668 billionaires |
| Central Bank Assets | $28.0 trillion | Trading Economics | Fed, BoJ, Bank of China, and Eurozone only |
| S&P 500 | $36.0 trillion | Slickcharts | Nov 20, 2022 |
| China GDP | $17.7 trillion | World Bank | |
| U.S. GDP | $23.0 trillion | World Bank | |
| Narrow Money Supply | $49.0 trillion | Trading Economics | Includes US, China, Euro Area, Japan only |
| Broad Money Supply | $82.7 trillion | Trading Economics | Includes US, China, Euro Area, Japan only |
| Global Equities | $95.9 trillion | WFE | Latest available 2022 data |
| Global Debt | $300.1 trillion | IIF | Q2 2022 |
| Global Real Estate | $326.5 trillion | Savills | 2020 data |
| Global Private Wealth | $463.6 trillion | Credit Suisse | 2022 report |
| Derivatives (Market) | $12.4 trillion | BIS | |
| Derivatives (Notional) | $600 trillion | BIS |
Has the Dust Settled Yet?
Through previous editions of our All the World’s Money and Markets visualization, we’ve created snapshots of the world’s assets and markets at different points in time.
For example, in our 2017 edition of this visualization, Apple’s market capitalization was only $807 billion, and all crypto assets combined for $173 billion. The global debt total was at $215 trillion.
| Asset | 2017 edition | 2022 edition | Change (%) |
|---|---|---|---|
| Apple market cap | $807 billion | $2.3 trillion | +185% |
| Crypto | $173 billion | $760 billion | +339% |
| Fed Balance Sheet | $4.5 trillion | $8.7 trillion | +93% |
| Stock Markets | $73 trillion | $95.9 trillion | +31% |
| Global Debt | $215 trillion | $300 trillion | +40% |
And in just five years, Apple nearly quadrupled in size (it peaked at $3 trillion in January 2022), and crypto also expanded into a multi-trillion dollar market until it was brought back to Earth through the 2022 crash and subsequent FTX implosion.
Meanwhile, global debt continues to accumulate—growing by $85 trillion in the five-year period.
With interest rates expected to continue to rise, companies making cost cuts, and policymakers reining in spending and borrowing, today is another unique snapshot in time. With the easy money era over, where do things go from here?
The post All of the World’s Money and Markets in One Visualization (2022) appeared first on Visual Capitalist.
dollar
gold
inflation
derivatives
markets
reserve
money supply
interest rates
fed
central bank


Canadian Silver Co. Will See Big Changes in 2024
Source: Michael Ballanger 12/22/2023
Michael Ballanger of GGM Advisory Inc. takes a look at the current state of the market and shares on stock…
EGR options out Urban Berry project in Quebec to Harvest Gold – Richard Mills
2023.12.23
EGR Exploration Ltd. (TSXV: EGR) has moved from owner to shareholder at its Urban Berry project in Quebec, this week announcing it is optioning…
Crypto, Crude, & Crap Stocks Rally As Yield Curve Steepens, Rate-Cut Hopes Soar
Crypto, Crude, & Crap Stocks Rally As Yield Curve Steepens, Rate-Cut Hopes Soar
A weird week of macro data – strong jobless claims but…


