Precious Metals
A Fresh Look at Precious Metals
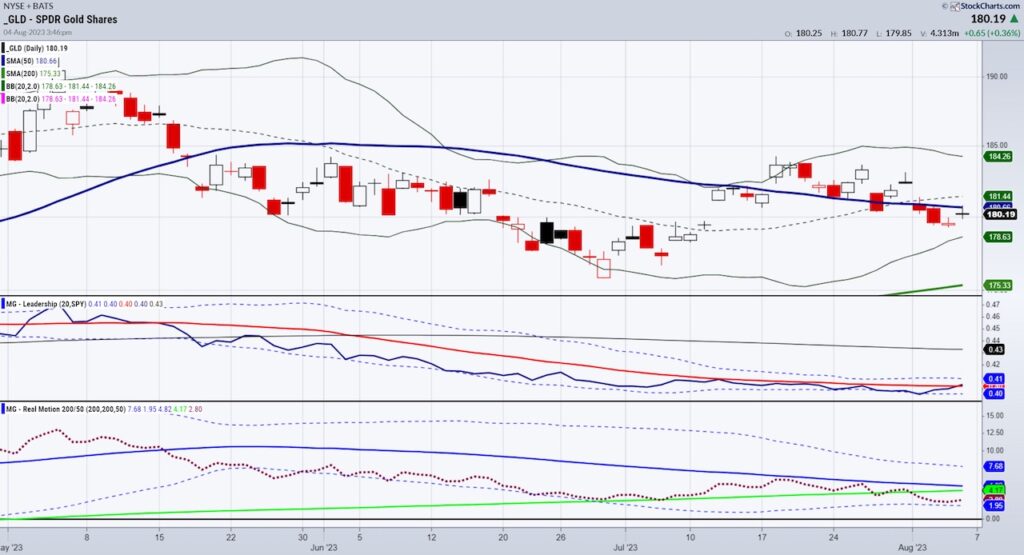
We finished a very heavy week filled with all kinds of economic data: Precious metals are holding their ground. The first chart above shows gold in contango….

We finished a very heavy week filled with all kinds of economic data:
- Fitch Downgrade
- Earnings-Amazon up Apple down
- Jobs Report-Wages rising
- Treasury Yields higher-at October 2022 highs
- Record temperatures around the globe-including winter in S. America
- Oil prices rise 6 weeks in a row
Precious metals are holding their ground.
The first chart above shows gold in contango. That is when the futures price of a commodity is higher than the spot price. Contango occurs when an asset’s price is expected to rise over time.
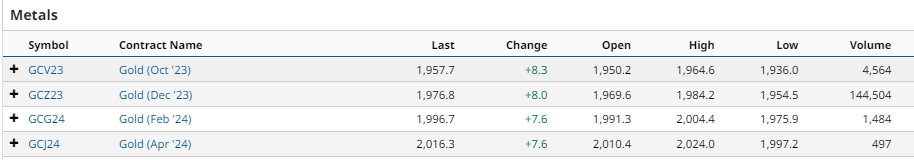
Gold spot futures closed right round $1957 per ounce.
The GLD ETF chart shows it in a caution phase under the 50-day moving average (DMA).
The leadership indicator shows GLD slightly outperforming the S&P 500 ETF (SPY) or benchmark. SPY closed down on the week from $456.92 down to $447 or about 2.2% lower.
Gold closed down from $181.86 to $180.20 or about 1.1% lower.
Stronger than the SPY on a percentage basis.
GLD’s momentum on the Real Motion indicator turned up some yet remains in a bearish divergence to price.
SPY’s momentum also fell and sits just below the 50-DMA (first time it broke that momentum line since March) while the price is above it-that is a bearish divergence in momentum.
The point is, that if SPY falters more from here and GLD rises, this will confirm the first indication of risk off…something to watch for the coming week.
Silver is still underperforming gold and is also in contango.
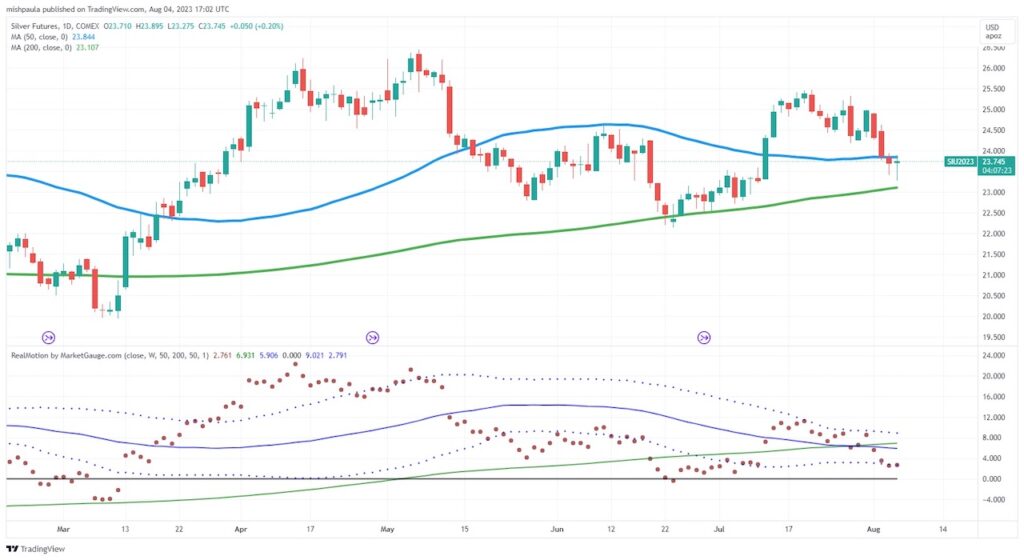
Silver futures closed under the 50-daily moving average but over the 200-DMA.
$23.50-24.00 gives us a good range to start from this week.
Above $24 and we would be encouraged to think silver has more upside.
And in the case of the next chart…
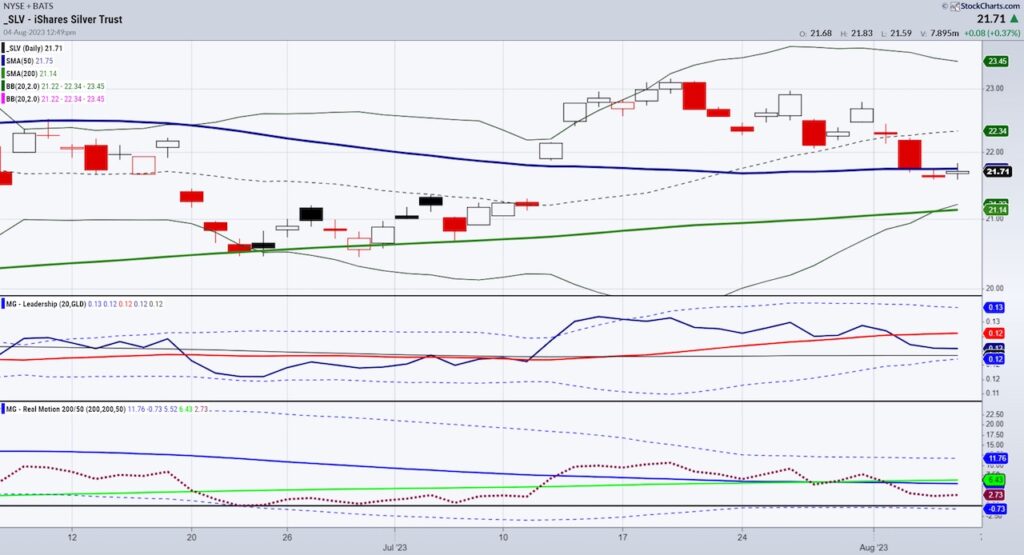
We would think that SLV could gain leadership against gold, which right now on the leadership indicator has it underperforming.
If so, that would be positive for both metals and a sign inflation is increasing.
SLV the ETF like the silver futures, closed under the 50-DMA and is in a warning phase.
The momentum indicator has silver waning in momentum so the decision on the next price move for silver could be evident as quickly as this week.
Twitter: @marketminute
The author may have a position in mentioned securities at the time of publication. Any opinions expressed herein are solely those of the author and do not represent the views or opinions of any other person or entity.
The post A Fresh Look at Precious Metals appeared first on See It Market.


Canadian Silver Co. Will See Big Changes in 2024
Source: Michael Ballanger 12/22/2023
Michael Ballanger of GGM Advisory Inc. takes a look at the current state of the market and shares on stock…
EGR options out Urban Berry project in Quebec to Harvest Gold – Richard Mills
2023.12.23
EGR Exploration Ltd. (TSXV: EGR) has moved from owner to shareholder at its Urban Berry project in Quebec, this week announcing it is optioning…
Crypto, Crude, & Crap Stocks Rally As Yield Curve Steepens, Rate-Cut Hopes Soar
Crypto, Crude, & Crap Stocks Rally As Yield Curve Steepens, Rate-Cut Hopes Soar
A weird week of macro data – strong jobless claims but…
