Precious Metals
A Deflationary Bust Danger
Treasury yields are plummeting … the 10-2 Spread is spiking back to zero … gold is near an all-time-high … more fears in banking and commercial real…

Treasury yields are plummeting … the 10-2 Spread is spiking back to zero … gold is near an all-time-high … more fears in banking and commercial real estate … is it a deflation bust?
Before we begin today, a quick note: Our offices will be closed tomorrow given the market holiday of Good Friday.
If you need help from our Customer Service team, they’ll be happy to assist you on Monday when we reopen.
Have a wonderful weekend.
If we take our cues from the market, the greatest fear today isn’t a resurgence of inflation, it’s a deflationary meltdown
Last year, the fear was inflation.
But it wasn’t just inflation in a vacuum. There were two associated fears.
The first is the obvious one – runaway inflation erodes the value of our dollars, everything becomes more expensive, we all suffer.
The second fear is what happens if/when the Federal Reserve, in an attempt to stop runaway inflation, goes too far, too fast. Its efforts unintentionally hobble the economy, which has the undesired effect of transforming inflation into deflation through a fast, painful bust.
While you might think of inflation as a slow boil of the economy, a deflationary meltdown is more like a guillotine chop.
As the Fed has embarked on the most intense rate-hike campaign in history, we’re seeing cracks in the economy – strengthening fears of such a deflationary bust.
What are some of the signs?
The first clue is treasury bond yields, which have gone into freefall
Bond yields and prices move inversely. So, saying that a bond yield is plummeting means that a bond price is skyrocketing, which reflects a surge in demand.
Investors stampede into bonds when they want safety from what they fear will be uncertain and/or dangerous upcoming market conditions.
So, how much “stampeding” has been happening?
On March 1st, the 10-year Treasury yield clocked in at 4.07%. As I write Thursday, this yield has fallen all the way to 3.28%.
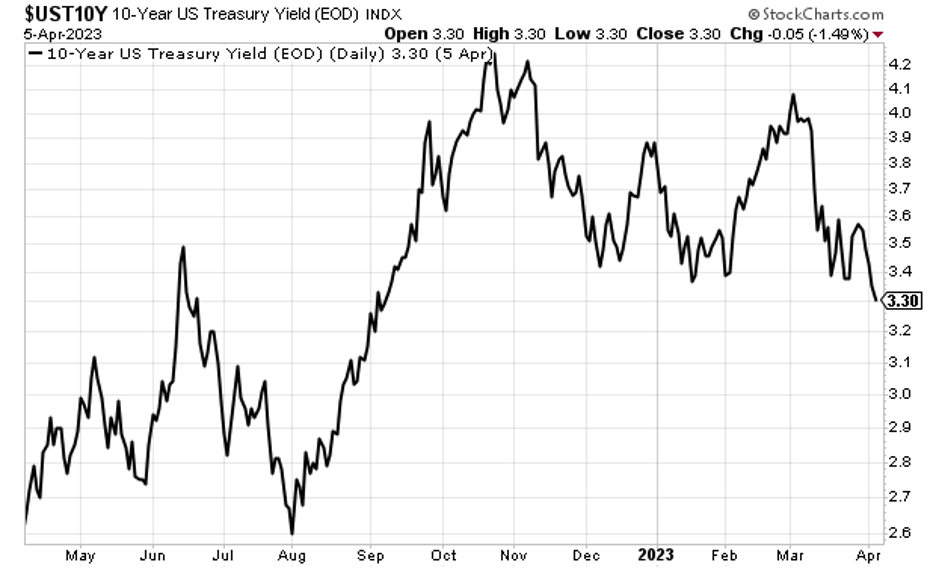 Source: StockCharts.com
While this is a huge move, the implosion in the two-year Treasury yield is even more pronounced.
From 5.06% in early-March, the two-year yield has now fallen all the way to 3.77%, which is actually up from yesterday’s 3.69%.
What these movements mean when viewed together in the “10-2 spread”
To begin, remember that we’ve been living in an “inverted yield curve” environment since last summer.
An inverted yield curve reflects a bond-market environment in which shorter-term bond yields are higher than longer-term bond yields.
An inverted yield curve isn’t healthy and indicates bond traders fear deteriorating market conditions.
One way to measure the severity of an inverted yield curve is by looking at the “10-2 spread.” This measures the difference between a long-term bond yield (the 10-year treasury yield) and a shorter-term bond yield (the two-year treasury yield).
Here’s YCharts with more context on inversions and this 10-2 Spread:
A negative 10-2 yield spread has historically been viewed as a precursor to a recessionary period.
A negative 10-2 spread has predicted every recession from 1955 to 2018, but has occurred 6-24 months before the recession occurring, and is thus seen as a far-leading indicator.
Again, we’ve had an inverted yield curve since July of last year. Plus, in March, the size of the spread reached its most extreme level since 1981.
If we go by history, this is a screaming red flag recession indicator.
But in recent weeks, the 10-2 spread has closed dramatically, racing toward “0”
Below, we look at the 10-2 spread since last spring.
You’re seeing it grow more and more extreme, until a few weeks ago, when it went vertical.
Remember what happened a few weeks ago?
The Silicon Valley Bank collapsed, followed by Signature Bank toppling, Credit Suisse failing, and then Moody’s downgrading the entire U.S. banking system.
Here’s the 10-2 spread spiking back toward zero.
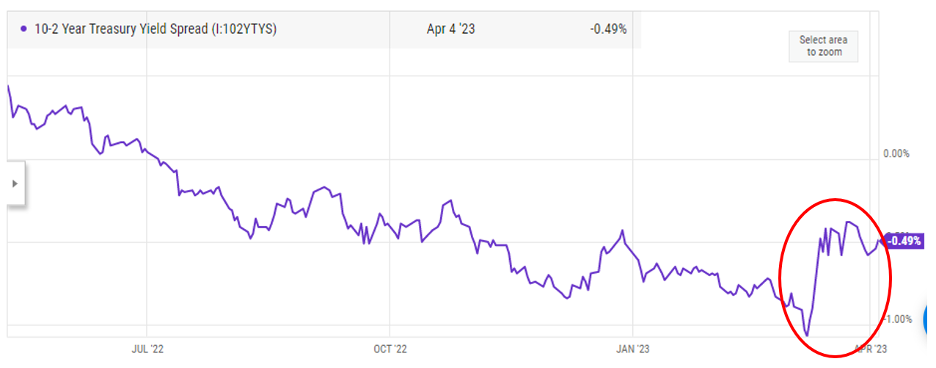 Source: YCharts.com
This is not healthy mean version. It’s the bond market betting big on the Fed cutting rates out of economic necessity.
For further proof, look at the CME Group’s FedWatch Tool, which shows us the probabilities of an FOMC rate hike, or rate cut, that traders are pricing into Fed Funds futures contracts.
Despite Federal Reserve Chairman Jerome Powell and a slew of Fed presidents claiming there will be zero rate hikes in 2023, Wall Street believes otherwise.
In fact, a plurality of traders believe that the Fed will have slashed rates by at least 75 basis points by this December.
Want to guess the odds that traders put on interest rates remaining at today’s target rate as the Fed suggests will be the case?
1%.
And this up impressively from yesterday’s “0.3%.”
Now, to be fair, we have a choice in how to interpret this
Do you believe this de-inverting of the 10-2 spread and the bets of rate cuts are Wall Street believing we’ll have an “all clear” for the economy by December?
More specifically, is it Wall Street saying “inflation will be much better by then, the economy will be on right footing, so much so, in fact, that the Fed can declare victory and cut rates.”
Or…
Do you believe this is Wall Street betting that the Fed will be forced to slash rates as a part of crisis management?
If you’re not sure, here’s billionaire “Bond King” Jeffrey Gundlach with his answer. He’s the chief executive of DoubleLine Capital.
To help contextualize his comment, remember YCharts just telling us that an inverted yield curve has predicted every recession from 1955 to 2018 but there’s a lag time in between the inversion and the recession. We’ve been in this lag time for roughly nine months now.
Here’s Gundlach:
In all the past recessions going back for decades, the yield curve starts de-inverting a few months before the recession.
Seems like cause for concern. But let’s see what other “deflation bomb” signals are out there.
What is gold telling us?
In recent weeks, the price of gold has soared. As I write Thursday, it’s at $2,023, which is within 1% of its all-time-high of $2,042.
Yesterday morning, it appeared poised to break the all-time-high before pulling back slightly. We could be at a new all-time-high at the time you read this.
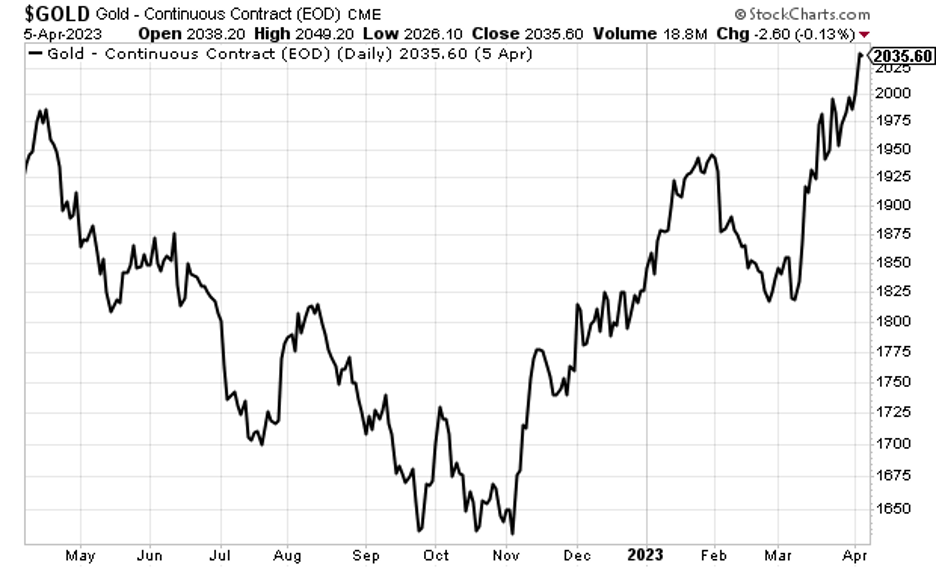 Source: StockCharts.com
Don’t miss the broader context of this.
When inflation was raging last summer with the CPI clocking in at 9%+, what was gold, the alleged “inflation hedge” doing?
It was falling in price.
Contrast that with today, when we have all sorts of data coming out that inflation is dropping, and yet, for some reason, gold is about to set a new all-time-high.
Why?
As we’ve pointed out here in the Digest, gold is a chaos hedge. This suggests investors are bracing for chaos. But not inflationary chaos – that opportunity came and went. Now we’re talking deflationary chaos.
What does that look like?
In a deflationary environment, prices are dropping in the economy. While that sounds good, they’re dropping because economic activity has ground to a halt.
Scared/stretched consumers hold onto their money, which leads to less revenues/profits for companies, which leads to corporate layoffs, which creates fear and even tighter-fisted consumers… rinse and repeat.
If things are bad enough, the Fed will be forced to abandon its tightening policy and reverse course, following historic precedent by papering over problems with magically-printed money.
At the same time, the broader U.S. government will go deeper into debt as it throws lifelines to all sorts of failing institutions, programs, and troubled citizens.
Here’s the London Bullion Market Association commenting on gold on this type of atmosphere:
In a period of global deflation, investors and the public increase their demand for gold as a hedge against paper currency debasement, a hedge against financial counterparty failure and the rising risk of private and public sector default.
If you disagree with this, okay. But then we need a new explanation for why gold is about to set a new all-time-high.
Speaking of “private sector default,” let’s jump to Jamie Dimon as we continue our tour around the economy’s deflation signals
Earlier this week, JPMorgan’s CEO Jamie Dimon wrote, “the current [banking] crisis is not yet over, and even when it is behind us, there will be repercussions from it for years to come.”
Plus, as you know based on our ongoing “commercial real estate watch” segment, smoke is beginning to billow above that troubled sector (which affects banking too).
In fact, on Monday, Morgan Stanley published research suggesting the commercial real estate sector faces a crash worse than the 2008 financial crisis.
From Newsweek:
“Commercial real estate, already facing headwinds from a shift to hybrid/remote work, has to refinance more than half of its mortgage debt in the next two years,” Lisa Shalett, chief investment officer for Morgan Stanley Wealth Management, wrote in a weekly report published Monday.
Shalett said that the market faces a “huge hurdle,” with analysts forecasting a commercial real estate decline “of as much as 40 percent worse than in the Great Financial Crisis.”
But stepping back now, is all of this an overreaction, and the signals we’re reading as “deflationary bust risk” are actually signs of things normalizing?
That’s possible. Throughout my decades as an investor, I’ve learned that humility is a must-have if you want to survive the market.
But for that to be the case, we need to answer a few tough questions…
How is the 10-2 spread spiking back toward zero as the banking sector faces a crisis anything less than a warning sign? Especially considering what this movements historically suggest about the timing of a recession?
How is gold soaring toward a new all-time-high as inflation falls indicative of our economy and financial systems normalizing rather than deteriorating?
How are CEO-commentary and various research reports warning of danger in the banking and commercial real estate sectors anything other than a bright red flag about coming economic conditions?
I don’t have those answers. But we’ll be watching everything closely and will provide more analysis in future issues of the Digest.
Have a good evening,
Jeff Remsburg
The post A Deflationary Bust Danger appeared first on InvestorPlace.
gold
inflation
deflation
reserve
policy
interest rates
fed
debasement
inflationary
deflationary


Canadian Silver Co. Will See Big Changes in 2024
Source: Michael Ballanger 12/22/2023
Michael Ballanger of GGM Advisory Inc. takes a look at the current state of the market and shares on stock…
EGR options out Urban Berry project in Quebec to Harvest Gold – Richard Mills
2023.12.23
EGR Exploration Ltd. (TSXV: EGR) has moved from owner to shareholder at its Urban Berry project in Quebec, this week announcing it is optioning…
Crypto, Crude, & Crap Stocks Rally As Yield Curve Steepens, Rate-Cut Hopes Soar
Crypto, Crude, & Crap Stocks Rally As Yield Curve Steepens, Rate-Cut Hopes Soar
A weird week of macro data – strong jobless claims but…


