Precious Metals
A comment on Jordà, Singh, and Taylor
Bloomberg recently discussed a new working paper out of the SF Fed, co-authored by Òscar Jordà, Sanjay R. Singh, and Alan M. Taylor (JST). They argued…

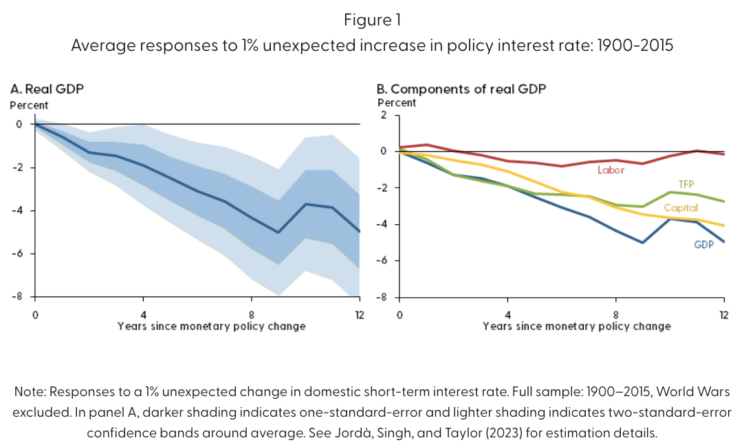
Bloomberg recently discussed a new working paper out of the SF Fed, co-authored by Òscar Jordà, Sanjay R. Singh, and Alan M. Taylor (JST). They argued that monetary policy has long lasting effects on productivity and output. The following graph is from the SF Fed letter that summarizes a longer JST research paper, which examines data from 1900 to 2015, excluding the two World Wars:
Here’s the abstract:
Monetary policy is often regarded as having only temporary effects on the economy, moderating the expansions and contractions that make up the business cycle. However, it is possible for monetary policy to affect an economy’s long-run trajectory. Analyzing cross-country data for a set of large national economies since 1900 suggests that tight monetary policy can reduce potential output even after a decade. By contrast, loose monetary policy does not appear to raise long-run potential. Such effects may be important for assessing the preferred stance of monetary policy.
Unfortunately, JST use interest rates as an indicator of the stance of monetary policy. Long-time readers know that I view interest rates as being among the worst of all possible policy indicators. Even JST recognize the problem:
A key challenge for analyzing data on the macroeconomy is isolating the relationships between economic variables that represent causation rather than correlation. If interest rates are raised when the economy is buoyant and inflation is rising, a simple correlation analysis could mistakenly suggest that high interest rates cause high inflation. In reality, interest rates are typically high because the central bank is trying to bring inflation down. Accounting for such reverse causality in macroeconomic data is crucial for understanding business cycle dynamics and the influence of monetary policy.
It’s actually much worse than that. Rates are not high during periods of high inflation “because the central bank is trying to bring inflation down”, they are high because inflation discourages saving and encourages investment for any given nominal interest rate. High inflation would cause high interest rates even in an economy with no central bank, and thus no monetary policy. I’m glad JST recognize the problem with using interest rates, but it’s even worse than they assume.
Here’s how they address the problem:
The approach we use to separate causation from correlation is based on a simple idea from international economics. Over the past century or more, smaller economies have sometimes pegged their exchange rate to the currency of a bigger economy, usually referred to as the base. In that scenario, the returns on assets with similar risk characteristics will move at a similar pace between the pegging and the base economies. . . .
Thus, when the base economy changes interest rates in response to domestic economic conditions, interest rates in the pegging economy will move in tandem, even if that economy’s domestic conditions do not require such an adjustment to interest rates. We use these externally driven interest rate movements as a source of random variation in monetary policy for the pegging economy. Because the change in financial conditions is independent of economic conditions in the pegging country, the resulting impacts are more likely to reflect causation rather than correlation.
That’s a nice idea, but does it really solve the problem? Suppose that the Canadian dollar is pegged to the US dollar (as in the 1920s.) Is the claim that the fed funds rate is not a useful indicator of the impact of monetary policy on Seattle’s economy, but is a useful indicator of the impact of monetary policy on Vancouver’s economy? I suppose you could argue that Seattle’s interest rate is in some sense endogenous—linked to the performance of the US economy—and Vancouver’s interest interest rate movements are independent of the US economy, and thus reflect “monetary policy”. But in practice the global business cycle is fairly strongly correlated, especially when there are major slumps such as 1921, 1930, 1974 and 2009.
The first part of the study examines monetary shocks under the classical gold standard (1900-14). At that time, the US had no central bank, so it would seem that we had no “monetary policy”. But in their longer paper, Great Britain is assumed to be the global monetary policymaker during this period—setting interest rates for all countries on the gold standard. That’s actually a fairly widely held view (Keynes called the BoE the conductor of the international orchestra), but I think it’s wrong.
Under a gold standard regime, the world price level (and NGDP) is determined by the global supply and demand for gold. The BoE had no direct impact on global gold supply and very little impact on global gold demand. I suspect it was like the little boy that ran out in front of the parade, and then took credit for the parade’s path through the city. Britain had little impact on global interest rates; rather the BoE (mostly) moved their policy rate in tandem with changes in the global natural interest rate. (Here the “natural rate” refers to the rate that stabilizes nominal gold prices, not the rate that stabilizes the global price level for goods and services.)
Even during the interwar years, the gold standard continued to exert an effect on global monetary conditions. There were two tight money policies that brought the price level back close to the pre-war level. The first (in late 1920) led to a severe recession in 1921, followed by the roaring 20s. The second (in late 1929) led to a depressed economy throughout the 1930s. In the latter case, however, other policies such as the NIRA played a major role in lengthening the Depression. Even so, one can plausibly argue that the monetary policy mistakes of 1929-33 led to the bad supply side policies of 1930-39.
Another period of high interest rates occurred in the late 1960s. This was followed by slower growth in real GDP and productivity during the 1970s and early 1980s. This slowdown was not caused by the tight money policy of the late 1960s, however, because monetary policy was not in fact contractionary according to any reasonable definition. During the 1960s and 1970s, money growth, inflation and NGDP growth all accelerated sharply. This is about as perfect an example of the Fisher effect as one could find. High interest rates reflected easy money. And this pattern was not limited to the US, similar outcomes occurred in a wide range of countries.
In recent decades, trend RGDP growth has been slowing. The high interest rates of 2000 were followed by somewhat slower growth in the early 2000s, and the rising rates of 2005-06 were followed by slower growth over the following decade. I doubt whether monetary policy had any significant impact on slowing growth during 2000-2007, but it probably played a role in slower growth during 2008-15. In the longer paper JST try to control for real factors that impact long run productivity growth trends, but that’s not easy to do. And equilibrium interest rates are certainly linked to the factors driving changes in long run growth.
To summarize, I have some sympathy for the claim that monetary contraction can have surprisingly long-lived effects, although the 12-year impact seems a bit implausible. Even the Great Depression doesn’t seem to have permanently impacted US real output or productivity. Indeed productivity rose at an unusually rapid rate during the 1930s, a period dominated by the most contractionary monetary shock in US history.
More importantly, I’d like to see economists move away from using interest rates as an indicator of monetary shocks. In a now classic paper, Barsky and Summers found that higher interest rates had an inflationary effect under the classical gold stand. Higher rates led to a higher opportunity cost of holding (zero interest) gold, and this reduced gold demand. Under the gold standard, lower gold demand is inflationary, as it reduces the purchasing power of the medium of account.
This explains the so-called “Gibson Paradox”, the positive correlation between interest rates and the global price level under the classical gold standard. And in this case the explanation is not “long and variable lags”; the relationship between interest rates and prices is causal—higher rates cause higher prices for goods and services. Their paper only makes sense if one assumes that the BoE did not control global monetary conditions.
(0 COMMENTS)
dollar
gold
inflation
monetary
policy
interest rates
fed
central bank
correlation
us dollar
monetary policy
inflationary


Canadian Silver Co. Will See Big Changes in 2024
Source: Michael Ballanger 12/22/2023
Michael Ballanger of GGM Advisory Inc. takes a look at the current state of the market and shares on stock…
EGR options out Urban Berry project in Quebec to Harvest Gold – Richard Mills
2023.12.23
EGR Exploration Ltd. (TSXV: EGR) has moved from owner to shareholder at its Urban Berry project in Quebec, this week announcing it is optioning…
Crypto, Crude, & Crap Stocks Rally As Yield Curve Steepens, Rate-Cut Hopes Soar
Crypto, Crude, & Crap Stocks Rally As Yield Curve Steepens, Rate-Cut Hopes Soar
A weird week of macro data – strong jobless claims but…
