Economics
The Stock Market is Like Picasso’s Cubist Period
Picasso is known as the father of cubist painting. He and others used geometric shapes and patterns to represent a specific form. Cubism, in Picasso’s…

Picasso is known as the father of cubist painting. He and others used geometric shapes and patterns to represent a specific form.
Cubism, in Picasso’s mind, was created to emphasize the different ways of seeing the world around us.
Picasso painted cubes and shapes using the concept of relativity while employing multiple perspectives.
The stock market in 2023 feels like a cubist painting. The different stock market indices and sectors relate to one another with a similar concept of relativity and multiple perspectives.
And clearly, these multiple perspectives have distorted reality and perception, yet still are recognizable.
Using the timeframes within business cycles: Expansion, Peak, Contraction, Trough
Some sectors/indices are in expansion. Some sectors/indices are in contraction.
While others are more stagnating or not quite expanding nor contracting.
Nothing appears to have peaked yet, and possibly some areas may have seen their trough.
Even in terms of inflation/disinflation, the same cubist analogy holds true.
Some areas look more disinflationary. While other areas look more inflationary.
In other words, everything is happening at the same time, which defies the logic of fitting the market or economy into a symmetrical box. Or, trying to fit a round peg in a square hole.
How do you invest at this time?
The areas in expansion are in growth and chip stocks. The precious metals, and many industrials are as well. (DIA closest to breaking out with QQQs second.)
A few areas in contraction are the regional banks, discretionary retail, small caps, and in energy, natural gas.
Sectors/Indices in stagnation, perhaps the most difficult to predict next move- can really be seen in the S&P 500, transportation, and oil.
The same is true with inflation and disinflation.
Some areas of disinflation can be seen with the recent ISM and PMI numbers. Housing and labor patterns tend to support disinflation.
Yet, inflation has not gone away, especially if one considers the falling yields and dollar. We have seen a massive rally in sugar, coffee, gold, silver, and metal miners.
Looking for signs:
Thursday, Regional Banks showed signs of a potential double bottom (a trough).
KRE held the March low as this past week the price came close to that low yet held closing green for the day. (Although still red for the week.)
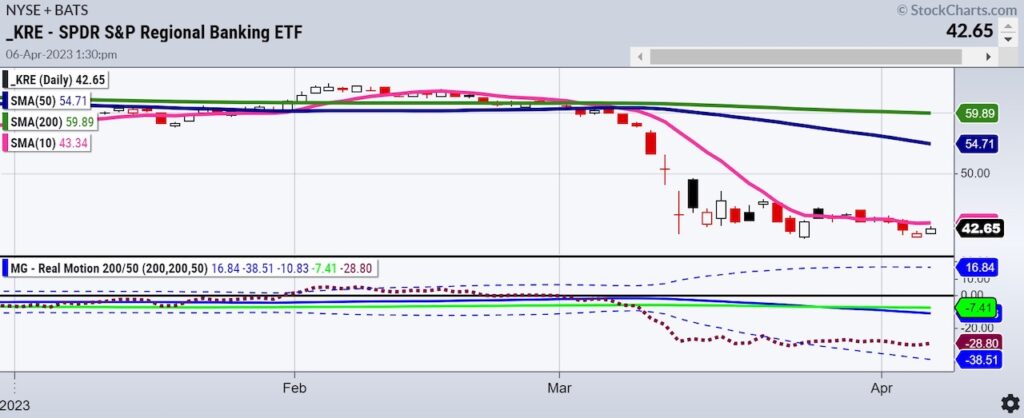
We want to see the price clear the cyan line or 10-Day moving average.
Momentum on our Real Motion Indicator interestingly, showed a mean reversion in March. Since momentum has picked up only slightly.
KRE is key as it is a part of the small caps or Russell 2000.
Should KRE continue to run from here, that will boost the entire market offering lots of low risk opportunities.
Some Favorites:
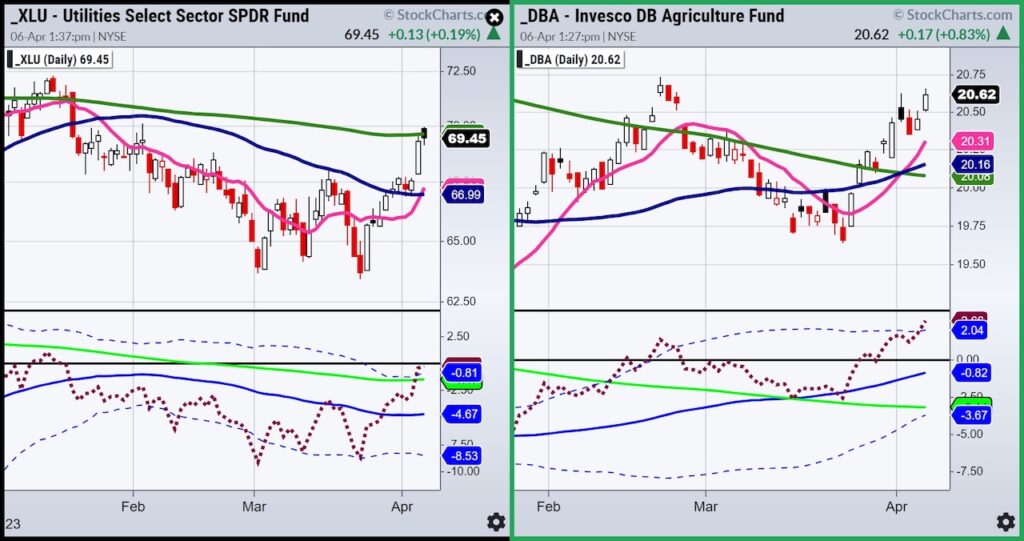
Both Utilities and the Agriculture ETF DBA have been recent subjects on the Daily and should remain on your radar.
Other sectors to watch are:
1. Global Live Streaming Sports/Music-PARA FWONA TME RUM
2. Emerging Markets-VGK DAX FXI VNM
3. Medical/ Healthcare-VRTX BIIB TEVA
4. Commodity Staples or Commodity based companies that have pricing power-TECK VLO
We will report more on these in the coming week.
Stock Market ETFs Trading Analysis & Summary:
S&P 500 (SPY) 405 support and 410 pivotal
Russell 2000 (IWM) 170 support- 180 resistance still
Dow (DIA) Through 336.25 could go higher
Nasdaq (QQQ) 325 resistance 314 10-DMA support
Regional banks (KRE) 41.28 March 24 low held and now has to clear 44
Semiconductors (SMH) 247 is the most significant support
Transportation (IYT) Held weekly MA support and now must clear 224
Biotechnology (IBB) Great job changing phases to bullish but must confirm over 130
Retail (XRT) Don’t want to see this break under 59.75-and best if clears 64.50
Twitter: @marketminute
The author may have a position in mentioned securities at the time of publication. Any opinions expressed herein are solely those of the author and do not represent the views or opinions of any other person or entity.
The post The Stock Market is Like Picasso’s Cubist Period appeared first on See It Market.
dollar
gold
silver
inflation
commodity
markets
metals
stagnation
inflationary


Argentina Is One of the Most Regulated Countries in the World
In the coming days and weeks, we can expect further, far‐reaching reform proposals that will go through the Argentine congress.

Crypto, Crude, & Crap Stocks Rally As Yield Curve Steepens, Rate-Cut Hopes Soar
Crypto, Crude, & Crap Stocks Rally As Yield Curve Steepens, Rate-Cut Hopes Soar
A weird week of macro data – strong jobless claims but…

Fed Pivot: A Blend of Confidence and Folly
Fed Pivot: Charting a New Course in Economic Strategy Dec 22, 2023 Introduction In the dynamic world of economics, the Federal Reserve, the central bank…


