Economics
The Shiller Ratio is Telling Investors There Is More To Come
As earnings season kicks off, the market is primed to witness some surprising turns in the coming days, weeks, and months ahead. Powell’s speech today…

As earnings season kicks off, the market is primed to witness some surprising turns in the coming days, weeks, and months ahead.
Powell’s speech today kept investors thinking about future interest rate hikes and what that all will mean.
Gold and silver continue to rise as a hedge against inflationary pressures from an increasingly robust labor market alongside continued consumer spending.
Oil is creeping up slowly. Value stocks outperform growth, while the US Dollar is vulnerable.
These data points are monitored continuously, to get a clearer idea of where the market will be in a few months.
We also watch similar events unfold and brought a favorite indicator for times like this! Financial professionals watch these factors across markets closely.
The CAPE Ratio Explained
Nobel prize-winning economist Robert Shiller created the cyclically adjusted price-to-earnings (C.A.P.E.) ratio to compile a valuation measure that averages profits over the last ten years, so it takes the stock price divided by a 10-year average of earnings.
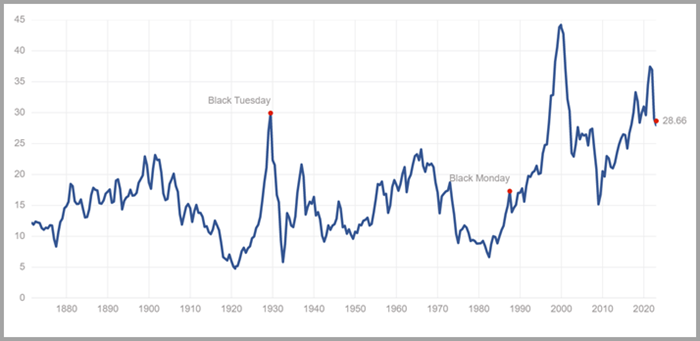
The CAPE Ratio is far from perfect, but it is an interesting measure to judge valuations. For example, shortly before the dot.com bust in 2000, the Schiller Ratio was at 44.
The historical average is 16.7 and on Tuesday, January 9, 2023, the Shiller Ratio was 28.66 similar in prices to 1929.
The price earnings ratio is based on average inflation-adjusted earnings from the previous 10 years, known as the Cyclically Adjusted PE Ratio or (CAPE Ratio).
A simple yet powerful measuring stick that helps identify and analyze trends in the business cycle, equipping those seeking financial gain better insight into potentially inflated market conditions.
Stock Market ETFs Trading Analysis & Summary:
S&P 500 (SPY) 385 support and 395 resistance
Russell 2000 (IWM) 177 pivotal support and 184 resistance
Dow (DIA) 333 support and 340 resistance
Nasdaq (QQQ) 268 support and 276 resistance
Regional banks (KRE) 56 support and resistance 62.
Semiconductors (SMH) Support is 216 and 223 resistance.
Transportation (IYT) 220 pivotal support and 230 is now resistance.
Biotechnology (IBB) 127 is pivotal support 168 overhead resistance.
Retail (XRT) 60 pivotal support and 66 is now resistance.
Twitter: @marketminute
The author may have a position in mentioned securities at the time of publication. Any opinions expressed herein are solely those of the author and do not represent the views or opinions of any other person or entity.
The post The Shiller Ratio is Telling Investors There Is More To Come appeared first on See It Market.


Argentina Is One of the Most Regulated Countries in the World
In the coming days and weeks, we can expect further, far‐reaching reform proposals that will go through the Argentine congress.

Crypto, Crude, & Crap Stocks Rally As Yield Curve Steepens, Rate-Cut Hopes Soar
Crypto, Crude, & Crap Stocks Rally As Yield Curve Steepens, Rate-Cut Hopes Soar
A weird week of macro data – strong jobless claims but…

Fed Pivot: A Blend of Confidence and Folly
Fed Pivot: Charting a New Course in Economic Strategy Dec 22, 2023 Introduction In the dynamic world of economics, the Federal Reserve, the central bank…
