Economics
Nikkei 225 may see a silver lining from Japanese banks
The current second-half performance of the Nikkei 225 is considered wobbly as it recorded a Q3 loss of -4% and underperformed slightly against the US S&P…
![]()
![]()
![]()
- The current second-half performance of the Nikkei 225 is considered wobbly as it recorded a Q3 loss of -4% and underperformed slightly against the US S&P 500.
- The recent lacklustre performance of the Nikkei 225 has been impacted significantly by the performance of the S&P 500 rather than JPY movement.
- In the past three months, Japanese banks have offered a silver lining in a bearish Nikkei 225 environment as the TOPIX Banks sector outperformed with a positive return of +13.22%
- Watch the 200-day moving average of the Nikkei 225 now acting as key medium-term support at 29,880.
In the first half of 2023, the Japanese benchmark stock index, Nikkei 225 recorded a stellar performance of +27.19% that managed to surpass the US S&P 500 (+15.91%) and the MSCI All Country World Index exchange-traded fund (+13.03) over the same period.
In contrast, the second half of 2023 has painted a different tune, the Nikkei 225 ended Q3 with a loss of -4.01%, and it also kickstarted Q4 will a quarter-to-date loss of -4.18% as of 4 October 2023 at this time of the writing. Also, the Nikkei 225 underperformed slightly against the US S&P 500 (- 3.65%), and MSCI All Country World Index ETF (-3.72%) in Q3.
What is the main factor that is driving the current lacklustre performance of Nikkei 225?
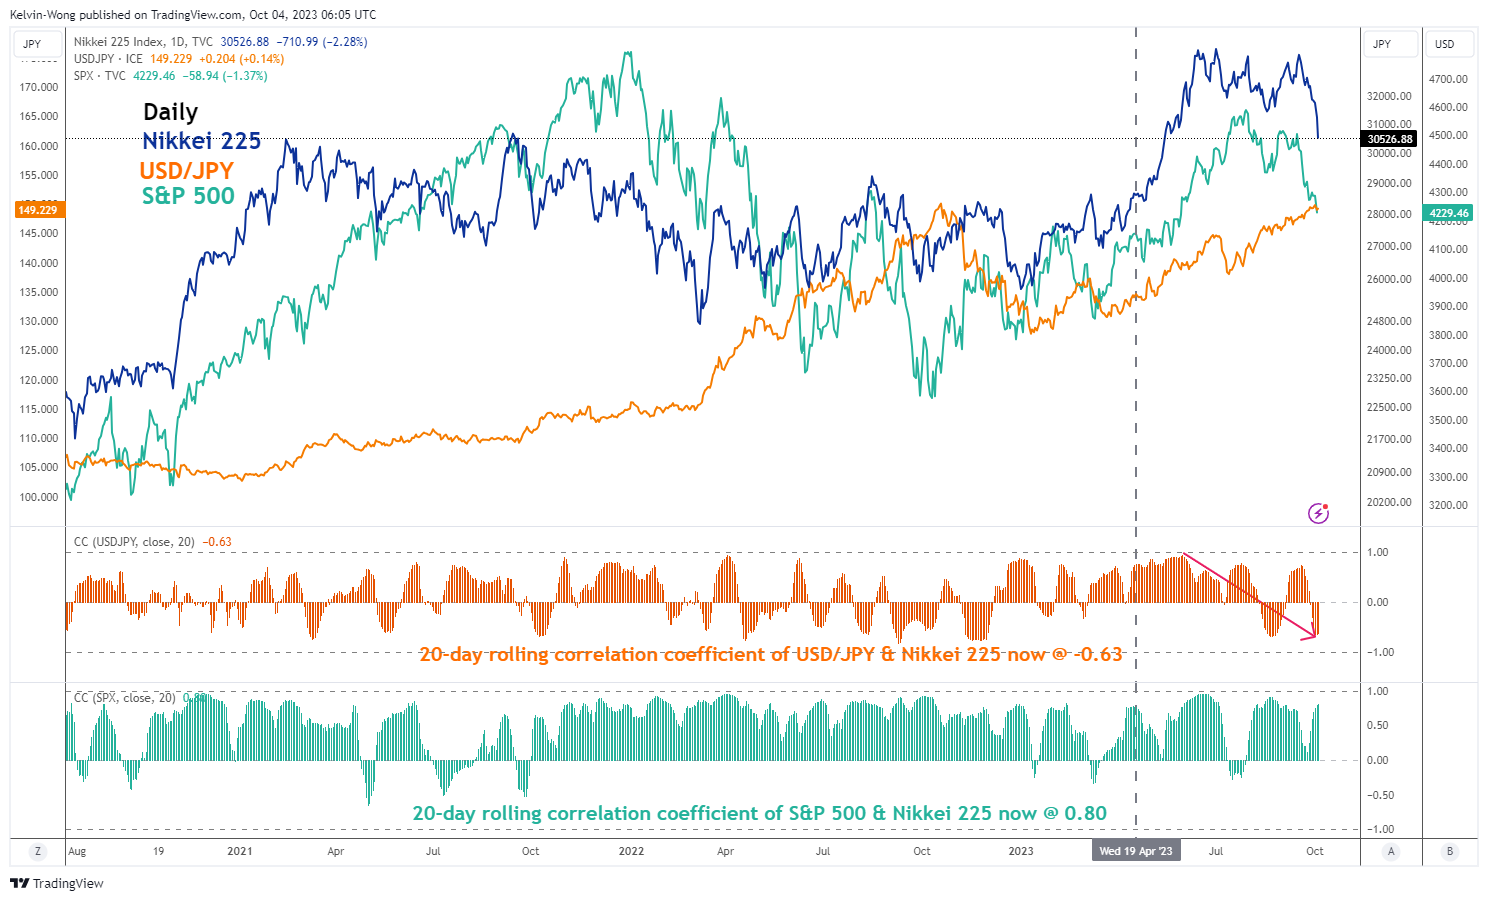
Fig 1: Nikkei 225’s 20-day rolling correlation with USD/JPY & S&P 500 as of 4 Oct 2023 (Source: TradingView, click to enlarge chart)
Based on a multi-factor model approach to determine the potential future returns of the Japanese stock market (Nikkei 225), the “traditional” positive beta factor of USD/JPY has diminished in recent months.
The prior USD/JPY’s high direct correlation with Nikkei 225 since June 2023 has broken down as the USD/JPY’s 20-day rolling correlation with Nikkei 225 has dipped into a negative significant reading of -0.64 as of 4 October 2023.
In contrast, the US S&P 500 ‘s 20-day rolling correlation with the Nikkei 225 has maintained a high positive reading of 0.80 over the same period.
Therefore, the current weak performance seen in the Nikkei 225 is likely to be more impacted by the US stock market (S&P 500) rather than the movement of the JPY as right now a weaker JPY against the USD has not triggered a positive feedback loop back into the Japanese stock market.
The TOPIX Banks sector has offered a silver lining
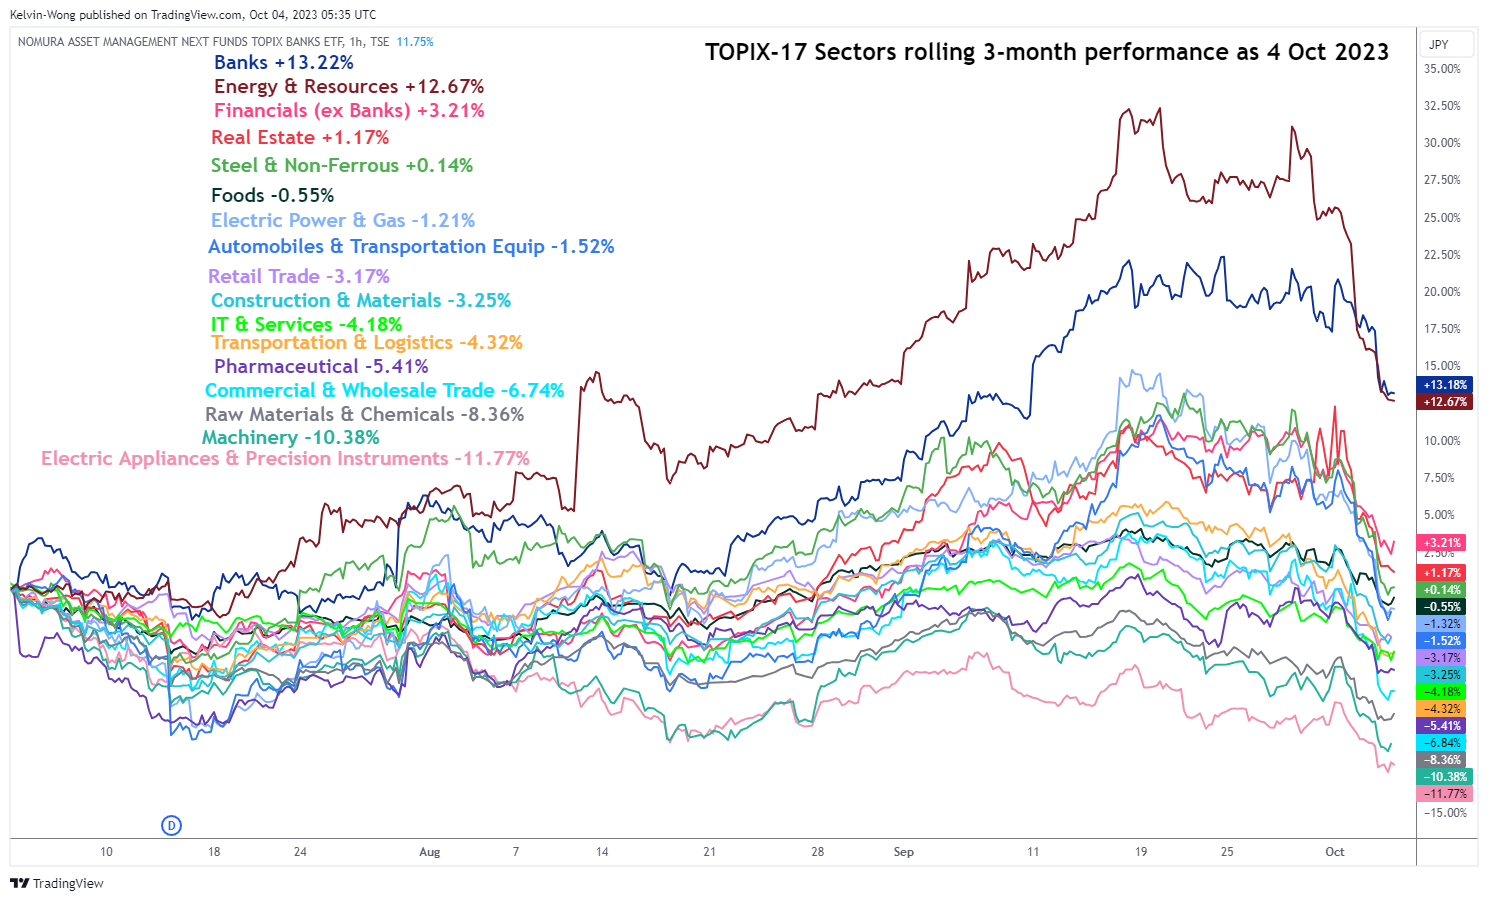
Fig 2: 3-month rolling performances of TOPIX sectors as of 4 Oct 2024 (Source: TradingView, click to enlarge chart)
Among the 17 TOPIX industry sectors in the Japanese stock market, the Banks sector was one of the worst performers in the first half of 2023, but its fortunes have started to reverse in Q3 where it is now the top performer with a +13.22% return based on a three-month rolling calculation as of 4 October 2023.
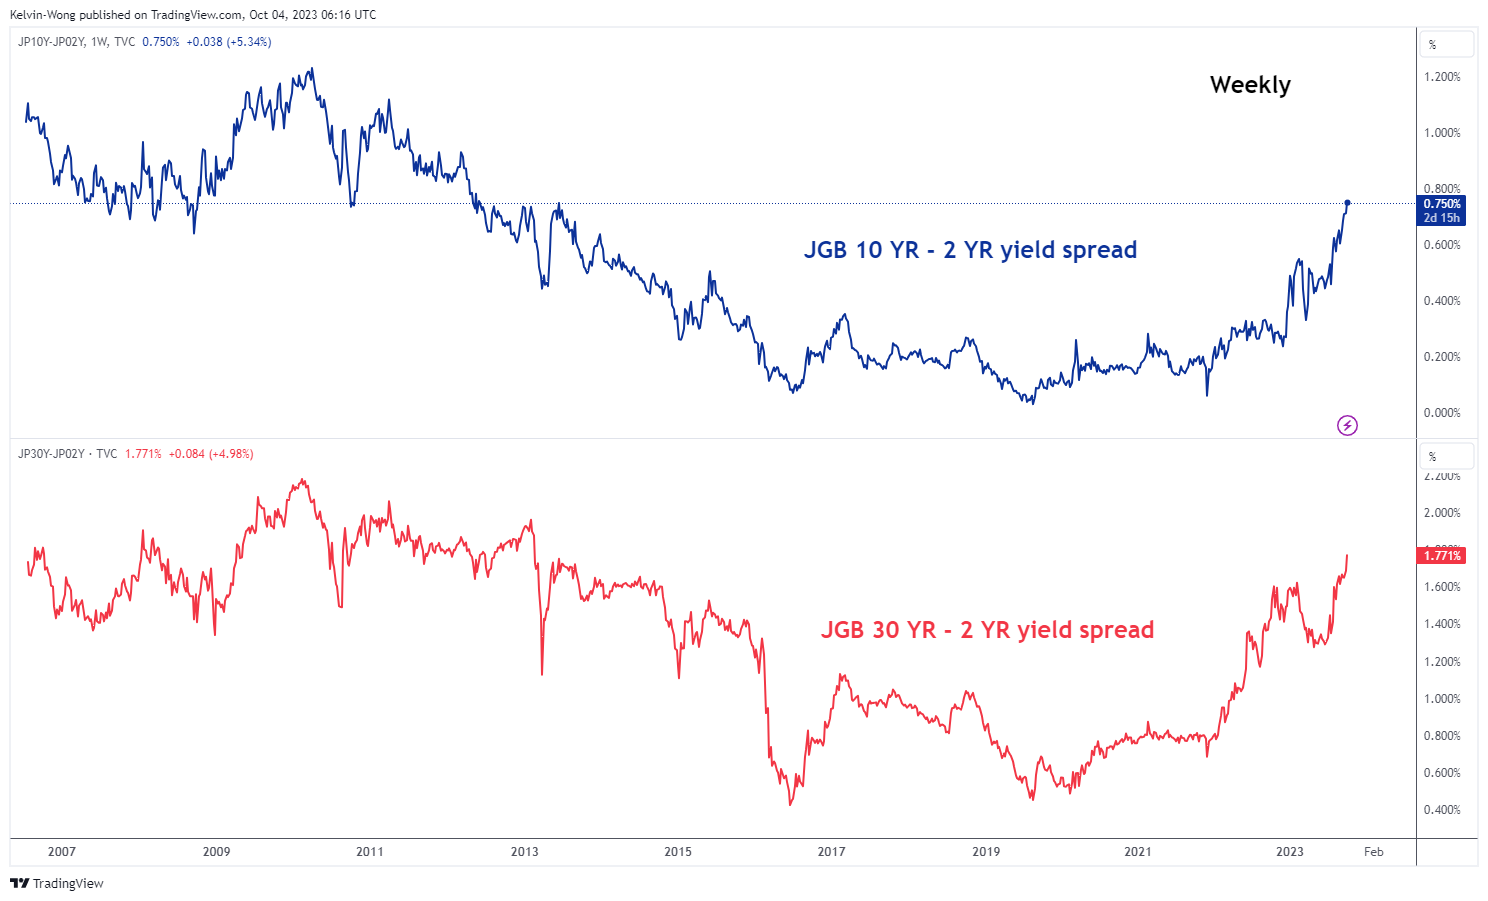
Fig 3: JGB yield curves as of 4 Oct 2024 (Source: TradingView, click to enlarge chart)
The primary driver that triggered the current resilient performance of the TOPIX Banks sector has been the steep rise in the Japanese government bonds (JGBs) yield curve after the Bank of Japan (BoJ) introduced a “flexible yield curve control” policy on the 10-year JGB yield during its July’s monetary policy meeting that in turn signalled a gradual step in exiting negative interest rates in Japan. A further steepening of the JGB yield curve is likely to give a significant positive boost to the net interest margins of Japanese banks.
The next line of defence will be the 200-day moving average
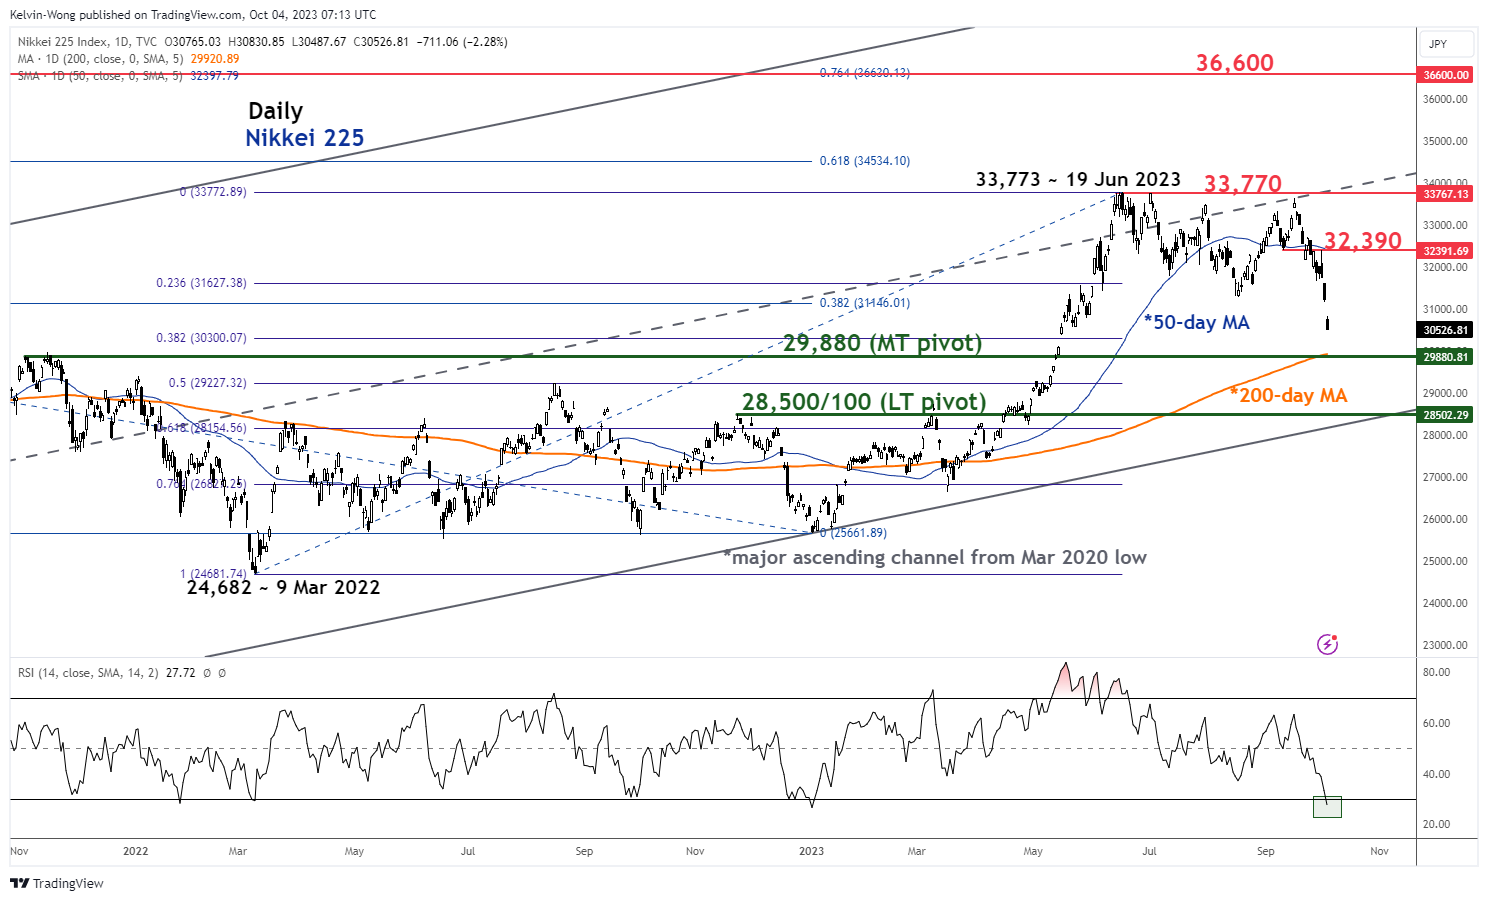
Fig 4: Nikkei 225 medium-term & major trends as of 4 Oct 2024 (Source: TradingView, click to enlarge chart)
The ongoing decline of -9.72% seen in the Nikkei 225 from its 19 June 2023 high of 33,773 is now fast approaching its key 200-day moving average now acting as key medium-term support at 29,880 that confluences with the swing high areas of 4/19 November 2022 and close to 38.2% Fibonacci retracement of the recent major uptrend phase from 9 March 2022 low to 19 June 2023 high.
In addition, the daily RSI oscillator has dipped into its oversold region which increases the odds of a potential multi-week rebound. Overall, the long-term secular uptrend of the Nikkei 225 remains intact as its price actions are still above the lower boundary of a major ascending channel in place since the March 2020 low.
In order to kickstart a potential new medium-term impulsive up move sequence, the bulls need to recapture the 32,390 resistance (congestion area of 11/25 September 2023, 50-day moving average & the 61.8% Fibonacci retracement of the entire decline from 19 June 2023 high to 4 October 2023 current intraday low).
On the other hand, failure to hold at the 200-day moving average support of 29,880 exposes the Index to an extended decline to challenge the long-term pivotal support zone of 28,500/28,100.
silver
monetary
policy
interest rates
correlation
negative interest rates
monetary policy


Argentina Is One of the Most Regulated Countries in the World
In the coming days and weeks, we can expect further, far‐reaching reform proposals that will go through the Argentine congress.

Crypto, Crude, & Crap Stocks Rally As Yield Curve Steepens, Rate-Cut Hopes Soar
Crypto, Crude, & Crap Stocks Rally As Yield Curve Steepens, Rate-Cut Hopes Soar
A weird week of macro data – strong jobless claims but…

Fed Pivot: A Blend of Confidence and Folly
Fed Pivot: Charting a New Course in Economic Strategy Dec 22, 2023 Introduction In the dynamic world of economics, the Federal Reserve, the central bank…


