Economics
China in Recession?
Interview on CNN with LingLing Wei today, she doesn’t say “recession”, but the idea is there (“struggling, ‘big time’”I think is the phrase)….

Interview on CNN with LingLing Wei today, she doesn’t say “recession”, but the idea is there (“struggling, ‘big time’”I think is the phrase). Here’s a picture of industrial production ex.-construction through May, and ECRI’s recession dates (peak-to-trough):
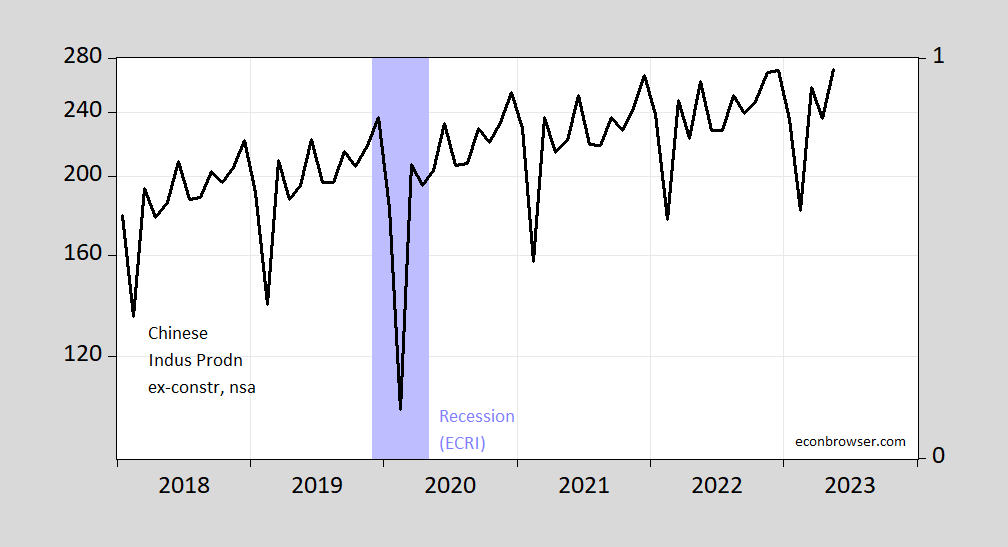
Figure 1: Chinese industrial production ex-construction (black, left log scale). ECRI defined peak-to-trough recession dates shaded light blue. Source: OECD MEI via FRED, ECRI.
It’s clear industrial production growth has slowed (IP is shown on log scale, so a decreasing slope indicates slowing growth rate). Incipient deflation is suggestive of recession, or at least a slowdown (if one believes in a Phillips curve, although an expectations and input augmented Phillips curve indicates caution). Does this mean we’re in a recession in China? And who gets to decide what’s a recession in China? (See discussion by Frankel here.) Consider ECRI as compared to OECD’s indicator.
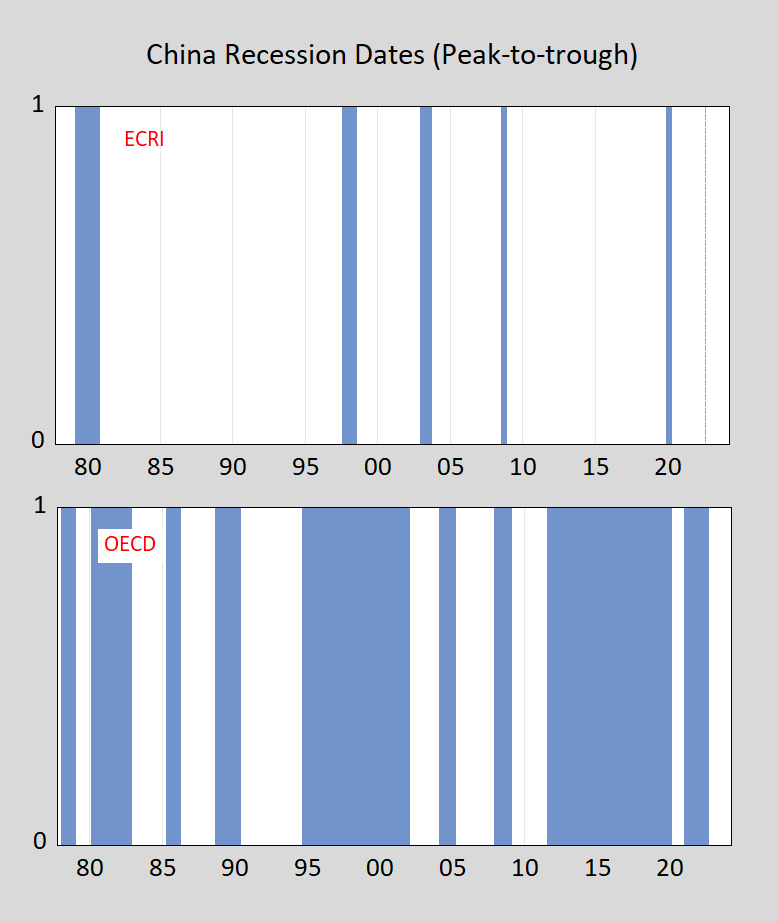
Figure 2: Recession dates (peak-to-trough) for China, from Economic Cycle Research Institute shaded blue (ECRI), top panel, from OECD shaded blue (bottom panel). OECD series ends in 2022M09, denoted by red dashed line. Source: ECRI, OECD via FRED.
Clearly, there is little congruence of views on what defines a recession (for a listing of sources for recession calls across countries, see this post).
We’ll know a bit more in a few hours (10pm ET), as a bevy of data for Q2 is released, including GDP and industrial production, fixed assets, etc. Growth in GDP y/y consensus is 7.3% vs. 4.5% previous, which sounds pretty good, although consensus for q/q is 0.5% vs. 2.2% previous (not annualized). June industrial production y/y growth is at 2.7% consensus vs. 3.5% previous, retail sales 3.2% consensus vs. 12.7% previous.
What we already know is that consumer prices are flat, and producer prices are falling.
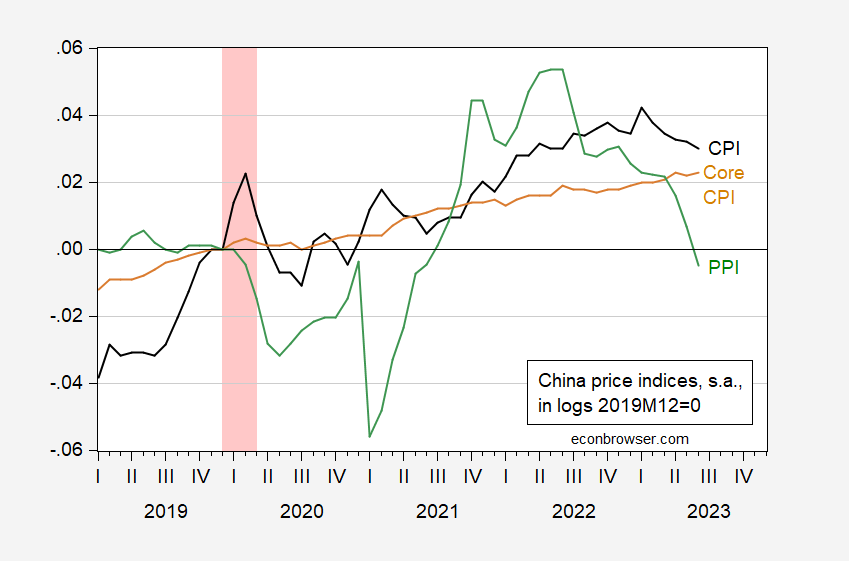
Figure 3: China CPI (black), core CPI (tan), and PPI (green), all in logs, 2019M12=0. ECRI defined peak-to-trough recession dates shaded pink. Source: Kose/Ohnsorge – World Bank and IMF, IFS, both updated using TradingEconomics; and author’s calculations.


Argentina Is One of the Most Regulated Countries in the World
In the coming days and weeks, we can expect further, far‐reaching reform proposals that will go through the Argentine congress.

Crypto, Crude, & Crap Stocks Rally As Yield Curve Steepens, Rate-Cut Hopes Soar
Crypto, Crude, & Crap Stocks Rally As Yield Curve Steepens, Rate-Cut Hopes Soar
A weird week of macro data – strong jobless claims but…

Fed Pivot: A Blend of Confidence and Folly
Fed Pivot: Charting a New Course in Economic Strategy Dec 22, 2023 Introduction In the dynamic world of economics, the Federal Reserve, the central bank…
