Companies
Zeolite Market Size to Grow by USD 3.94 Bn, Majority of Market Growth to Originate from Europe – Technavio
Zeolite Market Size to Grow by USD 3.94 Bn, Majority of Market Growth to Originate from Europe – Technavio
PR Newswire
NEW YORK, Oct. 17, 2022
NEW YORK, Oct. 17, 2022 /PRNewswire/ — The zeolite market size is set to grow by USD 3.94 billion from 2…
Zeolite Market Size to Grow by USD 3.94 Bn, Majority of Market Growth to Originate from Europe – Technavio
PR Newswire
NEW YORK, Oct. 17, 2022
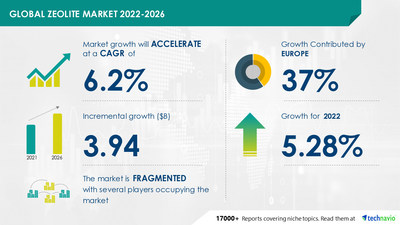
NEW YORK, Oct. 17, 2022 /PRNewswire/ — The zeolite market size is set to grow by USD 3.94 billion from 2021 to 2026. In addition, the growth momentum of the market will accelerate at a CAGR of 6.2% during the forecast period, according to Technavio. The market segmentation by end-user (detergent, catalyst, adsorbent, and others), type (natural and synthetic), and geography (Europe, APAC, North America, Middle East and Africa, and South America).

Make informed business decisions based on the qualitative and quantitative information highlighted in Technavio reports. Request a FREE PDF Sample Report!
Zeolite Market Sizing
Zeolite Market Forecast
Zeolite Market Analysis
The zeolite market is expected to be dominated by Europe during the forecast period. The region will account for 37% of the market’s growth. This growth is attributed to factors such as the increasing use of zeolite as a refrigeration adsorbent. However, market growth in this region will be slower than the growth of the market in other regions. Germany and France are the key countries for the zeolite market in Europe. The demand for zeolite is increasing in Europe owing to the rise in its use for removing nuclear waste. In addition, support from governments for the production of bio-based chemicals and the abundance of naturally occurring zeolite in Turkey and Russia are expected to fuel market growth in the region. Moreover, the rising use of zeolite in wastewater treatment and purification and drying of gases in Europe will augment the consumption of zeolite during the forecast period in the region.
Anten Chemical Co. Ltd., Arkema S.A., BASF SE, Clariant AG, CWK Chemiewerk Bad Kostritz GmbH, Hengye Inc., Honeywell International Inc., International Zeolite Corp., Interra Global, KMI Zeolite Inc., KNT Group, Lenntech BV, St. Cloud Mining, Tosoh Corp, United States Antimony Corp., W. R. Grace and Co., ZEOCEM AS, Zeochem AG, Zeolyst International, Blue Pacific Minerals Ltd, among others, are the main players in the market. The key offerings of some of these vendors are listed below:
- Arkema S.A. – The company offers zeolites such as Siliporite for Building and Nitroxy series for Oxygen concentrators.
- BASF SE – The company offers specialty zeolites for applications such as refinery catalysts for olefin and fuel production.
- Clariant AG – The company offers unique zeolite-based minerals for applications such as animal health products, soil and potting mix amendments, and odor absorbers.
- KMI Zeolite Inc. – The company offers a series of mSORB molecular sieve beads such as mSORB 3A812B, mSORB 3A48B, and mSORB 3A48BNG.
- ZEOCEM AS – The company offers zeolite powders under the brand name SYLOSIV, which provides exceptional adsorptive capacity at very low moisture levels.
- International Zeolite Corp. – The company offers zeolite products for odor absorption, such as Asensa DS 910 and Asensa DS 912.
- Interra Global – The company offers natural zeolite and zeolite products such as Barn Sense, Smell Grabber, and ecoTraction.
Subscribe to our “Basic Plan” billed annually at USD 5000 to view 100 reports monthly and download 5 reports monthly
Copper Market by Type, Application, and Geography – Forecast and Analysis 2022-2026: The copper market share is expected to increase by 5013.06 thousand tons from 2021 to 2026.
Nanosilica Market by Type, Application, and Geography – Forecast and Analysis 2022-2026: The nano-silica market share is expected to increase by USD 2.06 billion from 2021 to 2026.
|
Zeolite Market Scope |
|
|
Report Coverage |
Details |
|
Page number |
120 |
|
Base year |
2021 |
|
Forecast period |
2022-2026 |
|
Growth momentum & CAGR |
Accelerate at a CAGR of 6.2% |
|
Market growth 2022-2026 |
USD 3.94 billion |
|
Market structure |
Fragmented |
|
YoY growth (%) |
5.28 |
|
Regional analysis |
Europe, APAC, North America, Middle East and Africa, and South America |
|
Performing market contribution |
Europe at 37% |
|
Key consumer countries |
US, China, South Korea, Germany, and France |
|
Competitive landscape |
Leading companies, competitive strategies, consumer engagement scope |
|
Companies profiled |
Anten Chemical Co. Ltd., Arkema S.A., BASF SE, Clariant AG, CWK Chemiewerk Bad Kostritz GmbH, Hengye Inc., Honeywell International Inc., International Zeolite Corp., Interra Global, KMI Zeolite Inc., KNT Group, Lenntech BV, St. Cloud Mining, Tosoh Corp, United States Antimony Corp., W. R. Grace and Co., ZEOCEM AS, Zeochem AG, Zeolyst International, and Blue Pacific Minerals Ltd |
|
Market Dynamics |
Parent market analysis, market growth inducers and obstacles, fast-growing and slow-growing segment analysis, COVID-19 impact and future consumer dynamics, and market condition analysis for the forecast period. |
|
Customization purview |
If our report has not included the data that you are looking for, you can reach out to our analysts and get segments customized. |
Browse Materials Market Reports
1 Executive Summary
- 1.1 Market overview
- Exhibit 01: Executive Summary – Chart on Market Overview
- Exhibit 02: Executive Summary – Data Table on Market Overview
- Exhibit 03: Executive Summary – Chart on Global Market Characteristics
- Exhibit 04: Executive Summary – Chart on Market by Geography
- Exhibit 05: Executive Summary – Chart on Market Segmentation by End-user
- Exhibit 06: Executive Summary – Chart on Market Segmentation by Product Type
- Exhibit 07: Executive Summary – Chart on Incremental Growth
- Exhibit 08: Executive Summary – Data Table on Incremental Growth
- Exhibit 09: Executive Summary – Chart on Vendor Market Positioning
2 Market Landscape
- 2.1 Market ecosystem
- Exhibit 10: Parent market
- Exhibit 11: Market Characteristics
3 Market Sizing
- 3.1 Market definition
- Exhibit 12: Offerings of vendors included in the market definition
- 3.2 Market segment analysis
- Exhibit 13: Market segments
- 3.3 Market size 2021
- 3.4 Market outlook: Forecast for 2021-2026
- Exhibit 14: Chart on Global – Market size and forecast 2021-2026 ($ million)
- Exhibit 15: Data Table on Global – Market size and forecast 2021-2026 ($ million)
- Exhibit 16: Chart on Global Market: Year-over-year growth 2021-2026 (%)
- Exhibit 17: Data Table on Global Market: Year-over-year growth 2021-2026 (%)
4 Five Forces Analysis
- 4.1 Five forces summary
- Exhibit 18: Five forces analysis – Comparison between 2021 and 2026
- 4.2 Bargaining power of buyers
- Exhibit 19: Chart on Bargaining power of buyers – Impact of key factors 2021 and 2026
- 4.3 Bargaining power of suppliers
- Exhibit 20: Bargaining power of suppliers – Impact of key factors in 2021 and 2026
- 4.4 Threat of new entrants
- Exhibit 21: Threat of new entrants – Impact of key factors in 2021 and 2026
- 4.5 Threat of substitutes
- Exhibit 22: Threat of substitutes – Impact of key factors in 2021 and 2026
- 4.6 Threat of rivalry
- Exhibit 23: Threat of rivalry – Impact of key factors in 2021 and 2026
- 4.7 Market condition
- Exhibit 24: Chart on Market condition – Five forces 2021 and 2026
5 Market Segmentation by End-user
- 5.1 Market segments
- Exhibit 25: Chart on End-user – Market share 2021-2026 (%)
- Exhibit 26: Data Table on End-user – Market share 2021-2026 (%)
- 5.2 Comparison by End-user
- Exhibit 27: Chart on Comparison by End-user
- Exhibit 28: Data Table on Comparison by End-user
- 5.3 Detergent – Market size and forecast 2021-2026
- Exhibit 29: Chart on Detergent – Market size and forecast 2021-2026 ($ million)
- Exhibit 30: Data Table on Detergent – Market size and forecast 2021-2026 ($ million)
- Exhibit 31: Chart on Detergent – Year-over-year growth 2021-2026 (%)
- Exhibit 32: Data Table on Detergent – Year-over-year growth 2021-2026 (%)
- 5.4 Catalyst – Market size and forecast 2021-2026
- Exhibit 33: Chart on Catalyst – Market size and forecast 2021-2026 ($ million)
- Exhibit 34: Data Table on Catalyst – Market size and forecast 2021-2026 ($ million)
- Exhibit 35: Chart on Catalyst – Year-over-year growth 2021-2026 (%)
- Exhibit 36: Data Table on Catalyst – Year-over-year growth 2021-2026 (%)
- 5.5 Adsorbent – Market size and forecast 2021-2026
- Exhibit 37: Chart on Adsorbent – Market size and forecast 2021-2026 ($ million)
- Exhibit 38: Data Table on Adsorbent – Market size and forecast 2021-2026 ($ million)
- Exhibit 39: Chart on Adsorbent – Year-over-year growth 2021-2026 (%)
- Exhibit 40: Data Table on Adsorbent – Year-over-year growth 2021-2026 (%)
- 5.6 Others – Market size and forecast 2021-2026
- Exhibit 41: Chart on Others – Market size and forecast 2021-2026 ($ million)
- Exhibit 42: Data Table on Others – Market size and forecast 2021-2026 ($ million)
- Exhibit 43: Chart on Others – Year-over-year growth 2021-2026 (%)
- Exhibit 44: Data Table on Others – Year-over-year growth 2021-2026 (%)
- 5.7 Market opportunity by End-user
- Exhibit 45: Market opportunity by End-user ($ million)
6 Market Segmentation by Product Type
- 6.1 Market segments
- Exhibit 46: Chart on Product Type – Market share 2021-2026 (%)
- Exhibit 47: Data Table on Product Type – Market share 2021-2026 (%)
- 6.2 Comparison by Product Type
- Exhibit 48: Chart on Comparison by Product Type
- Exhibit 49: Data Table on Comparison by Product Type
- 6.3 Natural – Market size and forecast 2021-2026
- Exhibit 50: Chart on Natural – Market size and forecast 2021-2026 ($ million)
- Exhibit 51: Data Table on Natural – Market size and forecast 2021-2026 ($ million)
- Exhibit 52: Chart on Natural – Year-over-year growth 2021-2026 (%)
- Exhibit 53: Data Table on Natural – Year-over-year growth 2021-2026 (%)
- 6.4 Synthetic – Market size and forecast 2021-2026
- Exhibit 54: Chart on Synthetic – Market size and forecast 2021-2026 ($ million)
- Exhibit 55: Data Table on Synthetic – Market size and forecast 2021-2026 ($ million)
- Exhibit 56: Chart on Synthetic – Year-over-year growth 2021-2026 (%)
- Exhibit 57: Data Table on Synthetic – Year-over-year growth 2021-2026 (%)
- 6.5 Market opportunity by Product Type
- Exhibit 58: Market opportunity by Product Type ($ million)
7 Customer Landscape
- 7.1 Customer landscape overview
- Exhibit 59: Analysis of price sensitivity, lifecycle, customer purchase basket, adoption rates, and purchase criteria
8 Geographic Landscape
- 8.1 Geographic segmentation
- Exhibit 60: Chart on Market share by geography 2021-2026 (%)
- Exhibit 61: Data Table on Market share by geography 2021-2026 (%)
- 8.2 Geographic comparison
- Exhibit 62: Chart on Geographic comparison
- Exhibit 63: Data Table on Geographic comparison
- 8.3 Europe – Market size and forecast 2021-2026
- Exhibit 64: Chart on Europe – Market size and forecast 2021-2026 ($ million)
- Exhibit 65: Data Table on Europe – Market size and forecast 2021-2026 ($ million)
- Exhibit 66: Chart on Europe – Year-over-year growth 2021-2026 (%)
- Exhibit 67: Data Table on Europe – Year-over-year growth 2021-2026 (%)
- 8.4 APAC – Market size and forecast 2021-2026
- Exhibit 68: Chart on APAC – Market size and forecast 2021-2026 ($ million)
- Exhibit 69: Data Table on APAC – Market size and forecast 2021-2026 ($ million)
- Exhibit 70: Chart on APAC – Year-over-year growth 2021-2026 (%)
- Exhibit 71: Data Table on APAC – Year-over-year growth 2021-2026 (%)
- 8.5 North America – Market size and forecast 2021-2026
- Exhibit 72: Chart on North America – Market size and forecast 2021-2026 ($ million)
- Exhibit 73: Data Table on North America – Market size and forecast 2021-2026 ($ million)
- Exhibit 74: Chart on North America – Year-over-year growth 2021-2026 (%)
- Exhibit 75: Data Table on North America – Year-over-year growth 2021-2026 (%)
- 8.6 Middle East and Africa – Market size and forecast 2021-2026
- Exhibit 76: Chart on Middle East and Africa – Market size and forecast 2021-2026 ($ million)
- Exhibit 77: Data Table on Middle East and Africa – Market size and forecast 2021-2026 ($ million)
- Exhibit 78: Chart on Middle East and Africa – Year-over-year growth 2021-2026 (%)
- Exhibit 79: Data Table on Middle East and Africa – Year-over-year growth 2021-2026 (%)
- 8.7 South America – Market size and forecast 2021-2026
- Exhibit 80: Chart on South America – Market size and forecast 2021-2026 ($ million)
- Exhibit 81: Data Table on South America – Market size and forecast 2021-2026 ($ million)
- Exhibit 82: Chart on South America – Year-over-year growth 2021-2026 (%)
- Exhibit 83: Data Table on South America – Year-over-year growth 2021-2026 (%)
- 8.8 China – Market size and forecast 2021-2026
- Exhibit 84: Chart on China – Market size and forecast 2021-2026 ($ million)
- Exhibit 85: Data Table on China – Market size and forecast 2021-2026 ($ million)
- Exhibit 86: Chart on China – Year-over-year growth 2021-2026 (%)
- Exhibit 87: Data Table on China – Year-over-year growth 2021-2026 (%)
- 8.9 US – Market size and forecast 2021-2026
- Exhibit 88: Chart on US – Market size and forecast 2021-2026 ($ million)
- Exhibit 89: Data Table on US – Market size and forecast 2021-2026 ($ million)
- Exhibit 90: Chart on US – Year-over-year growth 2021-2026 (%)
- Exhibit 91: Data Table on US – Year-over-year growth 2021-2026 (%)
- 8.10 Germany – Market size and forecast 2021-2026
- Exhibit 92: Chart on Germany – Market size and forecast 2021-2026 ($ million)
- Exhibit 93: Data Table on Germany – Market size and forecast 2021-2026 ($ million)
- Exhibit 94: Chart on Germany – Year-over-year growth 2021-2026 (%)
- Exhibit 95: Data Table on Germany – Year-over-year growth 2021-2026 (%)
- 8.11 France – Market size and forecast 2021-2026
- Exhibit 96: Chart on France – Market size and forecast 2021-2026 ($ million)
- Exhibit 97: Data Table on France – Market size and forecast 2021-2026 ($ million)
- Exhibit 98: Chart on France – Year-over-year growth 2021-2026 (%)
- Exhibit 99: Data Table on France – Year-over-year growth 2021-2026 (%)
- 8.12 South Korea – Market size and forecast 2021-2026
- Exhibit 100: Chart on South Korea – Market size and forecast 2021-2026 ($ million)
- Exhibit 101: Data Table on South Korea – Market size and forecast 2021-2026 ($ million)
- Exhibit 102: Chart on South Korea – Year-over-year growth 2021-2026 (%)
- Exhibit 103: Data Table on South Korea – Year-over-year growth 2021-2026 (%)
- 8.13 Market opportunity by geography
- Exhibit 104: Market opportunity by geography ($ million)
9 Drivers, Challenges, and Trends
- 9.1 Market drivers
- 9.2 Market challenges
- 9.3 Impact of drivers and challenges
- Exhibit 105: Impact of drivers and challenges in 2021 and 2026
- 9.4 Market trends
10 Vendor Landscape
- 10.1 Overview
- 10.2 Vendor landscape
- Exhibit 106: Overview on Criticality of inputs and Factors of differentiation
- 10.3 Landscape disruption
- Exhibit 107: Overview on factors of disruption
- 10.4 Industry risks
- Exhibit 108: Impact of key risks on business
11 Vendor Analysis
- 11.1 Vendors covered
- Exhibit 109: Vendors covered
- 11.2 Market positioning of vendors
- Exhibit 110: Matrix on vendor position and classification
- 11.3 Anten Chemical Co. Ltd.
- Exhibit 111: Anten Chemical Co. Ltd. – Overview
- Exhibit 112: Anten Chemical Co. Ltd. – Product / Service
- Exhibit 113: Anten Chemical Co. Ltd. – Key offerings
- 11.4 Arkema S.A.
- Exhibit 114: Arkema S.A. – Overview
- Exhibit 115: Arkema S.A. – Business segments
- Exhibit 116: Arkema S.A. – Key news
- Exhibit 117: Arkema S.A. – Key offerings
- Exhibit 118: Arkema S.A. – Segment focus
- 11.5 BASF SE
- Exhibit 119: BASF SE – Overview
- Exhibit 120: BASF SE – Business segments
- Exhibit 121: BASF SE – Key news
- Exhibit 122: BASF SE – Key offerings
- Exhibit 123: BASF SE – Segment focus
- 11.6 Blue Pacific Minerals Ltd
- Exhibit 124: Blue Pacific Minerals Ltd – Overview
- Exhibit 125: Blue Pacific Minerals Ltd – Product / Service
- Exhibit 126: Blue Pacific Minerals Ltd – Key offerings
- 11.7 Honeywell International Inc.
- Exhibit 127: Honeywell International Inc. – Overview
- Exhibit 128: Honeywell International Inc. – Business segments
- Exhibit 129: Honeywell International Inc. – Key news
- Exhibit 130: Honeywell International Inc. – Key offerings
- Exhibit 131: Honeywell International Inc. – Segment focus
- 11.8 International Zeolite Corp.
- Exhibit 132: International Zeolite Corp. – Overview
- Exhibit 133: International Zeolite Corp. – Business segments
- Exhibit 134: International Zeolite Corp. – Key offerings
- Exhibit 135: International Zeolite Corp. – Segment focus
- 11.9 Interra Global
- Exhibit 136: Interra Global – Overview
- Exhibit 137: Interra Global – Product / Service
- Exhibit 138: Interra Global – Key offerings
- 11.10 Tosoh Corp
- Exhibit 139: Tosoh Corp – Overview
- Exhibit 140: Tosoh Corp – Business segments
- Exhibit 141: Tosoh Corp – Key offerings
- Exhibit 142: Tosoh Corp – Segment focus
- 11.11 United States Antimony Corp.
- Exhibit 143: United States Antimony Corp. – Overview
- Exhibit 144: United States Antimony Corp. – Product / Service
- Exhibit 145: United States Antimony Corp. – Key offerings
- 11.12 W. R. Grace and Co.
- Exhibit 146: W. R. Grace and Co. – Overview
- Exhibit 147: W. R. Grace and Co. – Business segments
- Exhibit 148: W. R. Grace and Co. – Key offerings
- Exhibit 149: W. R. Grace and Co. – Segment focus
12 Appendix
- 12.1 Scope of the report
- 12.2 Inclusions and exclusions checklist
- Exhibit 150: Inclusions checklist
- Exhibit 151: Exclusions checklist
- 12.3 Currency conversion rates for US$
- Exhibit 152: Currency conversion rates for US$
- 12.4 Research methodology
- Exhibit 153: Research methodology
- Exhibit 154: Validation techniques employed for market sizing
- Exhibit 155: Information sources
- 12.5 List of abbreviations
- Exhibit 156: List of abbreviations
Technavio is a leading global technology research and advisory company. Their research and analysis focus on emerging market trends and provide actionable insights to help businesses identify market opportunities and develop effective strategies to optimize their market positions. With over 500 specialized analysts, Technavio’s report library consists of more than 17,000 reports and counting, covering 800 technologies, spanning across 50 countries. Their client base consists of enterprises of all sizes, including more than 100 Fortune 500 companies. This growing client base relies on Technavio’s comprehensive coverage, extensive research, and actionable market insights to identify opportunities in existing and potential markets and assess their competitive positions within changing market scenarios.
Technavio Research
Jesse Maida
Media & Marketing Executive
US: +1 844 364 1100
UK: +44 203 893 3200
Email: [email protected]
Website: www.technavio.com/

View original content to download multimedia:https://www.prnewswire.com/news-releases/zeolite-market-size-to-grow-by-usd-3-94-bn-majority-of-market-growth-to-originate-from-europe–technavio-301649579.html
SOURCE Technavio
tsxv-iz
international-zeolite-corp
international zeolite corp
press-release


Dolly Varden consolidates Big Bulk copper-gold porphyry by acquiring southern-portion claims – Richard Mills
2023.12.22
Dolly Varden Silver’s (TSXV:DV, OTCQX:DOLLF) stock price shot up 16 cents for a gain of 20% Thursday, after announcing a consolidation of…

GoldTalks: Going big on ASX-listed gold stocks
Aussie investors are spoiled for choice when it comes to listed goldies, says Kyle Rodda. Here are 3 blue chips … Read More
The post GoldTalks: Going…
Gold Digger: ‘Assured growth’ – central bank buying spree set to drive gold higher in 2024
Central banks will drive the price of gold higher in 2024, believe various analysts Spot gold prices seem stable to … Read More
The post Gold Digger:…