Companies
Lithium Market to grow by 24.38 in 2023, Albemarle Corp. and Avalon Advanced Materials Inc. emerge as a Key Contributers to growth| Technavio
Lithium Market to grow by 24.38 in 2023, Albemarle Corp. and Avalon Advanced Materials Inc. emerge as a Key Contributers to growth| Technavio
PR Newswire
NEW YORK, Aug. 16, 2023
NEW YORK, Aug. 16, 2023 /PRNewswire/ – Technavio has been monitoring t…

Lithium Market to grow by 24.38 in 2023, Albemarle Corp. and Avalon Advanced Materials Inc. emerge as a Key Contributers to growth| Technavio
PR Newswire
NEW YORK, Aug. 16, 2023
NEW YORK, Aug. 16, 2023 /PRNewswire/ – Technavio has been monitoring the lithium market and it is set to grow by 1066.47 thousand t from 2023 to 2027, progressing at a CAGR of 25% during the forecast period. The report offers an up-to-date analysis regarding the current market scenario, latest trends and drivers, and the overall market environment. Download a Free Sample Report on COVID-19

Impact of COVID-19
The COVID-19 pandemic continues to transform the growth of various industries, however, the immediate impact of the outbreak is varied. While a few industries will register a drop in demand, numerous others will continue to remain unscathed and show promising growth opportunities. COVID-19 will have a low on the lithium market. The market growth in 2020 is likely to INCREASE compared to the market growth in 2019.
Frequently Asked Questions:
- Based on segmentation by, which is the leading segment in the market?
- What are the major trends in the market?
- At what rate is the market projected to grow?
- Who are the top players in the market?
- What are the key market drivers and challenges?
- How big is the APAC market?
Buy 1 Technavio report and get the second for 50% off. Buy 2 Technavio reports and get the third for free.
View market snapshot before purchasing
The market is fragmented, and the degree of fragmentation will accelerate during the forecast period. Albemarle Corp., Avalon Advanced Materials Inc., Critical Elements Lithium Corp., Ganfeng Lithium Co. Ltd., IGO Ltd., Lithium Americas Corp., Lithium Australia Ltd., Livent Corp., MGX Minerals Inc., Mineral Resources Ltd., Nemaska Lithium Inc., Neometals Ltd., Orocobre Ltd., Perseus Mining Ltd., Pilbara Minerals Ltd., Pluspetrol Resources Corporation B.V., Sayona Mining Ltd., Sociedad Quimica y Minera de Chile SA, Tianqi Lithium Corp., and Shanghai Oujin Lithium Industrial Co. Ltd. are some of the major market participants. Although the Surge in demand from diversified applications | Rise in demand from developing countries | Increased demand from EVs industry will offer immense growth opportunities, is likely to pose a challenge for the market vendors. In a bid to help players strengthen their market foothold, this lithium market forecast report provides a detailed analysis of the leading market vendors. The report also empowers industry honchos with information on the competitive landscape and insights into the different product offerings offered by various companies.
Technavio’s custom research reports offer detailed insights on the impact of COVID-19 at an industry level, a regional level, and subsequent supply chain operations. This customized report will also help clients keep up with new product launches in direct & indirect COVID-19 related markets, upcoming vaccines and pipeline analysis, and significant developments in vendor operations and government regulations.
Lithium Market 2023-2027: Segmentation
Lithium Market is segmented as below:
- Application
- Batteries
- Ceramics And Glass
- Grease
- Polymer
- Others
- Product
- Carbonate
- Hydroxide
- Others
- Geography
- APAC
- North America
- Europe
- South America
- Middle East And Africa
To learn more about the global trends impacting the future of market research, download a free sample: https://www.technavio.com/talk-to-us?report=IRTNTR45931
Lithium Market 2023-2027: Scope
Technavio presents a detailed picture of the market by the way of study, synthesis, and summation of data from multiple sources. The lithium market report covers the following areas:
- Lithium Market Size
- Lithium Market Trends
- Lithium Market Industry Analysis
This study identifies Capacity expansions to accelerate market growth as one of the prime reasons driving the Lithium Market growth during the next few years.
Technavio suggests three forecast scenarios (optimistic, probable, and pessimistic) considering the impact of COVID-19. Technavio’s in-depth research has direct and indirect COVID-19 impacted market research reports.
Register for a free trial today and gain instant access to 17,000+ market research reports.
Technavio’s SUBSCRIPTION platform
Lithium Market 2023-2027: Key Highlights
- CAGR of the market during the forecast period 2023-2027
- Detailed information on factors that will assist lithium market growth during the next five years
- Estimation of the lithium market size and its contribution to the parent market
- Predictions on upcoming trends and changes in consumer behavior
- The growth of the lithium market
- Analysis of the market’s competitive landscape and detailed information on vendors
- Comprehensive details of factors that will challenge the growth of lithium market vendors
|
Lithium Market Scope |
|
|
Report Coverage |
Details |
|
Base year |
2022 |
|
Historic period |
2017-2021 |
|
Forecast period |
2023-2027 |
|
Growth momentum & CAGR |
Accelerate at a CAGR of 25% |
|
Market growth 2023-2027 |
1066.47 thousand t |
|
Market structure |
Fragmented |
|
YoY growth 2022-2023(%) |
24.38 |
|
Regional analysis |
APAC, North America, Europe, South America, and Middle East and Africa |
|
Performing market contribution |
APAC at 70% |
|
Key countries |
US, China, Japan, South Korea, and Germany |
|
Competitive landscape |
Leading Vendors, Market Positioning of Vendors, Competitive Strategies, and Industry Risks |
|
Key companies profiled |
Albemarle Corp., Avalon Advanced Materials Inc., Critical Elements Lithium Corp., Ganfeng Lithium Co. Ltd., IGO Ltd., Lithium Americas Corp., Lithium Australia Ltd., Livent Corp., MGX Minerals Inc., Mineral Resources Ltd., Nemaska Lithium Inc., Neometals Ltd., Orocobre Ltd., Perseus Mining Ltd., Pilbara Minerals Ltd., Pluspetrol Resources Corporation B.V., Sayona Mining Ltd., Sociedad Quimica y Minera de Chile SA, Tianqi Lithium Corp., and Shanghai Oujin Lithium Industrial Co. Ltd. |
|
Market dynamics |
Parent market analysis, Market growth inducers and obstacles, Fast-growing and slow-growing segment analysis, COVID 19 impact and recovery analysis and future consumer dynamics, Market condition analysis for forecast period |
|
Customization purview |
If our report has not included the data that you are looking for, you can reach out to our analysts and get segments customized. |
Table of Contents:
1 Executive Summary
- 1.1 Market overview
- Exhibit 01: Executive Summary – Chart on Market Overview
- Exhibit 02: Executive Summary – Data Table on Market Overview
- Exhibit 03: Executive Summary – Chart on Global Market Characteristics
- Exhibit 04: Executive Summary – Chart on Market by Geography
- Exhibit 05: Executive Summary – Chart on Market Segmentation by Application
- Exhibit 06: Executive Summary – Chart on Market Segmentation by Product
- Exhibit 07: Executive Summary – Chart on Incremental Growth
- Exhibit 08: Executive Summary – Data Table on Incremental Growth
- Exhibit 09: Executive Summary – Chart on Vendor Market Positioning
2 Market Landscape
- 2.1 Market ecosystem
- Exhibit 10: Parent market
- Exhibit 11: Market Characteristics
3 Market Sizing
- 3.1 Market definition
- Exhibit 12: Offerings of vendors included in the market definition
- 3.2 Market segment analysis
- Exhibit 13: Market segments
- 3.3 Market size 2022
- 3.4 Market outlook: Forecast for 2022-2027
- Exhibit 14: Chart on Global – Market size and forecast 2022-2027 (thousand t)
- Exhibit 15: Data Table on Global – Market size and forecast 2022-2027 (thousand t)
- Exhibit 16: Chart on Global Market- Year-over-year growth 2022-2027 (%)
- Exhibit 17: Data Table on Global Market- Year-over-year growth 2022-2027 (%)
4 Historic Market Size
- 4.1 Global lithium market 2017 – 2021
- Exhibit 18: Historic Market Size – Data Table on Global lithium market 2017 – 2021 (thousand t)
- 4.2 Application Segment Analysis 2017 – 2021
- Exhibit 19: Historic Market Size – Application Segment 2017 – 2021 (thousand t)
- 4.3 Product Segment Analysis 2017 – 2021
- Exhibit 20: Historic Market Size – Product Segment 2017 – 2021 (thousand t)
- 4.4 Geography Segment Analysis 2017 – 2021
- Exhibit 21: Historic Market Size – Geography Segment 2017 – 2021 (thousand t)
- 4.5 Country Segment Analysis 2017 – 2021
- Exhibit 22: Historic Market Size – Country Segment 2017 – 2021 (thousand t)
5 Five Forces Analysis
- 5.1 Five forces summary
- Exhibit 23: Five forces analysis – Comparison between 2022 and 2027
- 5.2 Bargaining power of buyers
- Exhibit 24: Chart on Bargaining power of buyers – Impact of key factors 2022 and 2027
- 5.3 Bargaining power of suppliers
- Exhibit 25: Bargaining power of suppliers – Impact of key factors in 2022 and 2027
- 5.4 Threat of new entrants
- Exhibit 26: Threat of new entrants – Impact of key factors in 2022 and 2027
- 5.5 Threat of substitutes
- Exhibit 27: Threat of substitutes – Impact of key factors in 2022 and 2027
- 5.6 Threat of rivalry
- Exhibit 28: Threat of rivalry – Impact of key factors in 2022 and 2027
- 5.7 Market condition
- Exhibit 29: Chart on Market condition – Five forces 2022 and 2027
6 Market Segmentation by Application
- 6.1 Market segments
- Exhibit 30: Chart on Application – Market share 2022-2027 (%)
- Exhibit 31: Data Table on Application – Market share 2022-2027 (%)
- 6.2 Comparison by Application
- Exhibit 32: Chart on Comparison by Application
- Exhibit 33: Data Table on Comparison by Application
- 6.3 Batteries – Market size and forecast 2022-2027
- Exhibit 34: Chart on Batteries – Market size and forecast 2022-2027 (thousand t)
- Exhibit 35: Data Table on Batteries – Market size and forecast 2022-2027 (thousand t)
- Exhibit 36: Chart on Batteries – Year-over-year growth 2022-2027 (%)
- Exhibit 37: Data Table on Batteries – Year-over-year growth 2022-2027 (%)
- 6.4 Ceramics and glass – Market size and forecast 2022-2027
- Exhibit 38: Chart on Ceramics and glass – Market size and forecast 2022-2027 (thousand t)
- Exhibit 39: Data Table on Ceramics and glass – Market size and forecast 2022-2027 (thousand t)
- Exhibit 40: Chart on Ceramics and glass – Year-over-year growth 2022-2027 (%)
- Exhibit 41: Data Table on Ceramics and glass – Year-over-year growth 2022-2027 (%)
- 6.5 Grease – Market size and forecast 2022-2027
- Exhibit 42: Chart on Grease – Market size and forecast 2022-2027 (thousand t)
- Exhibit 43: Data Table on Grease – Market size and forecast 2022-2027 (thousand t)
- Exhibit 44: Chart on Grease – Year-over-year growth 2022-2027 (%)
- Exhibit 45: Data Table on Grease – Year-over-year growth 2022-2027 (%)
- 6.6 Polymer – Market size and forecast 2022-2027
- Exhibit 46: Chart on Polymer – Market size and forecast 2022-2027 (thousand t)
- Exhibit 47: Data Table on Polymer – Market size and forecast 2022-2027 (thousand t)
- Exhibit 48: Chart on Polymer – Year-over-year growth 2022-2027 (%)
- Exhibit 49: Data Table on Polymer – Year-over-year growth 2022-2027 (%)
- 6.7 Others – Market size and forecast 2022-2027
- Exhibit 50: Chart on Others – Market size and forecast 2022-2027 (thousand t)
- Exhibit 51: Data Table on Others – Market size and forecast 2022-2027 (thousand t)
- Exhibit 52: Chart on Others – Year-over-year growth 2022-2027 (%)
- Exhibit 53: Data Table on Others – Year-over-year growth 2022-2027 (%)
- 6.8 Market opportunity by Application
- Exhibit 54: Market opportunity by Application (thousand t)
- Exhibit 55: Data Table on Market opportunity by Application (thousand t)
7 Market Segmentation by Product
- 7.1 Market segments
- Exhibit 56: Chart on Product – Market share 2022-2027 (%)
- Exhibit 57: Data Table on Product – Market share 2022-2027 (%)
- 7.2 Comparison by Product
- Exhibit 58: Chart on Comparison by Product
- Exhibit 59: Data Table on Comparison by Product
- 7.3 Carbonate – Market size and forecast 2022-2027
- Exhibit 60: Chart on Carbonate – Market size and forecast 2022-2027 (thousand t)
- Exhibit 61: Data Table on Carbonate – Market size and forecast 2022-2027 (thousand t)
- Exhibit 62: Chart on Carbonate – Year-over-year growth 2022-2027 (%)
- Exhibit 63: Data Table on Carbonate – Year-over-year growth 2022-2027 (%)
- 7.4 Hydroxide – Market size and forecast 2022-2027
- Exhibit 64: Chart on Hydroxide – Market size and forecast 2022-2027 (thousand t)
- Exhibit 65: Data Table on Hydroxide – Market size and forecast 2022-2027 (thousand t)
- Exhibit 66: Chart on Hydroxide – Year-over-year growth 2022-2027 (%)
- Exhibit 67: Data Table on Hydroxide – Year-over-year growth 2022-2027 (%)
- 7.5 Others – Market size and forecast 2022-2027
- Exhibit 68: Chart on Others – Market size and forecast 2022-2027 (thousand t)
- Exhibit 69: Data Table on Others – Market size and forecast 2022-2027 (thousand t)
- Exhibit 70: Chart on Others – Year-over-year growth 2022-2027 (%)
- Exhibit 71: Data Table on Others – Year-over-year growth 2022-2027 (%)
- 7.6 Market opportunity by Product
- Exhibit 72: Market opportunity by Product (thousand t)
- Exhibit 73: Data Table on Market opportunity by Product (thousand t)
8 Customer Landscape
- 8.1 Customer landscape overview
- Exhibit 74: Analysis of price sensitivity, lifecycle, customer purchase basket, adoption rates, and purchase criteria
9 Geographic Landscape
- 9.1 Geographic segmentation
- Exhibit 75: Chart on Market share by geography 2022-2027 (%)
- Exhibit 76: Data Table on Market share by geography 2022-2027 (%)
- 9.2 Geographic comparison
- Exhibit 77: Chart on Geographic comparison
- Exhibit 78: Data Table on Geographic comparison
- 9.3 APAC – Market size and forecast 2022-2027
- Exhibit 79: Chart on APAC – Market size and forecast 2022-2027 (thousand t)
- Exhibit 80: Data Table on APAC – Market size and forecast 2022-2027 (thousand t)
- Exhibit 81: Chart on APAC – Year-over-year growth 2022-2027 (%)
- Exhibit 82: Data Table on APAC – Year-over-year growth 2022-2027 (%)
- 9.4 North America – Market size and forecast 2022-2027
- Exhibit 83: Chart on North America – Market size and forecast 2022-2027 (thousand t)
- Exhibit 84: Data Table on North America – Market size and forecast 2022-2027 (thousand t)
- Exhibit 85: Chart on North America – Year-over-year growth 2022-2027 (%)
- Exhibit 86: Data Table on North America – Year-over-year growth 2022-2027 (%)
- 9.5 Europe – Market size and forecast 2022-2027
- Exhibit 87: Chart on Europe – Market size and forecast 2022-2027 (thousand t)
- Exhibit 88: Data Table on Europe – Market size and forecast 2022-2027 (thousand t)
- Exhibit 89: Chart on Europe – Year-over-year growth 2022-2027 (%)
- Exhibit 90: Data Table on Europe – Year-over-year growth 2022-2027 (%)
- 9.6 South America – Market size and forecast 2022-2027
- Exhibit 91: Chart on South America – Market size and forecast 2022-2027 (thousand t)
- Exhibit 92: Data Table on South America – Market size and forecast 2022-2027 (thousand t)
- Exhibit 93: Chart on South America – Year-over-year growth 2022-2027 (%)
- Exhibit 94: Data Table on South America – Year-over-year growth 2022-2027 (%)
- 9.7 Middle East and Africa – Market size and forecast 2022-2027
- Exhibit 95: Chart on Middle East and Africa – Market size and forecast 2022-2027 (thousand t)
- Exhibit 96: Data Table on Middle East and Africa – Market size and forecast 2022-2027 (thousand t)
- Exhibit 97: Chart on Middle East and Africa – Year-over-year growth 2022-2027 (%)
- Exhibit 98: Data Table on Middle East and Africa – Year-over-year growth 2022-2027 (%)
- 9.8 China – Market size and forecast 2022-2027
- Exhibit 99: Chart on China – Market size and forecast 2022-2027 (thousand t)
- Exhibit 100: Data Table on China – Market size and forecast 2022-2027 (thousand t)
- Exhibit 101: Chart on China – Year-over-year growth 2022-2027 (%)
- Exhibit 102: Data Table on China – Year-over-year growth 2022-2027 (%)
- 9.9 US – Market size and forecast 2022-2027
- Exhibit 103: Chart on US – Market size and forecast 2022-2027 (thousand t)
- Exhibit 104: Data Table on US – Market size and forecast 2022-2027 (thousand t)
- Exhibit 105: Chart on US – Year-over-year growth 2022-2027 (%)
- Exhibit 106: Data Table on US – Year-over-year growth 2022-2027 (%)
- 9.10 Japan – Market size and forecast 2022-2027
- Exhibit 107: Chart on Japan – Market size and forecast 2022-2027 (thousand t)
- Exhibit 108: Data Table on Japan – Market size and forecast 2022-2027 (thousand t)
- Exhibit 109: Chart on Japan – Year-over-year growth 2022-2027 (%)
- Exhibit 110: Data Table on Japan – Year-over-year growth 2022-2027 (%)
- 9.11 South Korea – Market size and forecast 2022-2027
- Exhibit 111: Chart on South Korea – Market size and forecast 2022-2027 (thousand t)
- Exhibit 112: Data Table on South Korea – Market size and forecast 2022-2027 (thousand t)
- Exhibit 113: Chart on South Korea – Year-over-year growth 2022-2027 (%)
- Exhibit 114: Data Table on South Korea – Year-over-year growth 2022-2027 (%)
- 9.12 Germany – Market size and forecast 2022-2027
- Exhibit 115: Chart on Germany – Market size and forecast 2022-2027 (thousand t)
- Exhibit 116: Data Table on Germany – Market size and forecast 2022-2027 (thousand t)
- Exhibit 117: Chart on Germany – Year-over-year growth 2022-2027 (%)
- Exhibit 118: Data Table on Germany – Year-over-year growth 2022-2027 (%)
- 9.13 Market opportunity by geography
- Exhibit 119: Market opportunity by geography (thousand t)
- Exhibit 120: Market opportunity by geography (thousand t) – Volume
10 Drivers, Challenges, and Trends
- 10.1 Market drivers
- 10.2 Market challenges
- 10.3 Impact of drivers and challenges
- Exhibit 121: Impact of drivers and challenges in 2022 and 2027
- 10.4 Market trends
11 Vendor Landscape
- 11.1 Overview
- 11.2 Vendor landscape
- Exhibit 122: Overview on Criticality of inputs and Factors of differentiation
- 11.3 Landscape disruption
- Exhibit 123: Overview on factors of disruption
- 11.4 Industry risks
- Exhibit 124: Impact of key risks on business
12 Vendor Analysis
- 12.1 Vendors covered
- Exhibit 125: Vendors covered
- 12.2 Market positioning of vendors
- Exhibit 126: Matrix on vendor position and classification
- 12.3 Albemarle Corp.
- Exhibit 127: Albemarle Corp. – Overview
- Exhibit 128: Albemarle Corp. – Business segments
- Exhibit 129: Albemarle Corp. – Key news
- Exhibit 130: Albemarle Corp. – Key offerings
- Exhibit 131: Albemarle Corp. – Segment focus
- 12.4 Avalon Advanced Materials Inc.
- Exhibit 132: Avalon Advanced Materials Inc. – Overview
- Exhibit 133: Avalon Advanced Materials Inc. – Product / Service
- Exhibit 134: Avalon Advanced Materials Inc. – Key offerings
- 12.5 Critical Elements Lithium Corp.
- Exhibit 135: Critical Elements Lithium Corp. – Overview
- Exhibit 136: Critical Elements Lithium Corp. – Product / Service
- Exhibit 137: Critical Elements Lithium Corp. – Key offerings
- 12.6 Ganfeng Lithium Co. Ltd.
- Exhibit 138: Ganfeng Lithium Co. Ltd. – Overview
- Exhibit 139: Ganfeng Lithium Co. Ltd. – Business segments
- Exhibit 140: Ganfeng Lithium Co. Ltd. – Key offerings
- Exhibit 141: Ganfeng Lithium Co. Ltd. – Segment focus
- 12.7 IGO Ltd.
- Exhibit 142: IGO Ltd. – Overview
- Exhibit 143: IGO Ltd. – Product / Service
- Exhibit 144: IGO Ltd. – Key offerings
- 12.8 Lithium Americas Corp.
- Exhibit 145: Lithium Americas Corp. – Overview
- Exhibit 146: Lithium Americas Corp. – Business segments
- Exhibit 147: Lithium Americas Corp. – Key offerings
- Exhibit 148: Lithium Americas Corp. – Segment focus
- 12.9 Lithium Australia Ltd.
- Exhibit 149: Lithium Australia Ltd. – Overview
- Exhibit 150: Lithium Australia Ltd. – Product / Service
- Exhibit 151: Lithium Australia Ltd. – Key news
- Exhibit 152: Lithium Australia Ltd. – Key offerings
- 12.10 Livent Corp.
- Exhibit 153: Livent Corp. – Overview
- Exhibit 154: Livent Corp. – Product / Service
- Exhibit 155: Livent Corp. – Key offerings
- 12.11 MGX Minerals Inc.
- Exhibit 156: MGX Minerals Inc. – Overview
- Exhibit 157: MGX Minerals Inc. – Product / Service
- Exhibit 158: MGX Minerals Inc. – Key offerings
- 12.12 Nemaska Lithium Inc.
- Exhibit 159: Nemaska Lithium Inc. – Overview
- Exhibit 160: Nemaska Lithium Inc. – Product / Service
- Exhibit 161: Nemaska Lithium Inc. – Key offerings
- 12.13 Orocobre Ltd.
- Exhibit 162: Orocobre Ltd. – Overview
- Exhibit 163: Orocobre Ltd. – Business segments
- Exhibit 164: Orocobre Ltd. – Key offerings
- Exhibit 165: Orocobre Ltd. – Segment focus
- 12.14 Pilbara Minerals Ltd.
- Exhibit 166: Pilbara Minerals Ltd. – Overview
- Exhibit 167: Pilbara Minerals Ltd. – Product / Service
- Exhibit 168: Pilbara Minerals Ltd. – Key offerings
- 12.15 Pluspetrol Resources Corporation B.V.
- Exhibit 169: Pluspetrol Resources Corporation B.V. – Overview
- Exhibit 170: Pluspetrol Resources Corporation B.V. – Product / Service
- Exhibit 171: Pluspetrol Resources Corporation B.V. – Key offerings
- 12.16 Shanghai Oujin Lithium Industrial Co. Ltd.
- Exhibit 172: Shanghai Oujin Lithium Industrial Co. Ltd. – Overview
- Exhibit 173: Shanghai Oujin Lithium Industrial Co. Ltd. – Product / Service
- Exhibit 174: Shanghai Oujin Lithium Industrial Co. Ltd. – Key offerings
- 12.17 Tianqi Lithium Corp.
- Exhibit 175: Tianqi Lithium Corp. – Overview
- Exhibit 176: Tianqi Lithium Corp. – Product / Service
- Exhibit 177: Tianqi Lithium Corp. – Key offerings
13 Appendix
- 13.1 Scope of the report
- 13.2 Inclusions and exclusions checklist
- Exhibit 178: Inclusions checklist
- Exhibit 179: Exclusions checklist
- 13.3 Currency conversion rates for USUSD
- Exhibit 180: Currency conversion rates for USUSD
- 13.4 Research methodology
- Exhibit 181: Research methodology
- Exhibit 182: Validation techniques employed for market sizing
- Exhibit 183: Information sources
- 13.5 List of abbreviations
- Exhibit 184: List of abbreviations
About Us
Technavio is a leading global technology research and advisory company. Their research and analysis focuses on emerging market trends and provides actionable insights to help businesses identify market opportunities and develop effective strategies to optimize their market positions. With over 500 specialized analysts, Technavio’s report library consists of more than 17,000 reports and counting, covering 800 technologies, spanning across 50 countries. Their client base consists of enterprises of all sizes, including more than 100 Fortune 500 companies. This growing client base relies on Technavio’s comprehensive coverage, extensive research, and actionable market insights to identify opportunities in existing and potential markets and assess their competitive positions within changing market scenarios.
Contact
Technavio Research
Jesse Maida
Media & Marketing Executive
US: +1 844 364 1100
UK: +44 203 893 3200
Email: [email protected]
Website: www.technavio.com/

View original content to download multimedia:https://www.prnewswire.com/news-releases/lithium-market-to-grow-by-24-38-in-2023–albemarle-corp-and-avalon-advanced-materials-inc-emerge-as-a-key-contributers-to-growth-technavio-301902138.html
SOURCE Technavio
tsx-avl
avalon-advanced-materials-inc
avalon advanced materials inc
tsx-lac
lithium-americas-corp
lithium americas corp
cse-xmg
mgx-minerals-inc
mgx minerals inc
press-release


Dolly Varden consolidates Big Bulk copper-gold porphyry by acquiring southern-portion claims – Richard Mills
2023.12.22
Dolly Varden Silver’s (TSXV:DV, OTCQX:DOLLF) stock price shot up 16 cents for a gain of 20% Thursday, after announcing a consolidation of…

GoldTalks: Going big on ASX-listed gold stocks
Aussie investors are spoiled for choice when it comes to listed goldies, says Kyle Rodda. Here are 3 blue chips … Read More
The post GoldTalks: Going…
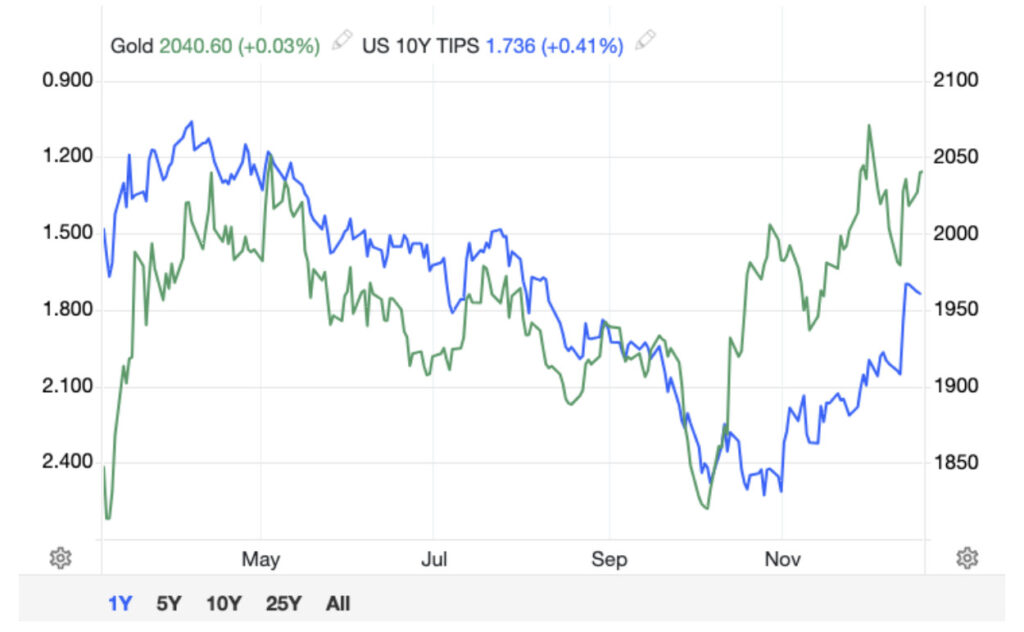
Gold Digger: ‘Assured growth’ – central bank buying spree set to drive gold higher in 2024
Central banks will drive the price of gold higher in 2024, believe various analysts Spot gold prices seem stable to … Read More
The post Gold Digger:…