Economics
Silver price chart may deceive bulls as the dollar’s weakness fades away
Precious metals rallied lately, fueled by a weak dollar and investors’ increasing fears of sticky inflation. Gold, for example, trades above $2000. But…

Precious metals rallied lately, fueled by a weak dollar and investors’ increasing fears of sticky inflation. Gold, for example, trades above $2000. But the silver price chart calls for caution, as bulls may be deceived by the dollar’s weakness which may fade away quickly.
Silver and gold trade in tandem, with gold leading the way up or down most of the time. Also known as the “poor man’s gold,” silver bullion ended March at $24.10, an absolute gain of $3.19 on the month or 15.24%.
Last month’s performance meant a lot for silver’s YTD performance, as it turned positive. Silver is up 0.6% YTD – not much, but enough to attract interest from bulls hyped on fears of sticky inflation. In comparison, gold ended the first quarter up by 7.96% YTD, triggering a lot of speculation that silver price has room to catch up.
Precious metals, as well as other commodities, are attractive to investors in periods of high inflation. This is because they offer a hedge against the rise in the price of goods and services but failed to do so when inflation reached more than four-decade high levels.
Is it now the time for a comeback rally?
According to the silver price chart, investors should be cautious at current levels as the dollar’s weakness may fade away. After all, the dollar’s weakness fueled the rally in precious metals.
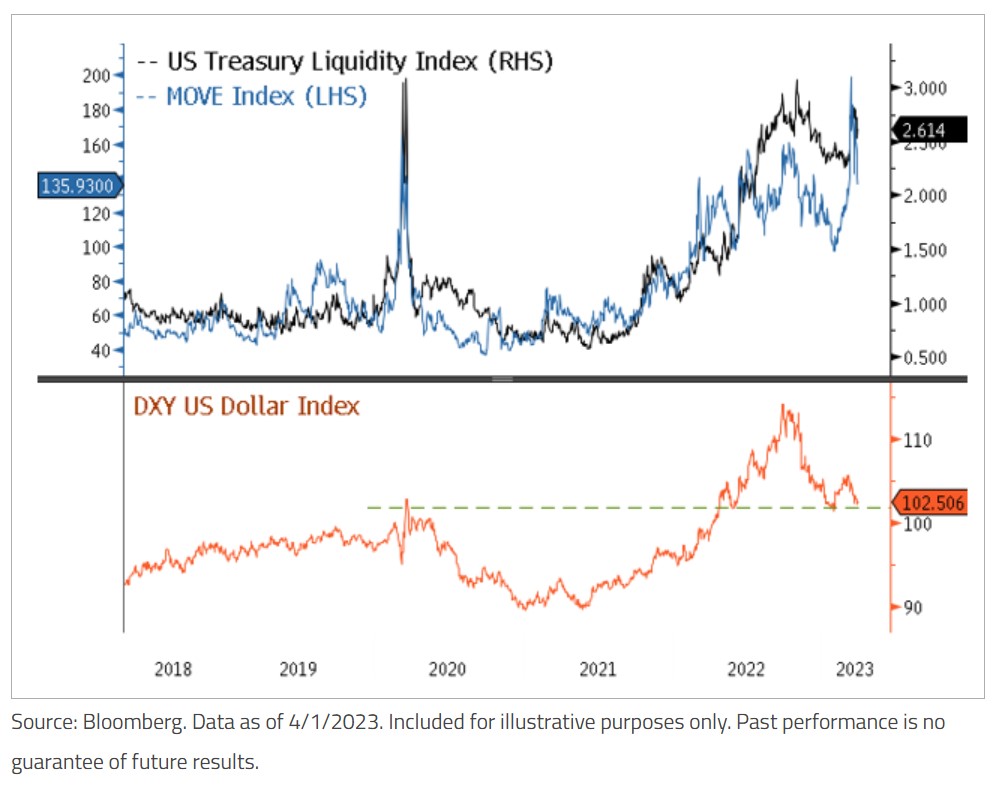
The US dollar index is back at a critical support level
The dollar weakness was a theme in 2023, as reflected by the dollar index. It dropped from what appears to be a significant top.
But on its way down, it met significant support – one that offered strong resistance in the past.
Therefore, the 100 level should support the dollar moving forward. Hence, being long silver and hold here is risky because the dollar’s weakness was the one that fueled the recent rally.
Silver price chart favors a pullback
The technical picture shows a double top in 2021 and then a pullback. The rally in 2023 from the $20 area is nothing short of impressive, but it could be explained simply by investors betting that the gap between gold and silver’s YTD performance will shrink.
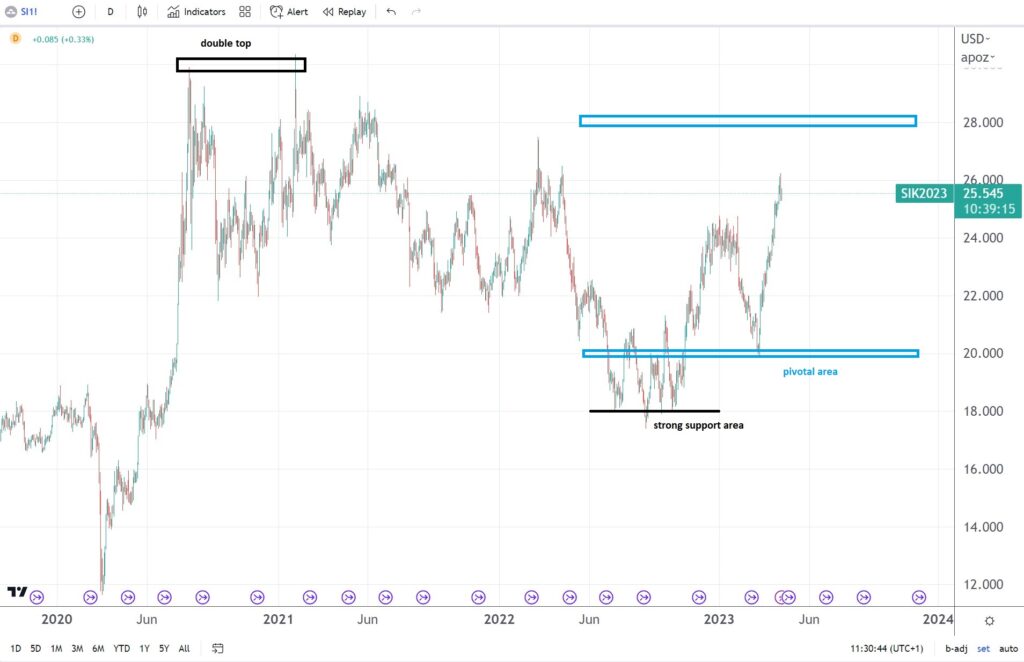
To sum up, unless the silver price moves above $28, the odds favor a move back to the critical $20 pivotal area. That is especially possible if the DXY bounces from support.
The post Silver price chart may deceive bulls as the dollar’s weakness fades away appeared first on Invezz.
dollar
gold
silver
inflation
commodities
metals
us dollar
precious metals


Argentina Is One of the Most Regulated Countries in the World
In the coming days and weeks, we can expect further, far‐reaching reform proposals that will go through the Argentine congress.

Crypto, Crude, & Crap Stocks Rally As Yield Curve Steepens, Rate-Cut Hopes Soar
Crypto, Crude, & Crap Stocks Rally As Yield Curve Steepens, Rate-Cut Hopes Soar
A weird week of macro data – strong jobless claims but…

Fed Pivot: A Blend of Confidence and Folly
Fed Pivot: Charting a New Course in Economic Strategy Dec 22, 2023 Introduction In the dynamic world of economics, the Federal Reserve, the central bank…
