Financing News
Thor Explorations Announces First Quarter 2023 Financial and Operating Results, for the Three Months Ending March 31, 2023
Vancouver, British Columbia–(Newsfile Corp. – May 30, 2023) – Thor Explorations Ltd. (TSXV: THX) (AIM: THX) ("Thor Explorations", "Thor" or the "Company")…
Vancouver, British Columbia–(Newsfile Corp. – May 30, 2023) – Thor Explorations Ltd. (TSXV: THX) (AIM: THX) (“Thor Explorations”, “Thor” or the “Company”) is pleased to provide an operational and financial review for its Segilola Gold mine, located in Nigeria (“Segilola”), and for the Company’s mineral exploration properties located in Nigeria and Senegal for the three months to March 31, 2023 (“Q1 2023” or the “Period”).
The Company’s Unaudited Consolidated Financial Statements together with the notes related thereto, as well as the Management’s Discussion and Analysis for the three months ended March 31, 2023, are available on Thor Explorations’ website at https://thorexpl.com/investors/financials/.
All figures are in US dollars (“US$”) unless otherwise stated.
Operational Highlights
Segilola Production
- Gold production for the Period totaled 20,629 ounces (“oz”)
- Mill feed grade was 2.95 grammes per tonne (“g/t”) gold with recovery at 94.1%
- An increase in mining rates and the mining of higher grade ore zones is expected in Q2 2023
- The main operating units of the process plant continue to perform better than expected, with the plant operating above nameplate capacity
Segilola Near-Mine Exploration
- Identification of new high grade quartz vein system within 15 kilometers (“km”) of Segilola, with multiple high grade drillhole intercepts including 1 meter (“m”) at 310 g/t gold which equates to 10 oz of gold per tonne
- Ongoing drilling will test both the strike length and depth potential of this system with additional drill results expected in Q2 2023
Regional exploration is continuing with ongoing drilling programs, stream sediment sampling programs and soil/auger programs with drilling results also expected in Q2 2023.
Douta
- Mineral Resource Estimate (“MRE”) at Douta supported by a total of 64,567 meters of drilling updated to a global resource of approximately 1.78 million oz of gold, an increase of 144% from its maiden resource.
- Updated Douta Resource encompasses the Makosa, Makosa Tail and the recently discovered Sambara prospects, all of which remain open along strike and down dip
- During the Period, workstreams designed to advance the project to the prefeasibility stage (“PFS”) commenced including metallurgical and geotechnical drilling and also infill resource drilling. Drilling results from Douta are also expected in Q2 2023.
Financial Highlights
- 21,553 oz of gold sold with an average gold price of US$1,902 per oz
- Cash operating cost of US$899 per oz sold and all-in sustaining cost (“AISC”) of US$1,346 per oz sold
- Q1 2023 revenue of US$40.3 million (Q1 2022: US$24.9 million)
- Q1 2023 EBITDA of US$16.1 million (Q1 2022: US$13.4 million)
- Q1 2023 net profit of US$4.3 million (Q1 2022: US$3.5 million)
- Cash and cash equivalents of US$4.5 million as at 31 March 2023 (Q1 2022: US$6.3 million)
- Senior debt facility with Africa Finance Corporation amended and restated to facilitate the Company’s growth opportunities
- Senior debt facility reduced to US$27.9 million as at 31 March 2023
- Repayment of all outstanding EPC invoices
- Net debt of US$25 million as at 31 March 2023
Environment, Social and Governance
- The full operation of 6 MW compressed natural gas (“CNG”) generators was achieved in January 2023 so as to reduce GHG generated by diesel
- In Q1 2023, the Company’s GHG emissions were 5,303 tons. For the equivalent period in 2022, the GHG emissions were 8,392 tons, a reduction of 3,089 tons representing a drop of 36% in GHG emissions and a significant step in the reduction of its carbon footprint
- Vegetable farm construction commenced in the Period, including the erection of a greenhouse. Construction of fish farming ponds and associated processing and administration structures also commenced using two contractors from the host communities
Outlook
- Production guidance of 85,000 to 95,000 oz for 2023 maintained, weighted towards the second half of the year, with an AISC guidance of US$1,150 to US$1,350 per oz
- Advance exploration programs across the portfolio, including near mine and underground projects at Segilola, extension and infill programs at Douta and the assessment of potential targets in Nigeria
- Completion of the Douta preliminary feasibility study (“PFS”) in Q4 2023
- Applications for and acquisition of identified prospective exploration properties in Nigeria
Segun Lawson, President & CEO, stated:
“This was envisaged to be a difficult quarter with a lower mined grade, difficult mining conditions in the Segilola Pit west wall and a higher utilization of heavy equipment. The Company’s performance during the period demonstrates the amount of progress we have made at Segilola. The main operating units continue to perform better than expected and operate above capacity, so our production at the mine totaled 20,629 ounces. Our costs were at the higher end of our guidance, however we expect our costs to reduce materially in the second half of the year as we complete our mining in the current difficult areas. We have also had our first significant exploration success outside the Segilola Mine footprint, identifying a new high grade quartz vein system within 15 kilometres of mine and have already begun expanding exploration with multiple drillhole intercepts. We look forward to updating the market with drill results from this program and an additional two ongoing exploration drilling programs in Nigeria.
“We also continue to progress exploration at a fast pace at the Douta Project. Further to the significant growth in the MRE we are excited about the upcoming drilling results from the ongoing exploration program. We also look forward to completing the various PFS work streams in the coming months.
“As always, we have remained committed to our ESG goals, and this Period really reflects our ability to safeguard the environment and the local communities. The full operation of 6MW compressed natural gas generators was achieved in January and will greatly aid in our attempt to reduce GHG emissions. Elsewhere, we have been proudly progressing our livelihood restoration program and we look forward to offering further updates on all things ESG related throughout the year.
“When compared to the same operating period last year, we have significantly improved our numbers across the board, which is a testament to the hard work and efficiencies created in the Company.
“Our production guidance remains between 85,000 and 95,000 oz for 2023, one that is weighted towards the second half of the year, where we foresee less difficult operating conditions and correspondingly, a more efficient six months operationally.”
About Thor Explorations
Thor Explorations Ltd. is a mineral exploration company engaged in the acquisition, exploration, development and production of mineral properties located in Nigeria, Senegal and Burkina Faso. Thor Explorations holds a 100% interest in the Segilola Gold Project located in Osun State, Nigeria and has a 70% economic interest in the Douta Gold Project located in south-eastern Senegal. Thor Explorations trades on AIM and the TSX Venture Exchange under the symbol “THX”.
THOR EXPLORATIONS LTD.
Segun Lawson
President & CEO
For further information please contact:
Thor Explorations Ltd
Email: [email protected]
Canaccord Genuity (Nominated Adviser & Broker)
Henry Fitzgerald-O’Connor / James Asensio / Thomas Diehl
Tel: +44 (0) 20 7523 8000
Hannam & Partners (Broker)
Andrew Chubb / Matt Hasson / Jay Ashfield / Franck Nganou
Tel: +44 (0) 20 7907 8500
Fig House Communications (Investor Relations)
Tel: +1 416 822 6483
Email: [email protected]
Ibu Lawson (Investor Relations)
Tel: +447909825446
Email: [email protected]
BlytheRay (Financial PR)
Tim Blythe / Megan Ray / Said Izagaren
Tel: +44 207 138 3203
Management Discussion & Analysis for Q1 2023
HIGHLIGHTS AND ACTIVITIES – FIRST QUARTER 2023
Operating results for the quarter were highlighted by the selling of 21,553 ounces (“oz”) of gold during the year at a cash operating cost1 of $899 per oz sold, with an AISC1 of $1,346 per oz sold.
The Company maintains its production guidance at 85,000 to 95,000 oz for the year, while AISC1 guidance for 2023 is also maintained at US$1,150 per ounce to US$1,350 per ounce.
During the Period, the international price of key consumables used by the Company, in particular ammonium nitrate and diesel have reduced significantly from the levels experienced in the second half of 2022. These reductions in price are expected to result in lower than forecast consumable costs at Segilola as the Company resupplies.
Table 1.1 Key Operating and Financial Statistics
| Operating | Three Month period ended March 31, 2023 |
Three Month period ended March 31, 2022 |
|||||
| Gold Sold | Au | 21,553 | 13,463 | ||||
| Average realized gold price1 | $/oz | 1,902 | 1,824 | ||||
| Cash operating cost1 | $/oz | 899 | 688 | ||||
| AISC (all-in sustaining cost)1 | $/oz | 1,346 | 1,108 | ||||
| EBITDA1 | $/oz | 745 | 996 |
| Financial | Three Month period ended March 31, 2023 |
Three Month period ended March 31, 2022 |
|||||
| Revenue | $ | 40,287,830 | 24,865,482 | ||||
| Net Income/(Loss) | $ | 4,331,347 | 3,490,938 | ||||
| EBITDA1 | $ | 16,065,334 | 13,414,642 |
| Financial | Three Month period ended March 31, 2023 | Year ended December 31, 2022 |
|||||
| Cash and cash equivalents | $ | 4,505,071 | 6,688,037 | ||||
| Deferred Income | $ | – | 6,581,743 | ||||
| Net Debt1 | $ | 24,940,762 | 31,650,722 |
1 Refer to “Non-IFRS Measures” section.
Segilola Gold Mine, Nigeria
Mining
During the three months ended March 31, 2023, 4,194,689 tonnes of material was mined, equivalent to a mining rate of 46,608 tonnes of material per day. In this period, 198,425 tonnes of ore were mined, equivalent to mining rates of 2,205 tonnes of ore per day, at an average grade of 2.85g/t. Tonnes were affected by difficult mining conditions encountered in the West wall of the pit. Conditions are improving and an increase in mining rates is expected in the second quarter of 2023.
Grade was lower than planned due to geotechnical problems encountered in the North of the pit, delaying access to the higher-grade ore zones in this area. These zones will now be mined during the second quarter of 2023.
The stockpile balance at the end of the period was 270,215 tonnes of ore at an average of 1.14g/t. This comprised 2,130 tonnes (4.35g/t) at high grade, 4,327 tonnes (2.03g/t) at medium grade, 273,903 tonnes (1.04g/t) at low grade and 3,442 tonnes (2.65g/t) on the coarse ore stockpile.
Processing
During the three months ended March 31, 2023, a total of 231,001 tonnes of ore, equivalent to a throughput rate of 2,567 tonnes per day, was processed. Throughput was affected by an unplanned reline of the SAG mill.
The mill feed grade was 2.95g/t gold with recovery at 94.1% for a total of 20,629 ounces of gold produced. A delay in the commissioning of an additional crusher, specifically used to reduce mill rejected ore bearing material (“scats”), which was held for several weeks at the Nigerian border crossing, affected grade during the quarter. The scats will be processed during quarter 2.
All of the main operating units of the process plant continue to perform better than expected, with the plant operating above nameplate capacity. Several improvement projects are being undertaken through the remainder of 2023.
Table 1.2: Production Metrics
| Units | Q1 – 2023 | Q4 – 2022 | Q3 – 2022 | Q2 – 2022 | Q1 – 2022 | |||||||||||
| Mining | ||||||||||||||||
| Total Mined | Tonnes | 4,194,689 | 4,296,494 | 4,018,431 | 4,031,584 | 3,759,524 | ||||||||||
| Waste Mined | Tonnes | 3,996,264 | 3,974,073 | 3,793,249 | 3,747,504 | 3,533,610 | ||||||||||
| Ore Mined | Tonnes | 198,425 | 322,421 | 225,182 | 284,079 | 226,314 | ||||||||||
| Grade | g/t Au | 2.85 | 3.51 | 4.43 | 3.63 | 2.68 | ||||||||||
| Daily Total Mining Rate | Tonnes/Day | 46,608 | 46,701 | 43,679 | 44,303 | 41,772 | ||||||||||
| Daily Ore Mining Rate | Tonnes/Day | 2,205 | 3,505 | 2,448 | 3,122 | 2,515 | ||||||||||
| Stockpile | ||||||||||||||||
| Ore Stockpiled | Tonnes | 270,215 | 300,531 | 229,909 | 249,281 | 179,758 | ||||||||||
| Ore Stockpiled | g/t Au | 1.14 | 1.48 | 1.19 | 1.46 | 1.23 | ||||||||||
| Ore Stockpiled | oz | 9,904 | 14,300 | 8,796 | 11,701 | 7,109 | ||||||||||
| Processing | ||||||||||||||||
| Ore Processed | Tonnes | 231,001 | 254,824 | 241,434 | 211,582 | 221,900 | ||||||||||
| Grade | g/t Au | 2.95 | 3.38 | 3.58 | 3.66 | 3.18 | ||||||||||
| Recovery | % | 94.1 | 95.0 | 95.5 | 95.5 | 94.1 | ||||||||||
| Gold Recovered | oz | 20,629 | 26,331 | 26,523 | 23,785 | 21,343 | ||||||||||
| Milling Throughput | Tonnes/Day | 2,567 | 2,770 | 2,624 | 2,325 | 2,466 |
NON-IFRS MEASURES
This MD&A refers to certain financial measures, such as average realized gold price, cash operating costs, all-in sustaining costs , net debt and EBITDA which are not recognized under IFRS and do not have a standardized meaning prescribed by IFRS. These measures may differ from those made by other companies and accordingly may not be comparable to such measures as reported by other companies. These measures have been derived from the Company’s financial statements because the Company believes that, with the achievement of gold production, they are of assistance in the understanding of the results of operations and its financial position.
Average realised gold price per ounce sold
The Group believes that, in addition to conventional measures prepared in accordance with GAAP, the average realised gold price, which takes into account the impact of gain/losses on forward sale of commodity contracts, is a metric used to better understand the gold price realised during a period. Management believes that reflecting the impact of these contracts on the Group’s realised gold price is a relevant measure and increases the consistency of this calculation with our peer companies.
In addition to the above, in calculating the realised gold price, management has adjusted the revenues as disclosed in the consolidated financial statement to exclude by product revenue, relating to silver revenue, and has reflected the by product revenue as a credit to cash operating costs. The revenues as disclosed in the interim financial statements have been reconciled to the gold revenue for all periods presented.
Table 2.1: Average annual realised price per ounce sold
| Units | Three Month period ended March 31, 2023 |
Three Month period ended March 31, 20221 |
||||||||||
| Revenues | $ | 40,287,830 | 24,865,482 | |||||||||
| By product revenue | $ | (43,773) | (15,520) | |||||||||
| Gold Revenue | $ | 40,244,057 | 24,849,962 | |||||||||
| Gain/(Loss) on forward sale of commodity contracts | $ | 750,482 | (294,922) | |||||||||
| Gold Revenue | $ | 40,994,539 | 24,555,040 | |||||||||
| Gold ounces sold | oz Au | 21,553 | 13,463 | |||||||||
| Average realized price per ounce sold | $ | 1,902 | 1,824 | |||||||||
1 The figures for the Three Month period ended March 31, 2022 have been restated in connection with the restatement of the interim financial statements. Refer to note 22 of the interim financial statements for further details.
Cash operating cost per ounce
Cash operating cost per oz sold, combined with revenues, can be used to evaluate the Company’s performance and ability to generate operating income and cash flow from operating activities. The Company believes that, in addition to conventional measures prepared in accordance with GAAP, certain investors may find this information useful to evaluate the costs of production per ounce.
By product revenues are included as a credit to cash operating costs.
Table 2.2: Average annual cash operating cost per ounce of gold
| Units | Three Month period ended March 31, 2023 |
Three Month period ended March 31, 20221 |
|||||
| Production costs | $ | 18,306,502 | 8,219,530 | ||||
| Transportation and refining | $ | 342,291 | 502,222 | ||||
| Royalties | $ | 768,282 | 550,765 | ||||
| By product revenue | $ | (43,773) | (15,520) | ||||
| Cash Operating costs | $ | 19,373,302 | 9,256,997 | ||||
| Gold ounces sold | Oz Au | 21,553 | 13,463 | ||||
| Cash operating cost per ounce sold | $/oz | 899 | 688 |
1 The figures for the Three Month period ended March 31, 2022 have been restated in connection with the restatement of the interim financial statements. Refer to note 22 of the interim financial statements for further detail s.
All-in sustaining cost per ounce
AISC provides information on the total cost associated with producing gold.
The Group calculates AISC as the sum of total cash operating costs (as described above), other administration expenses and sustaining capital, all divided by the gold ounces sold to arrive at a per oz amount.
Other administration expenses includes administration expenses directly attributable to the Segilola Gold Mine plus a percentage of corporate administration costs allocated to supporting the operations of the Segilola Gold Mine. For the Three Month periods ended March 31, 2023 and 2022, this was deemed to be 50%.
Other companies may calculate this measure differently as a result of differences in underlying principles and policies applied.
Table 2.3: Average annual all-in sustaining cost per ounce of gold
| Units | Three Month period ended March 31, 2023 |
Three Month period ended March 31, 20221 |
|||||
| Cash operating costs2 | $ | 19,373,302 | 9,256,997 | ||||
| Adjusted other administration expenses | $ | 3,775,777 | 1,458,731 | ||||
| Sustaining capital3 | $ | 5,864,894 | 4,196,996 | ||||
| Total all-in sustaining cost | $ | 29,013,973 | 14,912,724 | ||||
| Gold ounces sold | Oz Au | 21,553 | 13,463 | ||||
| All-in sustaining cost per ounce sold | $/oz | 1,346 | 1,108 |
1 The figures for the Three Month period ended March 31, 2022 have been restated in connection with the restatement of the interim financial statements. Refer to note 22 of the interim financial statements for further details.
2 Refer to Table – 3.2 Cash operating costs.
3 Refer to Table – 3.3a Sustaining and Non-Sustaining Capital
The Group’s all-in sustaining costs include sustaining capital expenditures which management has defined as those capital expenditures related to producing and selling gold from its on-going mine operations. Non-sustaining capital is capital expenditure related to major projects or expansions at existing operations where management believes that these projects will materially benefit the operations. The distinction between sustaining and non-sustaining capital is based on the Company’s policies and refers to the definitions set out by the World Gold Council.
This non-GAAP measure provides investors with transparency regarding the capital costs required to support the on-going operations at its operating mine, relative to its total capital expenditures. Readers should be aware that these measures do not have a standardized meaning. It is intended to provide additional information and should not be considered in isolation, or as a substitute for measures of performance prepared in accordance with IFRS.
Table 2.3a: Sustaining and Non-Sustaining Capital
| Units | Three Month period ended March 31, 2023 |
Three Month period ended March 31, 20221 |
|||||
| Property, plant and equipment additions during the period | $ | 5,719,158 | 8,484,914 | ||||
| Non-sustaining capital expenditures2 | $ | (1,109,993) | (5,501,596) | ||||
| Payment for sustaining leases | $ | 1,255,729 | 1,213,678 | ||||
| Sustaining capital3 | $ | 5,864,894 | 4,196,996 |
1 The figures for the Three Month period ended March 31, 2022 have been restated in connection with the restatement of the interim financial statements. Refer to note 22 of the interim financial statements for further details.
2 Includes EPC and other construction costs for the Segilola Mine
3 Includes capitalized production stripping costs of $4,609,165 (March 31, 2022: $2,983,318)
Net Debt
Net debt is calculated as total debt adjusted for unamortized deferred financing charges less cash and cash equivalents and short-term investments at the end of the reporting period. This measure is used by management to measure the Company’s debt leverage. The Group considers that in addition to conventional measures prepared in accordance with IFRS, net debt is useful to evaluate the Group’s performance.
Table 2.4: Net Debt
| Three Month period ended March 31, 2023 |
Year Ended December 31, 2022 |
||||||
| Loans from the Africa Finance Corporation | $ | 24,257,746 | 24,459,939 | ||||
| Due to EPC contractor | $ | 1,463,353 | 10,196,105 | ||||
| Deferred element of EPC contract | $ | 3,724,734 | 3,682,715 | ||||
| Less: | |||||||
| Cash | (4,505,071) | (6,688,037) | |||||
| Net Debt | $ | 24,940,762 | 31,650,722 |
Earnings Before Interest, Taxes, Depreciation and Amortisation (EBITDA)
EBITDA is calculated as the total earnings before interest, taxes, depreciation and amortisation. This measure helps management assess the operating performance of each operating unit.
Table 2.5: Earnings Before Interest, Tax, Depreciation and Amortization (EBITDA)
| Units | Three Month period ended March 31, 2023 |
Three Month period ended March 31, 20221 |
|||||
| Net profit/(loss) for the period | $ | 4,331,347 | 3,490,938 | ||||
| Amortization and depreciation – owned assets | $ | 7,165,523 | 5,004,617 | ||||
| Amortization and depreciation – right of use assets | $ | 1,194,587 | 1,158,255 | ||||
| Impairment of Exploration & Evaluation assets | $ | 3,096 | 2,701 | ||||
| Interest expense | $ | 3,370,781 | 3,758,131 | ||||
| EBITDA | $ | 16,065,334 | 13,414,642 | ||||
| Gold ounces sold | Oz Au | 21,553 | 13,463 | ||||
| EBITDA per ounce sold | $/oz | 745 | 996 |
1 The figures for the Three Month period ended March 31, 2022 have been restated in connection with the restatement of the interim financial statements. Refer to note 22 of the interim financial statements for further details.
OUTLOOK AND UPCOMING MILESTONES
This Section 5 of the MD&A contains forward looking information as defined by National Instrument 51-102. Refer to Section 16 of this MD&A for further information on forward looking statements.
We are focused on advancing the Company’s strategic objectives and near-term milestones which include:
- 2023 Operational Guidance and Outlook
| Gold Production | oz | 85,000-95,000 |
| All-in Sustaining Cost | US$/oz Au sold | $1,150 – $1,350 |
| Capital Expenditure1 | US$ | 8,000,000 – 10,000,000 |
| Exploration Expenditure: | ||
| Nigeria2 | US$ | 4,200,000 |
| Senegal | US$ | 3,000,000 |
1 This excludes production stripping costs capitalizations.
2 This includes purchase of licenses.
-
The critical factors that influence whether Segilola can achieve these targets include:
-
Segilola’s ability to maintain an adequate supply of consumables (in particular ammonium nitrate, flux and cyanide) and equipment
-
Fluctuations in the price of key consumables, in particular ammonium nitrate, and diesel
-
Segilola’s workforce remaining healthy
-
Continuing to receive full and on-time payment for gold sales
-
Continuing to be able to make local and international payments in the ordinary course of business
-
-
Continue to advance the Douta project towards preliminary feasibility study (“PFS”)
-
Continue to advance exploration programmes across the portfolio:
-
Segilola near mine exploration
-
Segilola underground project
-
Segilola regional exploration programme
-
Douta extension programme
-
Douta infill programme
-
Assess regional potential targets in Nigeria
-
Acquiring new concessions and joint venture options on potential targets
-
SUMMARY OF QUARTERLY RESULTS
The table below sets forth selected results of operations for the Company’s eight most recently completed quarters.
Table 3.1: Summary of quarterly results
| $ | 2023 Q1 Mar 31 |
2022 Q4 Dec 31 |
2022 Q3 Sep 30 |
2022 Q2 Jun 30 |
||||||||
| Revenues | 40,287,830 | 43,251,204 | 55,703,098 | 41,354,747 | ||||||||
| Net profit for period | 4,331,347 | 14,908,460 | 4,126,066 | 6,163,942 | ||||||||
| Basic profit per share (cents) | 0.67 | 2.21 | 0.65 | 0.97 |
| $ | 2022 Q1 Mar 31 |
2021 Q4 Dec 31 |
2021 Q3 Sep 30 |
2021 Q2 Jun 30 |
||||||||
| Revenues | 24,865,482 | 6,049,485 | – | – | ||||||||
| Net profit/(loss) for period | 3,490,938 | 3,116,416 | 463,844 | (5,582,090) | ||||||||
| Basic profit/(loss) per share (cents) | 0.55 | 0.47 | 0.07 | (0.87) |
RESULTS FOR THREE MONTHS ENDED MARCH 31, 2023
The review of the results of operations should be read in conjunction with the Interim Financial Statements and notes thereto.
The Group reported a net profit of $4,331,347 (0.58 cents per share) for the three-month period ended March 31, 2023, as compared to a net profit of $3,490,938 (0.55 cents per share) for the three-month period ended March 31, 2022. The increase in profit for the period was largely due to:
- revenue during the period of $40,287,830 (Q1 2022: $24,865,482)
These were offset partially by:
- Amortization and depreciation of $8,360,110 (Q4 2021: $6,162,872);
- Interest of $3,370,781 (Q1 2022: $3,758,131); and
- Productions costs of $18,306,502 (Q1 2022: $8,219,530)
No interest was earned during the three-month period ended March 31, 2023, and 2022.
LIQUIDITY AND CAPITAL RESOURCES
As at March 31, 2023, the Group had cash of $4,505,688 (December 31 2022: $6,688,037) and a working capital deficit of $38,308,404 (December 31, 2022: deficit of $29,116,915).
The decrease in cash from December 31, 2022 is due mainly to cash generated in operations of $19,214,348 offset by cash used in investing and financing activities of $15,515,468 and $5,976,329, respectively.
The total EPC amount has been finalized with our EPC contractor, and we have paid all due outstanding EPC payments at the date of this report.
Working Capital Calculation
The Working Capital Calculation excludes $9,979,413 (2022: $10,187,630) of Gold Stream liabilities, and $805,801 (2022: $2,215,585) in third party royalties included in current accounts payable, that are contingent upon the achievement of the revised gold sales forecast of 85,000 to 95,000 ounces for the year ending December 31, 2023.
Included in working capital, in Accounts payable and accrued liabilities, is a balance of $1,463,353 (2022: $10,196,105) due to our EPC contractors. As of the date of this report, the Company has made all outstanding due payments in relation to the EPC contract.
Table 4.1: Working Capital
| March 31, 2023 | December 31, 2022 | ||||||
| Current Assets | |||||||
| Cash and Restricted Cash | $ | 4,505,071 | 6,688,037 | ||||
| Inventory | $ | 25,080,808 | 19,901,262 | ||||
| Amounts receivable, prepaid expenses, advances and deposits | $ | 8,461,572 | 10,697,365 | ||||
| Total Current Assets for Working Capital | $ | 38,047,451 | 37,286,664 | ||||
| Current Liabilities | |||||||
| Accounts Payable and accrued liabilities | $ | 60,555,348 | 56,337,289 | ||||
| Deferred Income | – | 6,581,743 | |||||
| Lease Liabilities | $ | 4,815,512 | 4,811,991 | ||||
| Gold Stream Liability | $ | 9,979,413 | 10,187,630 | ||||
| Loan and other borrowings | $ | 11,790,796 | 888,141 | ||||
| $ | 87,141,069 | 78,806,794 | |||||
| less: Current Liabilities contingent upon future gold sales | $ | (10,785,214) | (12,403,215) | ||||
| Working Capital Deficit | $ | (38,308,404) | (29,116,915) |
Inventory
Gold inventory is recognised in the ore stockpiles and in production inventory, comprised principally of ore stockpile and doré at site or in transit to the refinery, with a component of gold-in-circuit.
Table 4.2: Inventory
| March 31 2023 | December 31 2022 | ||||||
| Plant spares and consumables | $ | 9,146,279 | 4,751,922 | ||||
| Gold ore in stockpile | $ | 12,479,805 | 11,869,168 | ||||
| Gold in circuit | $ | 3,454,724 | 1,160,237 | ||||
| Gold dore | $ | – | 2,119,935 | ||||
| $ | 25,080,808 | 19,901,262 |
Liquidity and Capital Resources
The Group has generated positive operating cash flow during Q1 2023 and expects to continue to do so based on its production and AISC guidance. This operating cash flow will support debt repayments, regional exploration and underground expansion drilling at Segilola, planned capital expenditures and corporate overhead costs.
FINANCIAL INSTRUMENTS AND OTHER INSTRUMENTS
The Group’s financial instruments are classified as follows:
| March 31, 2023 | Measured at amortized cost | Measured at fair value through profit and loss | Total | |||||||||
| Assets | ||||||||||||
| Cash and cash equivalents | $ | 4,505,071 | – | 4,505,071 | ||||||||
| Amounts receivable | 240,009 | – | 240,009 | |||||||||
| Total assets | $ | 4,745,080 | – | 4,745,080 | ||||||||
| Liabilities | ||||||||||||
| Accounts payable and accrued liabilities | $ | 59,749,547 | 805,801 | 60,555,348 | ||||||||
| Loans and borrowings | 27,982,480 | – | 27,982,480 | |||||||||
| Gold stream liability | – | 23,507,987 | 23,507,987 | |||||||||
| Lease liabilities | 14,465,191 | – | 14,465,191 | |||||||||
| Total liabilities | $ | 102,197,218 | 24,313,788 | 126,511,006 | ||||||||
| December 31, 2022 | Measured at amortized cost | Measured at fair value through profit and loss | Total | |||||||||
| Assets | ||||||||||||
| Cash and cash equivalents | $ | 6,688,037 | – | 6,688,037 | ||||||||
| Amounts receivable | 220,442 | – | 220,442 | |||||||||
| Total assets | $ | 6,908,479 | – | 6,908,479 | ||||||||
| Liabilities | ||||||||||||
| Accounts payable and accrued liabilities | $ | 54,121,704 | 2,215,585 | 56,337,289 | ||||||||
| Loans and borrowings | 28,142,654 | – | 28,142,654 | |||||||||
| Gold stream liability | – | 25,039,765 | 25,039,765 | |||||||||
| Lease liabilities | 15,409,285 | – | 15,409,285 | |||||||||
| Total liabilities | $ | 97,673,643 | 27,255,350 | 124,928,993 | ||||||||
The fair value of these financial instruments approximates their carrying value.
As noted above, the Group has certain financial liabilities that are held at fair value. The fair value hierarchy establishes three levels to classify the inputs to valuation techniques to measure fair value:
Classification of financial assets and liabilities
Level 1 – quoted prices (unadjusted) in active markets for identical assets or liabilities;
Level 2 – inputs other than quoted prices included within level 1 that are observable for the asset or liability, either directly (that is, as prices) or indirectly (that is, derived from prices); and
Level 3 – inputs for the asset or liability that are not based on observable market data (that is, unobservable inputs).
As at March 31, 2023 and December 31, 2022, all the Group`s liabilities measured at fair value through profit and loss are categorized as Level 3 and their fair value was determined using discounted cash flow valuation models, taking into account assumptions with respect to gold prices and discount rates as well as estimates with respect to production and operating results for the Segilola mine.
DISCLOSURE OF OUTSTANDING SHARE DATA
As at the date of this MD&A, there were 644,696,185 common shares issued and outstanding stock options to purchase a total of 26,901,000 common shares.
Authorized Common Shares
Table 5.1: Common shares issued
| March 31, 2023 | December 31, 2022 | |||||
| Common shares issued | 644,696,185 | 644,696,185 |
Warrants
There were no warrants that were outstanding at March 31, 2023, and as at the date of this report.
During the quarter ended March 31, 2023, no warrants were issued.
Stock Options
The number of stock options that were outstanding and the remaining contractual lives of the options at March 31, 2023, were as follows.
Table 5.2: Options outstanding
| Exercise Price | Number Outstanding |
Weighted Average Remaining Contractual Life | Expiry Date |
| C$0.145 | 12,111,000 | 0.21 | June 15, 2023 |
| C$0.140 | 750,000 | 0.52 | October 5, 2023 |
| C$0.200 | 14,040,000 | 1.80 | January 16, 2025 |
| Total | 26,901,000 |
The Company has granted employees, consultants, directors and officers share purchase options. These options were granted pursuant to the Company’s stock option plan.
No options were issued during the three months period ended March 31, 2023 and year ended December 31, 2022.
A total of 9,250,000 options were exercised at a price of C$0.12 each and 689,000 at a price of C$0.145 during the year ended December 31, 2022.
Under the Company’s Omnibus Incentive Plan approved by shareholder on December 17, 2021, 44,900,000 common shares of the Company are reserved for issuance upon exercise of options or other securities.
During the year ended December 31, 2022, 2,399,176 Restricted Share Units (“RSUs”) were granted to members of Executive Management under the Company’s Long Term Incentive Plan (“LTIP”).
In March 2023, the Board considered that it was subject to a share trading restriction. As a result, the Board resolved to extend the expiry date of 12,111,000 shares with an exercise price of C$0.145 past the original expiry date of March 12, 2023 up until June 15, 2023.
Condensed Interim Consolidated Financial Statements
For the Three Months Ended March 31, 2023, and 2022
(in United States Dollars)
THOR EXPLORATIONS LTD.
March 31, 2023
(Unaudited)
Table of contents
| Condensed interim consolidated statements of financial position | 4 |
| Condensed interim consolidated statements of comprehensive income | 5 |
| Condensed interim consolidated statements of cash flows | 6 |
| Condensed interim consolidated statements of changes in equity | 7 |
| Notes to the condensed interim consolidated financial statements | 8-30 |
NOTICE TO READER
Under National Instrument 51-102, Part 4, subsection 4.3 (3) (a), if an auditor has not performed a review of the condensed interim consolidated financial statements, they must be accompanied by a notice indicating that the financial statements have not been reviewed by an auditor.
The accompanying unaudited condensed interim consolidated financial statements of the Company have been prepared by and are the responsibility of the Company’s management.
The Company’s independent auditor has not performed a review of these financial statements in accordance with standards established by the Canadian Institute of Chartered Accountants for a review of condensed interim consolidated financial statements by an entity’s auditor.
| CONDENSED INTERIM CONSOLIDATED STATEMENT OF FINANCIAL POSITION | ||||||||||
| In United States dollars (unaudited) | ||||||||||
| March 31, | December 31, | March 31, | ||||||||
| Note | 2023 $ |
2022 $ |
2022 $ |
|||||||
| (restated) | ||||||||||
| ASSETS | ||||||||||
| Current assets | ||||||||||
| Cash | 4,505,071 | 6,688,037 | 6,276,376 | |||||||
| Inventory | 4 | 25,080,808 | 19,901,262 | 16,534,943 | ||||||
| Amounts receivable | 5 | 240,009 | 220,442 | 191,876 | ||||||
| Prepaid expenses, advances and deposits | 6 | 8,221,563 | 10,476,923 | 918,219 | ||||||
| Total current assets | 38,047,451 | 37,286,664 | 23,921,414 | |||||||
| Non-current assets | ||||||||||
| Deferred income tax assets | 89,061 | 87,797 | 84,794 | |||||||
| Prepaid expenses, advances and deposits | 6 | 244,331 | 282,825 | 103,790 | ||||||
| Right-of-use assets | 7 | 15,667,650 | 16,849,402 | 19,707,915 | ||||||
| Property, plant and equipment | 12 | 148,063,401 | 149,513,917 | 149,421,654 | ||||||
| Intangible assets | 13 | 20,718,491 | 19,231,208 | 15,773,637 | ||||||
| Total non-current assets | 184,782,934 | 185,965,149 | 185,091,790 | |||||||
| TOTAL ASSETS | 222,830,385 | 223,251,813 | 209,013,204 | |||||||
| LIABILITIES | ||||||||||
| Current liabilities | ||||||||||
| Accounts payable and accrued liabilities | 14 | 60,555,348 | 56,337,289 | 31,834,095 | ||||||
| Deferred income | – | 6,581,743 | 6,233,347 | |||||||
| Lease liabilities | 7 | 4,815,512 | 4,811,991 | 4,854,714 | ||||||
| Gold stream liability | 8 | 9,979,413 | 10,187,630 | 12,889,957 | ||||||
| Loans and borrowings | 9 | 11,790,796 | 888,141 | 28,441,348 | ||||||
| Total current liabilities | 87,141,069 | 78,806,794 | 84,253,461 | |||||||
| Non-current liabilities | ||||||||||
| Accounts payable and accrued liabilities | 14 | – | – | 1,031,309 | ||||||
| Lease liabilities | 7 | 9,649,679 | 10,597,294 | 12,587,430 | ||||||
| Gold stream liability | 8 | 13,528,574 | 14,852,135 | 16,860,524 | ||||||
| Loans and borrowings | 9 | 16,191,684 | 27,254,513 | 25,733,198 | ||||||
| Provisions | 11 | 4,971,736 | 4,959,638 | 5,341,369 | ||||||
| Total non-current liabilities | 44,341,673 | 57,663,580 | 61,553,830 | |||||||
| SHAREHOLDERS’ EQUITY | ||||||||||
| Common shares | 15 | 80,439,693 | 80,439,693 | 79,949,297 | ||||||
| Option reserve | 15 | 3,351,133 | 3,351,133 | 3,455,454 | ||||||
| Currency translation reserve | 15 | (2,278,054 | ) | (2,512,911 | ) | (3,690,038 | ) | |||
| Retained earnings/(deficit) | 15 | 9,834,871 | 5,503,524 | (16,508,800 | ) | |||||
| Total shareholders’ equity | 91,347,643 | 86,781,439 | 63,205,913 | |||||||
| TOTAL LIABILITIES AND SHAREHOLDERS’ EQUITY | 222,830,385 | 223,251,813 | 209,013,204 | |||||||
| These condensed interim consolidated financial statements were approved for issue by the Board of Directors on May 29, 2023, and are signed on its behalf by: |
||||||||||
| (Signed) “Adrian Coates” | (Signed) “Olusegun Lawson” | |||||||||
| Director | Director | |||||||||
| The accompanying notes are an integral part of these condensed interim consolidated financial statements. | ||||||||||
| CONDENSED INTERIM CONSOLIDATED STATEMENT OF COMPREHENSIVE LOSS | |||||||
| FOR THE THREE MONTHS ENDED MARCH 31, | |||||||
| In United States dollars (unaudited) | |||||||
| 2023 | 2022 | ||||||
| Note | $ | $ | |||||
| Continuing operations | (restated) | ||||||
| Revenue | 3 | 40,287,830 | 24,865,482 | ||||
| Production costs | 3 | (18,306,502 | ) | (8,219,530 | ) | ||
| Transportation and refining | 3 | (342,291 | ) | (502,222 | ) | ||
| Royalties | 3 | (768,282 | ) | (550,765 | ) | ||
| Amortization and depreciation of operational assets – owned assets | 3 | (6,893,372 | ) | (4,732,780 | ) | ||
| Amortization and depreciation of operational assets – right of use assets | 3 | (1,159,537 | ) | (1,158,255 | ) | ||
| Cost of sales | (27,469,984 | ) | (15,163,552 | ) | |||
| Loss on forward sale of commodity contracts | (750,482 | ) | (294,922 | ) | |||
| Gross profit from operations | 12,067,364 | 9,407,008 | |||||
| Amortization and depreciation – owned assets | 3 | (272,151 | ) | (271,837 | ) | ||
| Amortization and depreciation – right of use assets | 3 | (35,050 | ) | – | |||
| Other administration expenses | 3 | (4,054,939 | ) | (1,883,401 | ) | ||
| Impairment of Exploration & Evaluation assets | 13 | (3,096 | ) | (2,701 | ) | ||
| Profit from operations | 7,702,128 | 7,249,069 | |||||
| Interest expense | (3,370,781 | ) | (3,758,131 | ) | |||
| Net profit before income taxes | 4,331,347 | 3,490,938 | |||||
| Income Tax | – | – | |||||
| Net profit for the period | 4,331,347 | 3,490,938 | |||||
| Attributable to: | |||||||
| Equity shareholders of the Company | 4,331,347 | 3,490,938 | |||||
| Net profit for the period | 4,331,347 | 3,490,938 | |||||
| Other comprehensive profit | |||||||
| Foreign currency translation profit (loss) attributed to equity shareholders | |||||||
| of the company | 234,857 | (800,528 | ) | ||||
| Total comprehensive income profit for the period | 4,566,204 | 2,690,410 | |||||
| Net profit per share | |||||||
| Basic | 16 | $ | 0.007 | $ | 0.005 | ||
| Diluted | 16 | $ | 0.007 | $ | 0.005 | ||
| The accompanying notes are an integral part of these condensed interim consolidated financial statements | |||||||
| CONDENSED INTERIM CONSOLIDATED STATEMENT OF CASH FLOWS | |||||||
| FOR THE THREE MONTHS ENDED MARCH 31, | |||||||
| In United States dollars (unaudited) | |||||||
| Note | 2023 | 2022 | |||||
| (restated) | |||||||
| Cash flows from/(used in): | |||||||
| Operating | |||||||
| Net profit | $ | 4,331,347 | 3,490,938 | ||||
| Adjustments for: | |||||||
| Impairment of unproven mineral interest | 13 | 3,096 | 2,701 | ||||
| Amortization and depreciation | 3 | 8,360,110 | 5,004,617 | ||||
| Loss on forward sale commodity contracts | 750,482 | 294,923 | |||||
| Unrealized Foreign exchange (gains)/losses | 3 | (3,800,994 | ) | 865,075 | |||
| Interest expense | 3,370,781 | 3,752,766 | |||||
| 13,014,822 | 13,411,020 | ||||||
| Changes in non-cash working capital accounts | |||||||
| Inventory | (5,179,546 | ) | 41,150 | ||||
| Receivables | (19,567 | ) | (340,269 | ) | |||
| Current prepaid expenses, advances and deposits | 2,223,366 | – | |||||
| Non-current prepaid expenses, advances and deposits | 38,494 | – | |||||
| Accounts payable and accrued liabilities | 15,718,522 | (5,663,278 | ) | ||||
| Deferred income | (6,581,743 | ) | 6,204,508 | ||||
| Net cash flows from operating activities | 19,214,348 | 13,653,131 | |||||
| Investing | |||||||
| Restricted cash | – | 3,495,992 | |||||
| Purchase of intangible assets | 13 | (6,733 | ) | (169 | ) | ||
| Assets under construction expenditures | 12 | – | – | ||||
| Property, Plant & Equipment | 12 | (14,453,933 | ) | (10,556,466 | ) | ||
| Exploration & Evaluation assets expenditures | 13 | (1,054,802 | ) | (1,022,773 | ) | ||
| Net cash flows used in investing activities | (15,515,468 | ) | (8,083,416 | ) | |||
| Financing | |||||||
| Share subscriptions received | 15 | – | 919,162 | ||||
| (Repayment of) / Proceeds from loans and borrowings | 10 | (3,533,772 | ) | (230,446 | ) | ||
| Arrangement fees paid | (126,874 | ) | – | ||||
| Interest paid | 10 | (1,059,954 | ) | (1,214,587 | ) | ||
| Payment of lease liabilities | 7 | (1,255,729 | ) | (1,213,678 | ) | ||
| Net cash flows (used in)/from financing activities | (5,976,329 | ) | (1,739,549 | ) | |||
| Effect of exchange rates on cash | 94,483 | 1,169,940 | |||||
| Net change in cash | $ | (2,182,966 | ) | 5,000,106 | |||
| Cash, beginning of the period | $ | 6,688,037 | 1,276,270 | ||||
| Cash, end of the period | $ | 4,505,071 | 6,276,376 | ||||
| The accompanying notes are an integral part of these condensed interim consolidated financial statements | |||||||
| CONDENSED INTERIM CONSOLIDATED STATEMENTS OF CHANGES IN EQUITY | ||||||||||||||||
| In United States dollars (unaudited) | ||||||||||||||||
| Note | Common shares | Option reserve | Currency translation reserve | (Deficit)/ Retained earnings | Total shareholders’ equity | |||||||||||
| Balance on December 31, 2021 | $ | 79,027,183 | $ | 4,513,900 | $ | (2,889,510 | ) | $ | (21,058,184 | ) | $ | 59,593,389 | ||||
| Net profit for the period | – | – | – | 3,490,938 | 3,490,938 | |||||||||||
| Other comprehensive loss | – | – | (800,528 | ) | – | (800,528 | ) | |||||||||
| Total comprehensive profit for the period | – | – | (800,528 | ) | 3,490,938 | 2,690,410 | ||||||||||
| Options exercised | 19 | 922,114 | (1,058,446 | ) | – | 1,058,446 | 922,114 | |||||||||
| Balance on March 31, 2022 (restated) | $ | 79,949,297 | $ | 3,455,454 | $ | (3,690,038 | ) | $ | (16,508,800 | ) | $ | 63,205,913 | ||||
| Balance on December 31, 2022 | $ | 80,439,693 | $ | 3,351,133 | $ | (2,512,911 | ) | $ | 5,503,524 | $ | 86,781,439 | |||||
| Net profit for the period | – | – | – | 4,331,347 | 4,331,347 | |||||||||||
| Other comprehensive income | – | – | 234,857 | – | 234,857 | |||||||||||
| Total comprehensive profit for the period | – | – | 234,857 | 4,331,347 | 4,566,204 | |||||||||||
| Balance on March 31, 2023 | $ | 80,439,693 | $ | 3,351,133 | $ | (2,278,054 | ) | $ | 9,834,871 | $ | 91,347,643 | |||||
| The accompanying notes are an integral part of these condensed interim consolidated financial statements. | ||||||||||||||||
- CORPORATE INFORMATION
Thor Explorations Ltd. (the “Company”), together with its subsidiaries (collectively, “Thor” or the “Group”) is a West African focused gold producer and explorer, dually listed on the TSX-Venture Exchange (THX.V) and AIM Market of the London Stock Exchange (THX.L).
The Company was formed in 1968 and is organized under the Business Corporations Act (British Columbia) (BCBCA) with its registered office at 550 Burrard St, Suite 2900 Vancouver, BC, CA, V6C 0A3. The Company evolved into its current form in August 2011 following a reverse takeover and completed the transformational acquisition of its flagship Segilola Gold Project in Nigeria in August 2016.
- BASIS OF PREPARATION
a) Statement of compliance
These condensed interim consolidated financial statements (“interim financial statements”) have been prepared in accordance with International Accounting Standard 34, Interim Financial Reporting, of International Financial Reporting Standards as issued by the International Accounting Standards Board (“IFRS”).
These interim financial statements should be read in conjunction with the audited consolidated financial statements for the year ended December 31, 2022, which have been prepared in accordance with IFRS.
These interim financial statements were authorized for issue by the Board of Directors on May 29, 2023.
b) Basis of measurement
These interim financial statements are presented in United States dollars (“US$”).
These interim financial statements have been prepared on a historical cost basis, except for certain financial instruments that are measured at fair value at the end of each reporting period.
The Group’s accounting policies have been applied consistently to all periods in the preparation of these interim financial statements. In preparing the Group ‘s interim financial statements for the three months ended March 31, 2023, the Group applied the critical judgments and estimates as disclosed in note 3 of its annual financial statements for the year ended December 31, 2022.
These interim financial statements include the accounts of the Company and its subsidiaries. Subsidiaries are entities controlled by the Company, which is defined as having the power over the entity, rights to variable returns from its involvement with the entity, and the ability to use its power to affect the amount of returns. All intercompany transactions and balances are eliminated on consolidation. The Company’s subsidiaries at March 31, 2023 are consistent with the subsidiaries as at December 31, 2022 as disclosed in note 3 to the annual financial statements.
None of the new standards or amendments to standards and interpretations applicable during the period has had a material impact on the financial position or performance of the Group. The Group has not early adopted any standard, interpretation or amendment that was issued but is not yet effective.
c) Nature of operations and going concern
The Board of Directors have performed an assessment of whether the Company and Group would be able to continue as a going concern until at least May 2024. In their assessment, the Group has taken into account its financial position, expected future trading performance, its debt and other available credit facilities, future debt servicing requirements, its working capital and capital expenditure commitments and forecasts.
At March 31, 2023, the Group had a cash position of $4.5 million and a net debt position of $24.9 million, calculated as total debt adjusted for unamortized deferred financing charges less cash and cash equivalents and short-term investments. Cash flows from operating activities for the three months ended March 31, 2023 were inflows of $19.2 million.
The Directors have a reasonable expectation that the Group will have adequate resources to continue in operational existence for at least the next twelve months and that, as at the date of this report, there are no material uncertainties regarding going concern.
The Board of Directors is satisfied that the going concern basis of accounting is an appropriate assumption to adopt in the preparation of the interim financial statements as at, and for the period ended March 31, 2023.
- PROFIT FROM OPERATIONS
3a. REVENUE
| Three Months Ended March 31, |
||||||
| 2023 | 2022 | |||||
| Gold revenue | 40,244,057 | 24,849,962 | ||||
| Silver revenue | 43,773 | 15,520 | ||||
| $ | 40,287,830 | $ | 24,865,482 | |||
The Group`s revenue is generated in Nigeria. All sales are made to the Group`s only customer.
3b. COST OF SALES
| Three Months Ended March 31, |
||||||
| 2023 | 2022 | |||||
| Mining | 20,037,387 | 7,698,414 | ||||
| Processing | 4,108,785 | 926,517 | ||||
| Support services and others | 1,405,062 | 1,778,410 | ||||
| Foreign exchange (gains)/losses on production costs* | (7,244,732) | (2,183,811) | ||||
| Production costs | $ | 18,306,502 | $ | 8,219,530 | ||
| Transportation and refining | 342,291 | 502,222 | ||||
| Royalties | 768,282 | 550,765 | ||||
| Amortization and depreciation – operational assets – owned assets | 6,893,372 | 4,732,780 | ||||
| Amortization and depreciation – operational assets – right of use assets | 1,159,537 | 1,158,255 | ||||
| Cost of sales | 27,469,984 | 15,163,552 | ||||
* The total foreign exchange gain for the current period was $7,244,732, which comprises of realized foreign exchange gains of $3,443,738 and unrealized foreign exchange gains of $3,800,994. During the period, SROL purchased its local currency on a spot basis. The foreign exchange gains and losses from these trades are generated from the differences between the local currency values achieved on the trades versus the currency translation rate at the time of the trade.
3c. AMORTISATION AND DEPRECIATION
| Three Months Ended March 31, |
|||||||||||
| 2023 | 2022 | ||||||||||
| Amortization and depreciation – operational assets – owned assets | 6,893,372 | 4,732,780 | |||||||||
| Amortization and depreciation – operational assets – right of use assets | 1,159,537 | 1,158,255 | |||||||||
| Amortization and depreciation – owned assets | 272,151 | 271,837 | |||||||||
| Amortization and depreciation – right-of-use assets | 35,050 | – | |||||||||
| $ | 8,360,110 | $ | 6,162,872 | ||||||||
3d. OTHER ADMINISTRATION EXPENSES
| Three Months Ended March 31, |
|||||||
| Note | 2023 | 2022 | |||||
| Audit and legal | 150,806 | 47,173 | |||||
| Bank charges | 93,476 | 29,974 | |||||
| Consulting fees | 503,400 | 324,354 | |||||
| Directors’ fees | 17 | 137,472 | 90,328 | ||||
| Investor relations and transfer agent | 126,887 | 111,226 | |||||
| Listing and filing fees | 12,186 | 5,556 | |||||
| Camp costs | 1,356,729 | 418,047 | |||||
| Office and miscellaneous | 765,226 | 364,203 | |||||
| Salaries and benefits | 693,299 | 325,986 | |||||
| Travel | 215,458 | 166,554 | |||||
| $ | 4,054,939 | $ | 1,883,401 | ||||
- INVENTORY
| March 31, 2023 |
December 31, 2022 |
||||||
| Plant spares and consumables | $ | 9,146,279 | $ | 4,751,922 | |||
| Gold ore in stockpile | 12,479,805 | 11,869,168 | |||||
| Gold in CIL | 3,454,724 | 1,614,267 | |||||
| Gold Dore | – | 2,119,935 | |||||
| $ | 25,080,808 | $ | 19,901,262 | ||||
There were no write downs to reduce the carrying value of inventories to net realizable value during the periods ended March 31, 2023 and 2022.
- AMOUNTS RECEIVABLE
| March 31, 2023 |
December 31, 2022 |
|||||
| Accounts receivable | $ | 60,569 | $ | 67,084 | ||
| GST | 1,673 | 993 | ||||
| Other receivables | 177,767 | 152,365 | ||||
| $ | 240,009 | $ | 220,442 |
The value of receivables recorded on the balance sheet is approximate to their recoverable value and there are no expected material credit losses.
- PREPAID EXPENSES, ADVANCES AND DEPOSITS
| March 31, 2023 |
December 31, 2022 |
|||||
| Current: | ||||||
| Gold Stream liability arrangement fees | 33,186 | 33,186 | ||||
| Advance deposits to vendors | 163,012 | 9,625,204 | ||||
| Other prepayments | 8,025,365 | 818,533 | ||||
| $ | 8,221,563 | 10,476,923 | ||||
| Non-current: | ||||||
| Gold Stream liability arrangement fees | – | 74,667 | ||||
| Other prepayments | 244,331 | 208,158 | ||||
| $ | 244,331 | 282,825 |
Included in Advance deposits to vendors, are payment deposits towards key equipment, materials and spare parts, with longer lead times to delivery, which are of critical importance to maintain efficient operations of the mine and process plant. These were made to mitigate against price volatility and inflation currently affecting the sector.
- LEASES
The Group accounts for leases in accordance with IFRS 16. The definition of a lease under IFRS 16 was applied only to contracts entered into or changed on or after January 1, 2019. The Group has elected not to recognize right-of-use assets and lease liabilities for leases which have low value, or short-term leases with a duration of 12 months or less. The payments associated with such leases are charged directly to the income statement on a straight-line basis over the lease term. There were no such leases for the periods ended March 31, 2023 and 2022.
Leases relate principally to corporate offices and the mining fleet at the Segilola mine. Corporate offices are depreciated over 5 years and mining fleet over the life of mine of Segilola.
The key impacts on the Statement of Comprehensive Income and the Statement of Financial Position for the period ended March 31, 2023, were as follows:
| Right of use asset | Lease liability | Income statement | |||||||
| Carrying value December 31, 2022 | $ | 16,849,402 | $ | (15,409,285) | $ | ||||
| New leases entered in to during the period | – | – | – | ||||||
| Depreciation | (1,194,587) | – | (1,194,587) | ||||||
| Interest | – | (298,438) | (298,438) | ||||||
| Lease payments | – | 1,255,729 | – | ||||||
| Foreign exchange movement | 12,835 | (13,197) | (13,197) | ||||||
| Carrying value at March 31, 2023 | $ | 15,667,650 | $ | (14,465,191) | $ | (1,506,222) | |||
| Current liability | (4,815,512) | ||||||||
| Non-current liability | (9,649,679) |
The key impacts on the Statement of Comprehensive Loss and the Statement of Financial Position for the year ended December 31, 2022, were as follows:
| Right of use asset | Lease liability | Income statement | |||||||
| Carrying value December 31, 2021 | $ | 20,843,612 | $ | (18,274,374) | $ | – | |||
| New leases entered in to during the period | 660,064 | (660,064) | – | ||||||
| Depreciation | (4,724,100) | – | (4,724,100) | ||||||
| Interest | – | (1,052,329) | (1,052,329) | ||||||
| Lease payments | – | 4,882,786 | – | ||||||
| Foreign exchange movement | 69,826 | (305,304) | (305,304) | ||||||
| Carrying value at December 31, 2022 | $ | 16,849,402 | $ | (15,409,285) | $ | (6,081,733) | |||
| Current liability | (4,811,991) | ||||||||
| Non-current liability | (10,597,294) |
- GOLD STREAM LIABILITY
Gold stream liability
| March 31, 2023 |
December 31, 2022 |
|||||
| Balance at Beginning of period | $ | 25,039,765 | $ | 30,262,279 | ||
| Repayments | (2,940,730) | (11,534,441) | ||||
| Interest at the effective interest rate | 1,408,952 | 6,311,927 | ||||
| Balance at End of period | $ | 23,507,987 | $ | 25,039,765 | ||
| Current liability | 9,979,413 | 10,187,630 | ||||
| Non-current liability | 13,528,574 | 14,852,135 |
On April 29, 2020, the Group announced the closing of project financing for its flagship Segilola Gold Project (“Segilola”) in Osun State, Nigeria. The financing included a $21 million gold stream upfront deposit (“the Prepayment”) over future gold production at Segilola under the terms of a Gold Purchase and Sale Agreement (“GSA”) entered into between the Group’s wholly owned subsidiary SROL and the AFC. The Prepayment is secured over the shares in SROL as well as over SROL’s assets and is not subject to interest. The initial term of the GSA is for ten years with an automatic extension of a further ten years. The AFC will receive 10.27% of gold production from the Segilola ML41 mining license until the $21 million Prepayment has been repaid in full. Thereafter, the AFC will continue to receive 10.27% of gold production from material mined within the ML41 mining license until a further $26.25 million is received, representing a total money multiple of 2.25 times the value of the Prepayment, at which point the GSA will terminate. The AFC are not entitled to receive an allocation of gold production from material mined from any of the Group’s other gold tenements under the terms of the GSA.
The $26.25 million represented interest on the Prepayment. A calculation of the implied interest rate was made as at drawdown date with interest being apportioned over the expected life of the Stream Facility. The principal input variables used in calculating the implied interest rate and repayment profile were the production profile and gold price. The future gold price estimates were based on market forecast reports for the years 2021 to 2025 and, the production profile was based on the latest life of mine plan model. The liability was to be re-estimated on a periodic basis to include changes to the production profile, any extension to the life of mine plan and movement in the gold price. Upon commencement of production, any change to the implied interest rate will be expensed through the Condensed Interim Consolidated Statement of Income (Loss).
In December 2021, the Group entered into a cash settlement agreement with the AFC where the gold sold to the AFC is settled in a net-cash sum payable to the AFC instead of delivery of bullion in repayment of the gold stream arrangement.
The following table represents the Group’s loans and borrowings measured and recognised at fair value.
| Level 1 | Level 2 | Level 3 | Total | ||||||||||
| Financial liability at fair value through profit or loss | $ | – | – | 23,507,987 | 23,507,987 |
The liabilities included in the above table are carried at fair value through profit and loss.
- LOANS AND BORROWINGS
| March 31, 2023 |
December 31, 2022 |
|||||
| Current liabilities: | ||||||
| Loans payable to the Africa Finance Corporation less than 1 year | $ | 10,828,365 | $ | 356,155 | ||
| Deferred element of EPC contract | 962,431 | 531,986 | ||||
| $ | 11,790,796 | 888,141 | ||||
| Non-current liabilities: | ||||||
| Loans payable to the Africa Finance Corporation more than 1 year | $ | 13,429,381 | $ | 24,103,784 | ||
| Deferred element of EPC contract | 2,762,303 | 3,150,729 | ||||
| $ | 16,191,684 | $ | 27,254,513 |
Loans from the Africa Finance Corporation
| March 31, 2023 |
December 31, 2022 |
|||||
| Balance at Beginning of period | $ | 24,459,939 | $ | 46,859,966 | ||
| Drawdown | – | – | ||||
| Principal repayments | (526,538) | (24,220,764) | ||||
| Arrangement fees | (126,874) | – | ||||
| Interest paid | (986,800) | (4,645,014) | ||||
| Unwinding of interest in the period | 1,438,019 | 6,465,751 | ||||
| Foreign exchange movement | – | – | ||||
| Balance at End of period | $ | 24,257,746 | $ | 24,459,939 | ||
| Current liability | 10,828,365 | 356,155 | ||||
| Non-current liability | 13,429,381 | 24,103,784 |
On December 1, 2020, the Group announced that its subsidiary Segilola Resources Operating Limited (“SROL”) had completed the financial closing of a $54 million project finance senior debt facility (“the Facility”) from the Africa Finance Corporation (“AFC”) for the construction of the Segilola Gold Project in Nigeria. The Facility could be drawn down at the Group’s request in minimum disbursements of $5 million. As at December 31, 2022, SROL has received total disbursements of $52.6 million (2021: $52.6 million), with $nil drawn down in 2022 (2021: $31.2 million) and the remaining $1.35m undrawn facility cancelled by the Group during the period under review (2021: $nil). Total disbursements received represent 97% of the Facility. The Facility is secured over the share capital of SROL and its assets, with repayments commencing in March 2022 and to conclude in March 2025.
Repayment of the aggregate Facility will be made in instalments over a 36-month period by repaying an amount on a series of repayment dates, as set out in the Facility Agreement, which reduces the amount of the outstanding aggregate Facility by the amount equal to the relevant percentage of Loans borrowed as at the close of business in London on the date of Financial Close. Interest accrues at SOFR plus 9% and is payable on a quarterly basis in arrears.
In conjunction with the granting of the Facility, Thor issued 33,329,480 bonus shares to the AFC. Thor also incurred transaction costs of $4,663,652 in relation to the loan facility. The fair value of the liability at inception was determined at $45,822,943 taking into account the transaction costs and equity component and recognized at amortized cost using an effective rate of interest, with the fair value of the shares issued in April 2020 of $5,666,011 recognized within equity.
On 31 January 2023, the Group entered into an agreement with the AFC amending the terms of its senior debt facility.
The amended facility removes the project finance cash sweep requirement and allows for free distributions from SROL (subject to a 20% distribution sweep to the senior debt facility), as well as releasing the Group from restrictions regarding acquisitions, distribution of dividends and certain indebtedness covenants. The payment timetable was also re-scheduled to reallocate a higher percentage of the repayments to a later period in the Facility’s term.
Deferred payment facility on EPC contract for the construction of the Segilola Gold Mine
The Group has constructed its Segilola Gold Mine through an engineering, procurement, and construction contract (“EPC Contract”). The EPC Contract has been agreed on a lump sum turnkey basis which provides Thor with a fixed price of $67.5 million for the full delivery of design, engineering, procurement, construction, and commissioning of the proposed 715,000 ton per annum gold ore processing plant.
The EPC Contract includes a deferred element (“the Deferred Payment Facility”) of 10% of the fixed price. As at March 31, 2023, a total of $2,762,303 (December 31, 2022: $3,682,715) was deferred under the facility. The 10% deferred element is repayable in instalments over a 36-month period by repaying an amount on a series of repayment dates, as set out in the Deferred Payment Facility. Repayments commenced in March 2022 and will conclude in 2025. Interest on this element of the EPC deferred facility accrues at 8% per annum from the time the Facility taking-over Certificate was issued.
| March 31, 2023 |
December 31, 2022 |
|||||
| Balance at beginning of period | $ | 3,682,715 | $ | 6,210,090 | ||
| Offset against EPC payment | – | 440,263 | ||||
| Principal repayments | (66,504) | (3,440,449) | ||||
| Interest paid | (73,154) | – | ||||
| Unwinding of interest in the period | 181,677 | 472,811 | ||||
| Balance period end | $ | 3,724,734 | $ | 3,682,715 | ||
| Current liability | 962,431 | 531,986 | ||||
| Non-current liability | 2,762,303 | 3,150,729 |
- RECONCILIATION OF LIABILITIES ARISING FROM FINANCING ACTIVITIES
| March 31, 2023 | Gold stream liability | AFC loan | EPC deferred facility | Total | |||||||||
| January 1, 2023 | $ | 25,039,765 | 24,459,939 | 3,682,715 | 53,182,419 | ||||||||
| Cash flows: | |||||||||||||
| (Repayment of) / Proceeds from loans | |||||||||||||
| and borrowings | (2,940,730) | (526,538) | (66,504) | (3,533,772) | |||||||||
| Arrangement fees | – | (126,874) | – | (126,874) | |||||||||
| Interest paid | – | (986,800) | (73,154) | (1,059,954) | |||||||||
| Non-cash changes: | |||||||||||||
| Unwinding of interest in the year | 1,408,952 | 1,438,019 | 181,677 | 3,028,648 | |||||||||
| March 31, 2023 | $ | 23,507,987 | 24,257,746 | 3,724,734 | 51,490,467 |
| December 31, 2022 | Gold stream liability | Short term advance | AFC loan | EPC deferred facility | Total | |||||||||||
| January 1, 2022 | $ | 30,262,279 | 668,570 | 46,859,966 | 6,210,090 | 84,000,905 | ||||||||||
| Cash flows: | ||||||||||||||||
| (Repayment of) / | ||||||||||||||||
| Proceeds from loans | ||||||||||||||||
| and borrowings | (11,534,441) | (668,570) | (24,220,764) | (3,440,449) | (39,864,224) | |||||||||||
| Interest paid | – | – | (4,645,014) | – | (4,645,014) | |||||||||||
| Non-cash changes: | ||||||||||||||||
| Unwinding of interest | ||||||||||||||||
| in the year | 6,311,927 | – | 6,465,751 | 472,811 | 13,250,489 | |||||||||||
| Offset against EPC | ||||||||||||||||
| payment | – | – | – | 440,263 | 440,263 | |||||||||||
| December 31, 2022 | $ | 25,039,765 | – | 24,459,939 | 3,682,715 | 53,182,419 |
- PROVISIONS
| March 31, 2023 | Other | Fleet demobilization costs | Restoration costs | Total | ||||||||
| Balance at Beginning of period | $ | 18,157 | $ | 173,442 | $ | 4,768,039 | $ | 4,959,638 | ||||
| Initial recognition of provision | – | – | – | – | ||||||||
| Changes in estimates | – | – | ||||||||||
| Unwinding of discount | – | – | 11,701 | 11,701 | ||||||||
| Foreign exchange movements | 397 | – | – | 397 | ||||||||
| Balance at period end | $ | 18,554 | $ | 173,442 | $ | 4,779,740 | $ | 4,971,736 | ||||
| Current liability | – | – | – | – | ||||||||
| Non-current liability | 18,554 | 173,442 | 4,779,740 | 4,971,736 |
| December 31, 2022 | Other | Fleet demobilization costs | Restoration costs | Total | ||||||||
| Balance at Beginning of period | $ | – | $ | 173,241 | $ | 5,064,935 | $ | 5,238,176 | ||||
| Initial recognition of provision | 18,415 | – | – | 18,415 | ||||||||
| Changes in estimates | – | – | (404,859) | (404,859) | ||||||||
| Unwinding of discount | – | 201 | 107,963 | 108,164 | ||||||||
| Foreign exchange movements | (258) | – | – | (258) | ||||||||
| Balance at period end | $ | 18,157 | $ | 173,442 | $ | 4,768,039 | $ | 4,959,638 | ||||
| Current liability | – | – | – | – | ||||||||
| Non-current liability | 18,157 | 173,442 | 4,768,039 | 4,959,638 |
The restoration costs provision is for the site restoration at Segilola Gold Project in Osun State Nigeria. The value of the above provision is measured by unwinding the discount on expected future cash flows using a discount factor that reflects the credit-adjusted risk-free rate of interest. It is expected that the restoration costs will be paid in US dollars, and as such US forecast inflation rates of 2.9% and the interest rate of 4% on 5-year US bonds were used to calculate the expected future cash flows, which are in line with the life of mine. The provision represents the net present value of the best estimate of the expenditure required to settle the obligation to rehabilitate environmental disturbances caused by mining operations at mine closure.
The fleet demobilization costs provision is the value of the cost to demobilize the mining fleet upon closure of the mine.
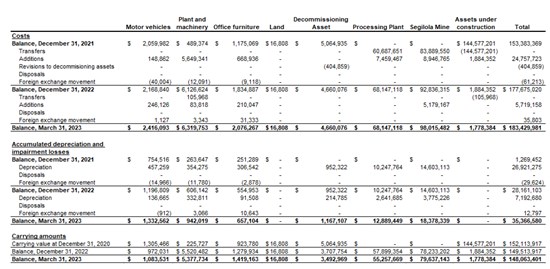
- PROPERTY, PLANT AND EQUIPMENT

To view an enhanced version of this graphic, please visit:
https://images.newsfilecorp.com/files/7003/167928_a47e04ce84b558f4_002full.jpg
A summary of depreciation capitalized is as follows:
| Three months ended March 31, | Total depreciation Capitalized | |||||||||||
| 2022 | 2021 | December 31, 2022 |
December 31, 2022 |
|||||||||
| Exploration expenditures | 55,718 | 23,418 | 676,070 | 620,352 | ||||||||
| Total | $ | 55,718 | $ | 23,418 | $ | 676,070 | $ | 620,352 | ||||
a) Segilola Project, Osun Nigeria:
Classification of Expenditure on the Segilola Gold Project
On January 1, 2022, the Group achieved Commercial Production at the Segilola Gold Project in Nigeria (“the Project”) Upon achieving Commercial Production, the Assets under Construction was reclassified within Property, Plant and Equipment, and transferred to Mining Asset, Processing Plant and Decommissioning Asset.
Decommissioning Asset
The decommissioning asset relates to estimated restoration costs at the Group’s Segilola Gold Mine as at March 31, 2023. Refer to Note 11 for further detail.
EPC payments
During the three-month period ended March 31, 2023, the Group paid $8,732,752 (December 31, 2022: $4,321,856) to the EPC contractor in relation to the construction of the Segilola Mine and processing plant.
- INTANGIBLE ASSETS
The Group’s exploration and evaluation assets costs are as follows:
| Douta Gold Project, Senegal | Central Houndé Project, Burkina Faso | Exploration licenses, Nigeria | Software | Total | |||||||||||
| Balance, December 31, 2021 | $ | 14,219,982 | $ | – | $ | 895,301 | $ | 230,136 | $ | 15,345,419 | |||||
| Acquisition costs | – | – | 24,103 | – | 24,103 | ||||||||||
| Exploration costs | 3,745,803 | 12,014 | 1,693,863 | – | 5,451,680 | ||||||||||
| Additions | – | – | – | 43,599 | 43,599 | ||||||||||
| Amortisation | – | – | – | (122,988) | (122,988) | ||||||||||
| Impairment | – | (12,014) | – | – | (12,014) | ||||||||||
| Foreign exchange movement | (1,427,912) | – | (70,679) | – | (1,498,591) | ||||||||||
| Balance, December 31, 2022 | $ | 16,537,873 | $ | – | $ | 2,542,588 | $ | 150,747 | $ | 19,231,208 | |||||
| Acquisition costs | – | – | – | – | – | ||||||||||
| Exploration costs | 749,926 | 3,096 | 348,301 | – | 1,101,323 | ||||||||||
| Additions | – | – | – | 6,733 | 6,733 | ||||||||||
| Amortisation | – | – | – | (28,561) | (28,561) | ||||||||||
| Impairment | – | (3,096) | – | – | (3,096) | ||||||||||
| Foreign exchange movement | 263,121 | – | 147,763 | – | 410,884 | ||||||||||
| Balance, March 31, 2023 | $ | 17,550,920 | $ | – | $ | 3,038,652 | $ | 128,919 | $ | 20,718,491 |
a) Douta Gold Project, Senegal:
The Douta Gold Project consists of an early-stage gold exploration license located in southeastern Senegal, approximately 700km east of the capital city Dakar.
The Group is party to an option agreement (the “Option Agreement”) with International Mining Company (“IMC”), by which the Group has acquired a 70% interest in the Douta Gold Project located in southeast Senegal held through African Star SARL.
Pursuant to the terms of the Option Agreement, IMC’s 30% interest will be a “free carry” interest until such time as the Group announces probable reserves on the Douta Gold Project (the “Free Carry Period”). Following the Free Carry Period, IMC must either elect to sell its 30% interest to African Star at a purchase price determined by an independent valuer commissioned by African Star or fund its 30% share of the exploration and operating expenses.
b) Central Houndé Project, Burkina Faso:
(i) Bongui and Legue gold permits, Burkina Faso:
AFC Constelor SARL holds a 100% interest in the Bongui and Legue gold permits covering an area of approximately 233 km2 located within the Houndé belt, 260 km southwest of the capital Ouagadougou, in western Burkina Faso.
(ii) Ouere Permit, Central Houndé Project, Burkina Faso:
Argento BF SARL holds a 100% interest in the Ouere gold permit, covering an area of approximately 241 km2 located within the Houndé belt.
The three permits together cover a total area of 474km2 over the Houndé Belt which form the Central Houndé Project.
The Group carried out an impairment assessment of the Central Houndé Project at December 31, 2020, and a decision was taken to fully impair the value of the Central Houndé Project. It is the Group’s intention to focus on Segilola development and Douta exploration in the short term, and it does not plan to undertake significant work on the license areas in the near future.
c) Exploration Licenses, Nigeria
The high grade Segilola gold deposit is located on the major regional shear zone that extends for several hundred kilometers through the gold-bearing Ilesha schist belt (structural corridor) of Nigeria. The Group’s gold exploration tenure currently comprises 16 wholly owned exploration licenses and nine joint venture partnership exploration licenses. Together with the mining lease over the Segilola Gold Deposit, Thor’s total gold exploration tenure amounts to 1,542 km². The Group’s exploration strategy includes further expansion of its Nigerian land package as and when attractive new licenses become available.
- ACCOUNTS PAYABLE AND ACCRUED LIABILITIES
| March 31, 2023 |
December 31, 2022 |
|||||
| Trade payables | $ | 51,912,663 | $ | 46,914,333 | ||
| Accrued liabilities | 6,273,782 | 6,213,977 | ||||
| Other payables | 2,368,903 | 3,208,979 | ||||
| $ | 60,555,348 | $ | 56,337,289 | |||
| Current liability | 60,555,348 | 56,337,289 | ||||
| Non-current liability | – | – |
Accounts payable and accrued liabilities are classified as financial liabilities and approximate their fair values.
Included in trade payables is a balance of $1,463,353 due to our EPC contractor (December 31, 2022: $10,196,105). The total EPC amount has been finalized with our EPC contractor, and this balance has been paid at the date of release of these interim financial statements.
Also included in trade payables is a total of $805,801 (2021: $$2,215,585) that relates to third party royalties that will become payable upon future gold sales. All these royalties’ creditors are included in current liabilities.
The following table represents the Group’s trade payables measured and recognized at fair value.
| Level 1 | Level 2 | Level 3 | Total | ||||||||||
| Trade payables | |||||||||||||
| Third party royalties | $ | – | – | 805,801 | 805,801 |
- CAPITAL AND RESERVES
a) Authorized
Unlimited common shares without par value.
b) Issued
| March 31, 2023 Number |
March 31, 2023 |
December 31, 2022 Number |
December 31, 2022 |
|||||||||
| As at start of the year | 644,696,185 | $ | 80,439,693 | 632,358,009 | $ | 79,027,183 | ||||||
| Issue of new shares: | ||||||||||||
| – Share options exercised i | – | – | 9,939,000 | 960,546 | ||||||||
| – RSU awards vested ii | – | – | 2,399,176 | 451,964 | ||||||||
| 644,696,185 | $ | 80,439,693 | 644,696,185 | $ | 80,439,693 |
i Value of 9,250,000 options exercised at a price of CAD$0.12 per share and 289,000 options exercised at a price of CAD$0.145 per share, both on January 19, 2022, and 400,000 options exercised at a price of CAD$0.145 per share on December 13, 2022.
ii Value of 2,399,176 RSU awards that were granted and vested on October 11, 2022, at a deemed price of CAD$0.26 per share.
c) Share-based compensation
Stock option plan
The Group has granted directors, officers and consultants share purchase options. These options were granted pursuant to the Group’s stock option plan.
Under the current Share Option Plan, 44,900,000 common shares of the Group are reserved for issuance upon exercise of options.
- On January 16, 2020, 14,250,000 stock options were granted at an exercise price of C$0.20 per share for a period of five years. The options vested immediately.
- On October 5, 2018, 750,000 stock options were granted at an exercise price of C$0.14 per share for a period of five years.
- On March 12, 2018, 12,800,000 stock options were granted at an exercise price of C$0.145 per share for a period of five years. 689,000 of these stock options were exercised during 2022.
All of the stock options were vested as at the balance sheet date. These options did not contain any market conditions and the fair value of the options were charged to the statement of comprehensive loss or capitalized as to assets under construction in the period where granted to personnel’s whose cost is capitalized on the same basis. The assumptions inherent in the use of these models are as follows:
| Vesting period (years) |
First vesting date |
Expected remaining life (years) | Risk free rate |
Exercise price | Volatility of share price |
Fair value | Options vested | Options granted | Expiry |
| 5 | 12/03/2018 | 0.21 | 2.00% | $ 0.145 | 105.09% | $ 0.14 | 12,111,000 | 12,111,000 | 15/06/2023 |
| 5 | 05/10/2018 | 0.52 | 2.43% | $ 0.14 | 100.69% | $ 0.14 | 750,000 | 750,000 | 05/10/2023 |
| 5 | 16/01/2020 | 1.80 | 1.49% | $ 0.20 | 66.84% | $ 0.07 | 14,250,000 | 14,250,000 | 16/01/2025 |
In Canadian Dollars
The Group has elected to measure volatility by calculating the average volatility of a collection of three peer companies’ historical share prices for the exercising period of each parcel of options. Management believes that given the transformational change that the Group has undergone since the acquisition of the Segilola Gold Project in August 2016, the Group’s historical share price is not reflective of the current stage of development of the Group, and that adopting the volatility of peer companies who have advanced from exploration to development is a more accurate measure of share price volatility for the purpose of options valuation.
The following is a summary of changes in options from January 1, 2023, to March 31, 2023, and the outstanding and exercisable options at March 31, 2023:

To view an enhanced version of this graphic, please visit:
https://images.newsfilecorp.com/files/7003/167928_a47e04ce84b558f4_003full.jpg
In Canadian Dollars
The following is a summary of changes in options from January 1, 2022, to December 31, 2022, and the outstanding and exercisable options at December 31, 2022:

To view an enhanced version of this graphic, please visit:
https://images.newsfilecorp.com/files/7003/167928_a47e04ce84b558f4_004full.jpg
In Canadian Dollars
d) Nature and purpose of equity and reserves
The reserves recorded in equity on the Group’s statement of financial position include ‘Reserves,’ ‘Currency translation reserve,’ ‘Retained earnings’ and ‘Deficit.’
‘Option reserve’ is used to recognize the value of stock option grants prior to exercise or forfeiture.
‘Currency translation reserve’ is used to recognize the exchange differences arising on translation of the assets and liabilities of foreign branches and subsidiaries with functional currencies other than US dollars.
‘Deficit’ is used to record the Group’s accumulated deficit.
‘Retained earnings’ is used to record the Group’s accumulated earnings.
- EARNINGS PER SHARE
Diluted net earnings per share was calculated based on the following:
| March 31, 2023 |
March 31, 2022 |
|||||
| Basic weighted average number of shares outstanding | 644,696,185 | 635,508,743 | ||||
| Stock options | 10,747,624 | – | ||||
| Diluted weighted average number of shares outstanding | 655,443,809 | 635,508,743 | ||||
| Total common shares outstanding | 644,696,185 | 641,897,009 | ||||
| Total potential diluted common shares | 671,597,185 | 669,198,009 |
- RELATED PARTY DISCLOSURES
A number of key management personnel, or their related parties, hold or held positions in other entities that result in them having control or significant influence over the financial or operating policies of the entities outlined below.
a) Trading transactions
The Africa Finance Corporation (“AFC”) is deemed to be a related party given the size of its shareholding in the Company. There have been no other transactions with the AFC other than the Gold Stream liability as disclosed in Note 8, and the secured loan as disclosed in Note 9.
b) Compensation of key management personnel
The remuneration of directors and other members of key management during the three months ended March 31, 2023, and 2022 were as follows:
| Three months ended March 31, |
|||||||
| 2023 | 2022 | ||||||
| Salaries | |||||||
| Current directors and officers | (i) (ii) | $ | 236,662 | $ | 161,487 | ||
| Former directors and officers | $ | – | $ | 36,818 | |||
| Directors’ fees | |||||||
| Current directors and officers | (i) (ii) | $ | 137,472 | $ | 90,328 | ||
| $ | 374,134 | $ | 288,633 | ||||
(i) Key management personnel were not paid post-employment benefits, termination benefits, or other long-term benefits during the three months ended March 31, 2023, and 2022.
(ii) The Group paid consulting and director fees to both individuals and private companies controlled by directors and officers of the Group for services. Accounts payable and accrued liabilities at March 31, 2023, include $nil (December 31, 2022 – $102,092) due to directors or private companies controlled by an officer and director of the Group. Amounts due to or from related parties are unsecured, non-interest bearing and due on demand.
18. FINANCIAL INSTRUMENTS
The Group’s financial instruments are classified as follows:
| March 31, 2023 | Measured at amortized cost | Measured at fair value through profit and loss | Total | |||||||||
| Assets | ||||||||||||
| Cash and cash equivalents | $ | 4,505,071 | – | 4,505,071 | ||||||||
| Amounts receivable | 240,009 | – | 240,009 | |||||||||
| Total assets | $ | 4,745,080 | – | 4,745,080 | ||||||||
| Liabilities | ||||||||||||
| Accounts payable and accrued liabilities | $ | 59,749,547 | 805,801 | 60,555,348 | ||||||||
| Loans and borrowings | 27,982,480 | – | 27,982,480 | |||||||||
| Gold stream liability | – | 23,507,987 | 23,507,987 | |||||||||
| Lease liabilities | 14,465,191 | – | 14,465,191 | |||||||||
| Total liabilities | $ | 102,197,218 | 24,313,788 | 126,511,006 | ||||||||
| December 31, 2022 | Measured at amortized cost | Measured at fair value through profit and loss | Total | |||||||||
| Assets | ||||||||||||
| Cash and cash equivalents | $ | 6,688,037 | – | 6,688,037 | ||||||||
| Amounts receivable | 220,442 | – | 220,442 | |||||||||
| Total assets | $ | 6,908,479 | – | 6,908,479 | ||||||||
| Liabilities | ||||||||||||
| Accounts payable and accrued liabilities | $ | 54,121,704 | 2,215,585 | 56,337,289 | ||||||||
| Loans and borrowings | 28,142,654 | – | 28,142,654 | |||||||||
| Gold stream liability | – | 25,039,765 | 25,039,765 | |||||||||
| Lease liabilities | 15,409,285 | – | 15,409,285 | |||||||||
| Total liabilities | $ | 97,673,643 | 27,255,350 | 124,928,993 | ||||||||
The fair value of these financial instruments approximates their carrying value.
As noted above, the Group has certain financial liabilities that are held at fair value. The fair value hierarchy establishes three levels to classify the inputs to valuation techniques to measure fair value:
Classification of financial assets and liabilities
Level 1 – quoted prices (unadjusted) in active markets for identical assets or liabilities;
Level 2 – inputs other than quoted prices included within level 1 that are observable for the asset or liability, either directly (that is, as prices) or indirectly (that is, derived from prices); and
Level 3 – inputs for the asset or liability that are not based on observable market data (that is, unobservable inputs).
As at March 31, 2023 and December 31, 2022, all the Group`s liabilities measured at fair value through profit and loss are categorized as Level 3 and their fair value was determined using discounted cash flow valuation models, taking into account assumptions with respect to gold prices and discount rates as well as estimates with respect to production and operating results for the Segilola mine.
19. CAPITAL MANAGEMENT
The Group manages, as capital, the components of shareholders’ equity. The Group’s objectives, when managing capital, are to safeguard its ability to continue as a going concern in order to develop and its mineral interests through the use of capital received via the issue of common shares and via debt instruments where the Board determines that the risk is acceptable and, in the shareholders’ best interest to do so.
The Group manages its capital structure, and makes adjustments to it, in light of changes in economic conditions and the risk characteristics of the underlying assets. To maintain or adjust its capital structure, the Group may attempt to issue common shares, borrow, acquire or dispose of assets or adjust the amount of cash.
20. CONTRACTUAL COMMITMENTS AND CONTINGENT LIABILITIES
Contractual Commitments
The Group has no contractual obligations that are not disclosed on the Condensed Interim Consolidated Statement of Financial Position.
Contingent liabilities
The Group is involved in various legal proceedings arising in the ordinary course of business. Management has assessed these contingencies and determined that, in accordance with International Financial Reporting Standards, all cases are considered remote. As a result, no provision has been made in the interim financial statements for any potential liabilities that may arise from these legal proceedings.
Although the Group believes that it has valid defenses in these matters, the outcome of these proceedings is uncertain, and there can be no assurance that the Group will prevail in these matters. The Group will continue to assess the likelihood of any loss, the range of potential outcomes, and whether or not a provision is necessary in the future, as new information becomes available.
Based on the information available, the Group does not believe that the outcome of these legal proceedings will have a material adverse effect on the financial position or results of operations of the Group. However, there can be no assurance that future developments will not materially affect the Group’s financial position or results of operations.
21. SEGMENTED DISCLOSURES
Segment Information
The Group’s operations comprise three reportable segments, being the Segilola Mine Project, Exploration Projects, and Corporate.
| Three months ended March 31, 2023 |
Segilola Mine Project | Exploration Projects | Corporate | Total | ||||||||
| Profit(loss) for the period | $ | 4,662,903 | $ | (163,572 | ) | $ | (167,984 | ) | $ | 4,331,347 | ||
| -revenue | 40,287,830 | – | – | 40,287,830 | ||||||||
| -consulting fees | (331,033 | ) | (117,869 | ) | (54,497 | ) | (503,400 | ) | ||||
| -salaries and benefits | (317,453 | ) | – | (375,846 | ) | (693,299 | ) | |||||
| -depreciation owned assets | (7,153,854 | ) | (2,168 | ) | (9,501 | ) | (7,165,523 | ) | ||||
| -impairments | – | (3,096 | ) | – | (3,096 | ) | ||||||
| -interest expense | (3,370,781 | ) | – | – | (3,370,781 | ) |
| March 31, 2023 | Segilola Mine Project | Exploration Projects | Corporate | Total | ||||||||
| Current assets | $ | 36,084,549 | $ | 42,251 | $ | 1,920,651 | $ | 38,047,451 | ||||
| Non-current assets | ||||||||||||
| Deferred income tax assets | – | 89,061 | – | 89,061 | ||||||||
| Prepaid expenses, advances and deposits | 33,186 | – | 211,145 | 244,331 | ||||||||
| Right-of-use assets | 15,072,816 | – | 594,834 | 15,667,650 | ||||||||
| Property, plant and equipment | 147,367,956 | 537,791 | 157,654 | 148,063,401 | ||||||||
| Intangible assets | 128,919 | 20,589,572 | – | 20,718,491 | ||||||||
| Total assets | $ | 198,687,426 | $ | 21,258,675 | $ | 2,884,284 | $ | 222,830,385 | ||||
| Non-current asset additions | $ | 10,527,299 | $ | 2,612,033 | $ | 1,337,066 | $ | 14,476,398 | ||||
| Liabilities | $ | (127,519,042 | ) | $ | (1,465,503 | ) | $ | (2,498,197 | ) | $ | (131,482,742 | ) |
Non-current assets by geographical location:
| March 31, 2023 | Senegal | British Virgin Islands | Nigeria | United Kingdom | Canada | Total | ||||||||||||
| Prepaid expenses, advances and deposits | – | 5,619 | 33,185 | 205,527 | – | 244,331 | ||||||||||||
| Right-of-use assets | – | – | 15,072,816 | 594,834 | – | 15,667,650.00 | ||||||||||||
| Property, plant and equipment | 396,218 | – | 147,520,674 | 141,699 | 4,810 | 148,063,401 | ||||||||||||
| Intangible assets | 11,452,918 | – | 9,265,573 | – | – | 20,718,491 | ||||||||||||
| Total non-current assets | $ | 11,849,136 | $ | 5,619 | $ | 171,892,248 | $ | 942,060 | $ | 4,810 | $ | 184,693,873 |
| Three months ended March 31, 2022 |
Segilola Mine Project | Exploration Projects | Corporate | Total | ||||||||
| Profit (loss) for the period | $ | 4,634,699 | $ | (60,571 | ) | $ | (1,083,190 | ) | $ | 3,490,938 | ||
| – revenue | 24,865,482 | – | – | 24,865,482 | ||||||||
| – consulting fees | (137,835 | ) | (30,174 | ) | (156,345 | ) | (324,354 | ) | ||||
| – salaries and benefits | (37,913 | ) | – | (288,073 | ) | (325,986 | ) | |||||
| – depreciation owned assets | (5,000,920 | ) | (2,234 | ) | (1,463 | ) | (5,004,617 | ) | ||||
| – impairments | – | (2,701 | ) | – | (2,701 | ) | ||||||
| – interest expense | (3,758,131 | ) | – | – | (3,758,131 | ) |
| December 31, 2022 | Segilola Mine Project | Exploration Projects | Corporate | Total | ||||||||
| Current assets | $ | 36,334,005 | $ | 120,752 | $ | 831,907 | $ | 37,286,664 | ||||
| Non-current assets | ||||||||||||
| Deferred income tax assets | – | 87,797 | – | 87,797 | ||||||||
| Prepaid expenses, advances and deposits | 74,667 | – | 208,158 | 282,825 | ||||||||
| Right-of-use assets | 16,232,353 | – | 617,049 | 16,849,402 | ||||||||
| Property, plant and equipment | 149,050,728 | 339,785 | 123,404 | 149,513,917 | ||||||||
| Intangible assets | 150,747 | 19,080,461 | – | 19,231,208 | ||||||||
| Total assets | $ | 201,842,500 | $ | 19,628,795 | $ | 1,780,518 | $ | 223,251,813 | ||||
| Non-current asset additions | $ | 10,527,299 | $ | 2,612,033 | $ | 1,337,066 | $ | 14,476,398 |
Non-current assets by geographical location:
| December 31, 2022 | Senegal | British Virgin Islands | Nigeria | United Kingdom | Canada | Total | ||||||||||||
| Prepaid expenses, advances and deposits | – | 7,024 | 74,667 | 201,134 | – | 282,825 | ||||||||||||
| Right-of-use assets | – | – | 16,232,354 | 617,048 | – | 16,849,402.00 | ||||||||||||
| Property, plant and equipment | 176,645 | – | 149,230,320 | 101,491 | 5,461 | 149,513,917 | ||||||||||||
| Intangible assets | 10,704,623 | – | 8,526,585 | – | – | 19,231,208 | ||||||||||||
| Total non-current assets | 10,881,268 | 7,024 | 174,468,785 | 919,673 | 5,461 | 185,877,352 |
22. PRIOR PERIOD RESTATEMENT
Following the conclusion of the audited consolidated financial statements for the year ended December 31, 2022, the Group identified the restatements below for the Three-month period ended March 31, 2022:
1 – Capitalization of $2,983,318 of stripping costs within “Property, Plant and equipment” as these related to improved access to ore as determined by “IFRIC 20 – Stripping Costs in the Production Phase of a Surface Mine”;
2 – Capitalization of $307,147 of near mine exploration costs within “Intangible assets” as these meet the definition of an asset in accordance with “IFRS 6 – Exploration for and Evaluation of Mineral Resources”;
3 – Reclassification of $5,891,035 of amortization and depreciation of operational assets to “Cost of sales”;
4 – Reclassification of $2,183,811 of foreign exchange gains to “Production costs” as the foreign exchange resulted from the purchase of raw materials, spare parts and other operational inputs required to support and maintain the Segilola mine operations; and
5 – Reclassification of $3,495,992 of restricted cash cashflows from “Net cash flows from operating activities” to “Net cash flows used in investing activities”.
Therefore, in accordance with “IAS 8 Accounting Policies, Changes in Accounting Estimates and Errors”, the Condensed interim consolidated statements of financial position, Condensed interim consolidated statements of comprehensive income and Condensed interim consolidated statements of cash flows for the three-month period ended March 31, 2022 have been restated. The impact of the restatements on these statements is demonstrated below:
Condensed interim consolidated statements of financial position

To view an enhanced version of this graphic, please visit:
https://images.newsfilecorp.com/files/7003/167928_a47e04ce84b558f4_009full.jpg
Condensed interim consolidated statements of comprehensive income

To view an enhanced version of this graphic, please visit:
https://images.newsfilecorp.com/files/7003/167928_a47e04ce84b558f4_010full.jpg
Condensed interim consolidated statements of cash flows

To view an enhanced version of this graphic, please visit:
https://images.newsfilecorp.com/files/7003/167928_a47e04ce84b558f4_011full.jpg
23. SUBSEQUENT EVENTS
EPC Contract
As of the date of these Interim financial statements, the Group has made all outstanding due payments in relation to the EPC contract. At March 31, 2023, this amounted to US$1,463,353.
NOT FOR DISSEMINATION IN THE UNITED STATES OR FOR
DISTRIBUTION TO U.S. WIRE SERVICES
To view the source version of this press release, please visit https://www.newsfilecorp.com/release/167928
drill results
drilling
intercepts
tsxv-thx
thor-explorations-ltd
thor explorations ltd
financing
acquisition
stock options
press-release


Capella Announces Definitive Agreement for the Sale of is Central Norway Copper-Cobalt Projects to NickelX and Financing Update
Capella Announces Definitive Agreement for the Sale of is Central Norway Copper-Cobalt Projects to NickelX and Financing Update
Canada NewsWire
VANCOUVER, BC, Oct. 17, 2023
VANCOUVER, BC, Oct. 17, 2023 /CNW/ – Capella Minerals Ltd (TSXV: CMIL) (OTC…

Goldgroup Announces Exercise of Cerro Prieto Purchase Option
Vancouver, British Columbia–(Newsfile Corp. – October 17, 2023) – Goldgroup Mining Inc. (TSX: GGA) (OTC PINK: GGAZF) (BMV SIX: GGAN.MX) ("Goldgroup" or…
Colibri Provides Company Update
Dieppe, New Brunswick–(Newsfile Corp. – October 17, 2023) – Colibri Resource Corporation (TSXV: CBI) (OTC Pink: CRUCF) ("Colibri" or the "Company") is…


