News Releases
SSR MINING REPORTS THIRD QUARTER 2022 RESULTS
SSR MINING REPORTS THIRD QUARTER 2022 RESULTS
PR Newswire
DENVER, Nov. 8, 2022
HIGHLIGHTS (1)
ATTRIBUTABLE & ADJUSTED ATTRIBUTABLE THIRD QUARTER DILUTED EPS OF $(0.12) AND $(0.07) PER SHARE, RESPECTIVELY QUARTERLY PRODUCTION OF 106,919 GOLD EQU…

SSR MINING REPORTS THIRD QUARTER 2022 RESULTS
PR Newswire
DENVER, Nov. 8, 2022
HIGHLIGHTS (1)
- ATTRIBUTABLE & ADJUSTED ATTRIBUTABLE THIRD QUARTER DILUTED EPS OF $(0.12) AND $(0.07) PER SHARE, RESPECTIVELY
- QUARTERLY PRODUCTION OF 106,919 GOLD EQUIVALENT OUNCES
- YEAR-TO-DATE PRODUCTION OF 441,164 OUNCES AT PRODUCTION COSTS OF $955 AND AISC of $1,331 PER OUNCE
- YEAR-TO-DATE CAPITAL RETURNS OF $144 MILLION, A 5% YIELD
- RESTARTED ҪӦPLER OPERATIONS IN THE THIRD QUARTER; RAMP-UP PROGRESSING SMOOTHLY
- TARGETING FULL YEAR PRODUCTION OF 620,000 – 655,000 GOLD EQUIVALENT OUNCES; PRODUCTION COSTS OF $960 – $990 PER OUNCE AND AISC OF $1,315 – $1,345 PER OUNCE
- CLOSED THE SALE OF THE PITARRILLA PROJECT IN MEXICO
- RECEIVED ENVIRONMENTAL IMPACT ASSESSMENT FOR PHASE ONE OF THE ÇAKMAKTEPE EXTENSION PROJECT
- SUBSEQUENT TO THE QUARTER, ANNOUNCED THE CONSOLIDATION OF THE ÇӦPLER DISTRICT WITH THE ACQUISITION OF AN INCREMENTAL 30% INTEREST IN THE KARTALTEPE JOINT VENTURE FOR $150 MILLION IN CASH
DENVER, Nov. 8, 2022 /PRNewswire/ – SSR Mining Inc. (NASDAQ: SSRM) (TSX: SSRM) (ASX: SSR) (“SSR Mining” or the “Company”) reports consolidated financial results for the third quarter ended September 30, 2022. In addition, the Board of Directors declared a quarterly cash dividend of $0.07 per common share payable on December 19, 2022 to holders of record at the close of business on November 18, 2022. This dividend qualifies as an ‘eligible dividend’ for Canadian tax purposes.
Rod Antal, President and CEO said, “Despite the headwinds we faced during the third quarter at Çöpler, our business remains in an incredibly strong position, with a robust balance sheet and a capital returns program that is expected to deliver nearly $160 million to shareholders by year-end. With these returns, 2022 will represent the second consecutive year we have delivered a capital return yield greater than 5%. Our foundation of strong free cash flow generation and low capital intensity growth remains firmly intact and will be reflected in our fourth quarter performance and beyond as our operations return to steady state.
During the third quarter, a number of actions were taken to ensure a strong finish to the year at each operation. Planned maintenance was accelerated at Çöpler to maximize plant availability in the fourth quarter, we prioritized underground development at Seabee in order to access a higher grade portion of the ore body in the fourth quarter and stacked more than 135,000 recoverable ounces at an average recoverable grade of 0.63 g/t during the second and third quarters at Marigold. Despite these efforts and the expectations of what will be a strong fourth quarter, we have reduced our guidance targets for the year. The combination of a measured ramp-up at Çöpler and delayed access to oxide material from Çakmaktepe, as well as the slower than expected recovery of ounces at Marigold, has deferred some production into 2023. Positively, since the quarter end, all four of our operations have delivered and are poised for strong production and free cash flow in the fourth quarter of 2022 and into 2023.”
|
(1) The Company reports non-GAAP financial measures including adjusted attributable net income (loss), adjusted attributable net income (loss) per share, cash generated by (used in) operating activities before working capital adjustments, free cash flow, free cash flow before changes in working capital, net cash (debt), cash costs and AISC per ounce sold (a common measure in the mining industry), to manage and evaluate its operating performance at its mines. See “Cautionary Note Regarding Non-GAAP Financial Measures” for an explanation of these financial measures and a reconciliation of these financial measures to the most comparable GAAP financial measures. |
Third Quarter 2022 Highlights (1):
(All figures are in U.S. dollars unless otherwise noted)
- Operating performance: Delivered third quarter production of 106,919 gold equivalent ounces at production costs of $1,099 per gold equivalent ounce and AISC of $1,901 per gold equivalent ounce, reflecting the inclusion of $31.1 million of cash costs incurred at Çöpler during the suspension. Year-to-date production is 441,164 gold equivalent ounces at production costs of $955 per gold equivalent ounce and AISC of $1,331 per gold equivalent ounce. Despite the expectations of a strong fourth quarter, full year production guidance has been revised to gold equivalent production of 620,000 to 655,000 ounces. Reflecting the lower production guidance, production costs have increased to $960 to $990 per ounce and AISC guidance has increased to $1,315 to $1,345 per gold equivalent ounce.
- Financial results: Attributable net loss in the third quarter was $25.8 million, or $0.12 per diluted share, and adjusted attributable net loss was $13.5 million, or $0.07 per diluted share. For the nine months ended September 30, 2022, operating cash flow was $42.8 million and free cash flow was $(73.4) million. Cash generated by operating activities before working capital adjustments over the nine months ended September 30, 2022, was $212.7 million, and free cash flow before working capital adjustments was $96.5 million. Strong fourth quarter production is expected to feature a drawdown of inventories that benefits quarterly free cash flow generation.
- Execution of peer-leading capital returns program: In the third quarter, SSR Mining returned nearly $100.0 million to shareholders, consisting of $14.3 million in dividends and $85.4 million in share repurchases. Since the Normal Course Issuer Bid (“NCIB”) program’s inception on June 20, 2022, the Company purchased a total of 6,053,126 shares at an average price of $16.53 per share for total consideration of approximately $100.0 million. In addition, the Board declared a quarterly cash dividend of $0.07 per share to be paid on December 19, 2022. Including the December 19th dividend, the Company is expected to return approximately $160.0 million to shareholders in 2022 or a yield of approximately 5.5%.
- Resilient balance sheet: At the end of the third quarter, the Company had a cash and cash equivalents balance of $748.5 million, after $53.4 million in scheduled debt repayments, $44.4 million in dividend payments to equity shareholders, $100.0 million in share repurchases, and $34.5 million in dividends to joint venture partners in 2022. Non-GAAP net cash totals $464.8 million as of September 30, 2022.
- Çöpler production restarted late September: Received the required regulatory approvals from Türkiye’s government authorities on September 22nd, 2022 and subsequently restarted all operations. Maintenance previously scheduled for the fourth quarter of 2022 was accelerated and completed during the third quarter, including scheduled partial relining of the face bricks in Autoclave 1. With this maintenance work now complete, no major scheduled sulfide plant maintenance shutdowns are planned at Çöpler for the remainder of 2022. Due to the measured ramp-up of operations at the sulfide plant and the later than expected access to oxide ounces from Çakmaktepe in the third quarter, Çöpler’s full year production guidance has been revised to 180,000 to 190,000 ounces at production costs of $1,000 to $1,030 per ounce and AISC of $1,345 to $1,375 per ounce.
- Marigold stacked 65,000 recoverable ounces in third quarter; record ounces stacked in October: Produced 52,236 ounces of gold in the third quarter, in line with expectations for a fourth quarter weighted production profile. Higher grade ore stacked in the second and third quarters of 2022, along with record recoverable ounces stacked in October, are expected to support strong quarterly production at Marigold in the fourth quarter and into 2023. Despite this strong close to the year, some of the higher grade ounces stacked in the second half of 2022 are not expected to be recovered until 2023. As a result, Marigold’s full year production guidance has been revised to 195,000 to 205,000 ounces at production costs of $1,065 to $1,095 per ounce and AISC of $1,410 to $1,440 per ounce.
- Seabee underground development accelerated to access high grade ounces: Produced 20,493 ounces of gold in the third quarter at production costs of $908 per ounce and AISC of $1,304 per ounce as Seabee accelerated underground development in order to access higher grade ore in the fourth quarter. Seabee is on track for the lower end of its 150,000 to 160,000 ounces production guidance at production costs of $455 to $485 per ounce and AISC of $715 to $745 per ounce.
- Puna continues to deliver strong mill performance: Produced 2.7 million ounces of silver at production costs of $15.47 per ounce of silver in the third quarter and AISC of $15.91 per ounce of silver. Throughput averaged more than 4,700 tonnes per day during the quarter. Puna is on track for full year guidance of 8.25 to 8.75 million ounces of silver at production costs of $17.25 to $17.75 per ounce and AISC of $15.00 to $15.50 per ounce.
- Exploration activities progressed across the portfolio: The Company recently announced exploration results from Çakmaktepe Extension (“Ardich”), highlighting strong results that support potential Mineral Reserve and Resource growth expected to be included in the Çöpler technical report summary in 2023. In addition, the Company expects to release exploration results from resource expansion and development programs across the portfolio in the fourth quarter of 2022.
- Completed the sale of the Pitarrilla project: During the quarter, the Company closed the sale of the Pitarrilla project to Endeavour Silver. As consideration for the sale, SSR Mining received $35 million in cash, $35 million (2) in shares of Endeavour Silver, and a 1.25% net smelter return royalty on the Pitarrilla property. The sale was originally announced on January 13, 2022.
- Consolidated ownership of the Çöpler District: Subsequent to the quarter, the Company announced an agreement to acquire an additional 30% ownership interest in the Kartaltepe Mining Joint Venture at the Çöpler District from partner Lidya Mining for total consideration of $150 million in cash, streamlining operating, financial and exploration activities across the Ҫӧpler District while creating tangible synergies. The transaction is expected to be completed in the fourth quarter of 2022. Upon completion of the transaction, SSR Mining will own 80% of the entirety of the Çöpler District.
|
(2) The fair value of the common shares of Endeavour Silver on July 6, 2022 was $25.6 million. See Note 3 to the Condensed Consolidated Financial Statements in SSR Mining’s Form 10-Q filed November 8, 2022 for more information. |
Full Year 2022 Guidance (1)
|
(operating guidance 100% basis) (3) |
Çöpler |
Marigold |
Seabee |
Puna |
Corporate |
Total |
|||||||
|
Gold Production |
koz |
180 — 190 |
195 — 205 |
150 — 160 |
— |
— |
525 — 555 |
||||||
|
Silver Production |
Moz |
— |
— |
— |
8.25 — 8.75 |
— |
8.25 — 8.75 |
||||||
|
Gold Equivalent Production |
koz |
180 — 190 |
195 — 205 |
150 — 160 |
95 — 100 |
— |
620 — 655 |
||||||
|
Production Costs per Ounce (GAAP) (4,5) |
$/oz |
1,000 — 1,030 |
1,065 — 1,095 |
455 — 485 |
17.25 — 17.75 |
— |
960 — 990 |
||||||
|
Cash Cost per Ounce (non-GAAP) (4,5) |
$/oz |
985 — 1,015 |
1,065 — 1,095 |
455 — 485 |
13.00 — 13.50 |
— |
900 — 930 |
||||||
|
Sustaining Capital Expenditures (6) |
$M |
34 |
57 |
43 |
16 |
— |
150 |
||||||
|
Sustaining Exploration Expenditures |
$M |
3 |
6 |
1 |
3 |
— |
13 |
||||||
|
Care & Maintenance |
$M |
31 |
— |
— |
— |
— |
31 |
||||||
|
General & Administrative |
$M |
— |
— |
— |
— |
65 |
65 |
||||||
|
All-In Sustaining Cost per Ounce (non-GAAP) (4,5) |
$/oz |
1,345 — 1,375 |
1,410 – 1,440 |
715 — 745 |
15.00 — 15.50 |
— |
1,315 – 1,345 |
||||||
|
Growth Capital Expenditures |
$M |
3 |
— |
5 |
— |
— |
8 |
||||||
|
Growth Exploration and Resource Development Expenditures (7) |
$M |
16 |
18 |
14 |
— |
5 |
53 |
||||||
|
Total Growth Capital |
$M |
19 |
18 |
19 |
— |
5 |
61 |
||||||
|
(3) |
Figures may not add due to rounding. Figures are reported on a 100% basis. Çöpler is 80% owned by SSR Mining. |
|
(4) |
SSR Mining reports the non-GAAP financial measures of cash costs and AISC per payable ounce of gold and silver sold to manage and evaluate operating performance at Çöpler, Marigold, Seabee and Puna. See “Cautionary Note Regarding Non-GAAP Measures” at the end of this press release for an explanation of these financial measures and a reconciliation of these financial measures to production costs, which is the most comparable GAAP financial measures. AISC includes reclamation cost accretion and amortization and certain lease payments. |
|
(5) |
Gold ounces sold are used in the calculation for Çöpler, Marigold and Seabee costs per ounce and silver ounces sold are used in the calculation for Puna costs per ounce. Gold equivalent ounces sold are used in the calculation for total costs per ounce. |
|
(6) |
Excludes sustaining exploration and evaluation expenditures. Includes approximately $9.0 million in lease payments at Çöpler. Includes mine development at Seabee. |
|
(7) |
Growth exploration and resource development expenditures are shown on a 100% basis, of which SSR Mining attributable amount totals $50 million. |
Ҫӧpler: Production restarted at Ҫӧpler at the end of September following the suspension. During this time, the Company accelerated and completed planned maintenance in Ҫӧpler’s sulfide plant that had been previously planned for the fourth quarter of 2022, which included scheduled partial relining of the face bricks in Autoclave 1. With this maintenance work now complete, no major scheduled sulfide plant maintenance shutdowns are planned for Ҫӧpler for the remainder of 2022.
For the month ended October 31, 2022, production ramped up to approximately 18,000 ounces. Despite this strong start to the quarter, production guidance has been revised downward to 180,000 to 190,000 ounces of gold as a result of the measured ramp-up of operations and the later than expected access to oxide ounces at Çakmaktepe in the third quarter. Full year production cost guidance is now of $1,000 to $1,030 per ounce and AISC of $1,345 to $1,375 per ounce. Oxide production previously expected in the fourth quarter of 2022 is now expected to be recovered in the first quarter of 2023.
Marigold: In third quarter of 2022, Marigold stacked 65,000 recoverable ounces, bringing total recoverable ounces stacked in the second and third quarters of 2022 to more than 135,000 ounces at a recoverable grade of 0.63 g/t. However, given reduced shovel availability and the continued delay in heap leach recovery due to finer ore from the north pits, some of the ounces previously expected in the fourth quarter are now likely to be recovered in 2023. As such, Marigold’s full year production guidance has been revised to 195,000 to 205,000 ounces of gold at production costs of $1,065 to $1,095 per ounce and AISC of $1,410 to $1,440 per ounce.
Seabee: During the third quarter, the Company accelerated development to access a high grade area of the Santoy Reserves that is expected to drive strong production in the fourth quarter of 2022. Seabee remains on track for the lower end its 150,000 to 160,000 ounces production guidance at production costs of $455 to $485 per ounce and AISC of $715 to $745 per ounce.
Puna: With mill throughput targeted to remain at or above 4,500 tonnes per day for the rest of 2022, Puna is on track for production guidance of 8.25 to 8.75 million ounces of silver at improved production costs of $17.25 to $17.75 per ounce and AISC of $15.00 to $15.50 per ounce.
Financial and Operating Highlights
A summary of the Company’s consolidated financial and operating results for the three and nine months ended September 30, 2022 and September 30, 2021 are presented below:
|
Three Months Ended |
Nine Months Ended |
|||||||||||
|
(in thousands of US dollars, except per share data) |
September 30 |
September 30 |
||||||||||
|
2022 |
2021 |
2022 |
2021 |
|||||||||
|
Financial Results |
||||||||||||
|
Revenue |
$ |
166,627 |
$ |
322,846 |
$ |
841,656 |
$ |
1,066,280 |
||||
|
Operating income |
$ |
(35,064) |
$ |
92,659 |
$ |
150,901 |
$ |
325,559 |
||||
|
Net income (loss) |
$ |
(28,372) |
$ |
64,179 |
$ |
115,251 |
$ |
269,423 |
||||
|
Net income (loss) attributable to equity holders of SSR Mining |
$ |
(25,793) |
$ |
57,060 |
$ |
100,256 |
$ |
240,641 |
||||
|
Basic net income (loss) per share attributable to equity holders of SSR Mining |
$ |
(0.12) |
$ |
0.27 |
$ |
0.48 |
$ |
1.11 |
||||
|
Diluted net income (loss) per share attributable to equity holders of SSR Mining |
$ |
(0.12) |
$ |
0.26 |
$ |
0.46 |
$ |
1.06 |
||||
|
Adjusted attributable net income (loss) (8) |
$ |
(13,533) |
$ |
88,265 |
$ |
119,234 |
$ |
303,498 |
||||
|
Adjusted basic attributable net income (loss) per share (8) |
$ |
(0.07) |
$ |
0.41 |
$ |
0.57 |
$ |
1.40 |
||||
|
Adjusted diluted attributable net income (loss) per share (8) |
$ |
(0.07) |
$ |
0.40 |
$ |
0.55 |
$ |
1.34 |
||||
|
Cash generated by (used in) operating activities before changes in working capital (8) |
$ |
(23,666) |
$ |
144,204 |
$ |
212,703 |
$ |
481,063 |
||||
|
Cash generated by (used in) operating activities |
$ |
(52,226) |
$ |
161,124 |
$ |
42,799 |
$ |
424,380 |
||||
|
Cash used in investing activities |
$ |
(12,238) |
$ |
(44,049) |
$ |
(69,983) |
$ |
(130,499) |
||||
|
Cash used in financing activities |
$ |
(121,951) |
$ |
(158,519) |
$ |
(238,634) |
$ |
(290,389) |
||||
|
Operating Results |
||||||||||||
|
Gold produced (oz) |
76,462 |
157,613 |
368,972 |
498,402 |
||||||||
|
Gold sold (oz) |
72,035 |
156,343 |
375,543 |
503,195 |
||||||||
|
Silver produced (‘000 oz) |
2,738 |
2,184 |
6,008 |
5,966 |
||||||||
|
Silver sold (‘000 oz) |
2,234 |
1,486 |
5,766 |
5,349 |
||||||||
|
Lead produced (‘000 lb) (10) |
11,390 |
10,571 |
27,582 |
26,377 |
||||||||
|
Lead sold (‘000 lb) (10) |
9,169 |
6,843 |
28,255 |
20,630 |
||||||||
|
Zinc produced (‘000 lb) (10) |
1,590 |
3,420 |
4,940 |
10,434 |
||||||||
|
Zinc sold (‘000 lb) (10) |
1,050 |
1,964 |
5,546 |
5,896 |
||||||||
|
Gold equivalent produced (oz) (11) |
106,919 |
186,941 |
441,164 |
583,316 |
||||||||
|
Gold equivalent sold (oz) (11) |
96,885 |
176,299 |
444,827 |
579,331 |
||||||||
|
Average realized gold price ($/oz sold) |
$ |
1,710 |
$ |
1,792 |
$ |
1,871 |
$ |
1,804 |
||||
|
Average realized silver price ($/oz sold) |
$ |
18.98 |
$ |
24.06 |
$ |
22.99 |
$ |
25.67 |
||||
|
Production costs per gold equivalent ounce sold (11) |
$ |
1,099 |
$ |
876 |
$ |
955 |
$ |
834 |
||||
|
Cash cost per gold equivalent ounce sold (8, 11) |
$ |
1,051 |
$ |
713 |
$ |
891 |
$ |
698 |
||||
|
AISC per gold equivalent ounce sold (8, 11) |
$ |
1,901 |
$ |
948 |
$ |
1,331 |
$ |
952 |
||||
|
Financial Position |
September 30, 2022 |
December 31, 2021 |
||||||||||
|
Cash and cash equivalents |
$ |
748,476 |
$ |
1,017,562 |
||||||||
|
Current assets |
$ |
1,430,736 |
$ |
1,600,314 |
||||||||
|
Total assets |
$ |
4,995,258 |
$ |
5,211,438 |
||||||||
|
Current liabilities |
$ |
247,081 |
$ |
283,882 |
||||||||
|
Total liabilities |
$ |
1,000,680 |
$ |
1,158,921 |
||||||||
|
Working capital (9) |
$ |
1,183,655 |
$ |
1,316,432 |
||||||||
|
(8) |
The Company reports non-GAAP financial measures including adjusted attributable net income (loss), adjusted attributable net income (loss) per share, cash generated by (used in) operating activities before changes in working capital, cash costs and AISC per ounce sold to manage and evaluate its operating performance at its mines. See “Non-GAAP Financial Measures” at the end of this press release for an explanation of these financial measures and a reconciliation of these financial measures to net income (loss), production costs, and cash generated by (used in) operating activities, which are the most comparable GAAP financial measures. |
|
(9) |
Working capital is defined as current assets less current liabilities. |
|
(10) |
Data for lead production and sales relate only to lead in lead concentrate. Data for zinc production and sales relate only to zinc in zinc concentrate. |
|
(11) |
Gold equivalent ounces are calculated multiplying the silver ounces by the ratio of the silver price to the gold price, using the average London Bullion Market Association (“LBMA”) prices for the period. The Company does not include by-products in the gold equivalent ounce calculations. |
Çöpler, Türkiye
(amounts presented on 100% basis)
|
Three Months Ended |
Nine Months Ended |
|||||||||||
|
September 30 |
September 30 |
|||||||||||
|
Operating Data |
2022 |
2021 |
2022 |
2021 |
||||||||
|
Gold produced (oz) |
3,733 |
82,975 |
125,763 |
237,207 |
||||||||
|
Gold sold (oz) |
2,591 |
80,054 |
132,862 |
239,428 |
||||||||
|
Ore mined (kt) |
70 |
2,194 |
1,754 |
7,480 |
||||||||
|
Waste removed (kt) |
406 |
4,065 |
11,715 |
10,891 |
||||||||
|
Total material mined (kt) |
476 |
6,259 |
13,469 |
18,370 |
||||||||
|
Strip ratio |
5.8 |
1.9 |
6.7 |
1.5 |
||||||||
|
Ore stacked (kt) |
— |
333 |
210 |
1,691 |
||||||||
|
Gold grade stacked (g/t) |
— |
0.87 |
0.87 |
1.25 |
||||||||
|
Ore milled (kt) |
64 |
613 |
1,320 |
1,716 |
||||||||
|
Gold mill feed grade (g/t) |
2.27 |
3.81 |
2.91 |
3.56 |
||||||||
|
Gold recovery (%) |
86.0 |
90.7 |
87.1 |
91.0 |
||||||||
|
Average realized gold price ($/oz sold) |
$ |
1,641 |
1,793 |
$ |
1,869 |
$ |
1,805 |
|||||
|
Production costs ($/oz gold sold) |
$ |
118 |
822 |
$ |
948 |
$ |
843 |
|||||
|
Cash costs ($/oz gold sold) (12) |
$ |
160 |
589 |
$ |
928 |
$ |
619 |
|||||
|
AISC ($/oz gold sold) (12) |
$ |
14,972 |
724 |
$ |
1,351 |
$ |
761 |
|||||
|
(12) |
The Company reports the non-GAAP financial measures of cash costs and AISC per ounce of gold sold to manage and evaluate operating performance at Çöpler. See “Non-GAAP Financial Measures” for an explanation of these financial measures and a reconciliation to production costs, which are the comparable GAAP financial measure. For the three and nine months ended September 30, 2022, cash costs and AISC per ounce of gold sold include the impact of any fair value adjustment on acquired inventories. For the three and nine months ended September 30, 2021, cash costs and AISC per ounce of gold sold exclude the impact of any fair value adjustment on acquired inventories. |
For the three months ended September 30, 2022 and 2021, Çöpler produced 3,733 and 82,975 ounces of gold, respectively. For the nine months ended September 30, 2022 and 2021, Çöpler produced 125,763 and 237,207 ounces of gold, respectively. Çöpler mine operations were suspended in late June until late September in response to a leak of leach solution containing diluted cyanide at the Çöpler mine site on June 21, 2022. After completing improvement initiatives in early August, the Company received the required regulatory approvals on September 22, 2022 from Türkiye’s Government authorities and all operations were subsequently restarted. Production costs were $118 per ounce in the third quarter, while AISC were $14,972 per ounce reflecting the limited production as a result of the temporary suspension.
During the quarter, the Company accelerated and completed planned maintenance in Ҫӧpler’s sulfide plant that had been previously planned for the fourth quarter of 2022, which included scheduled partial relining of the face bricks in Autoclave 1. With this maintenance work now complete, no major scheduled sulfide plant maintenance shutdowns are planned for Ҫӧpler for the remainder of 2022. For the year ended December 31, 2022, Ҫӧpler is expected to produce 180,000 to 190,000 ounces of gold at production costs of $1,000 to $1,030 per ounce and AISC of $1,345 to $1,375 per ounce.
Marigold, USA
|
Three Months Ended |
Nine Months Ended |
|||||||||||
|
September 30 |
September 30 |
|||||||||||
|
Operating Data |
2022 |
2021 |
2022 |
2021 |
||||||||
|
Gold produced (oz) |
52,236 |
52,049 |
131,793 |
177,877 |
||||||||
|
Gold sold (oz) |
49,744 |
53,339 |
132,681 |
178,351 |
||||||||
|
Ore mined (kt) |
4,279 |
4,052 |
13,200 |
15,521 |
||||||||
|
Waste removed (kt) |
15,922 |
21,346 |
56,286 |
58,664 |
||||||||
|
Total material mined (kt) |
20,201 |
25,398 |
69,486 |
74,185 |
||||||||
|
Strip ratio |
3.7 |
5.3 |
4.3 |
3.8 |
||||||||
|
Ore stacked (kt) |
4,279 |
4,052 |
13,200 |
15,521 |
||||||||
|
Gold grade stacked (g/t) |
0.59 |
0.39 |
0.54 |
0.41 |
||||||||
|
Average realized gold price ($/oz sold) |
$ |
1,712 |
$ |
1,793 |
$ |
1,862 |
$ |
1,802 |
||||
|
Production costs ($/oz gold sold) |
$ |
1,079 |
$ |
943 |
$ |
1,077 |
$ |
872 |
||||
|
Cash costs ($/oz gold sold) (13) |
$ |
1,081 |
$ |
943 |
$ |
1,078 |
$ |
870 |
||||
|
AISC ($/oz gold sold) (13) |
$ |
1,444 |
$ |
1,127 |
$ |
1,482 |
$ |
1,140 |
||||
|
(13) |
The Company reports the non-GAAP financial measures of cash costs and AISC per ounce of gold sold to manage and evaluate operating performance at Çöpler. See “Non-GAAP Financial Measures” for an explanation of these financial measures and a reconciliation to production costs, which are the comparable GAAP financial measure. For the three and nine months ended September 30, 2022, cash costs and AISC per ounce of gold sold include the impact of any fair value adjustment on acquired inventories. For the three and nine months ended September 30, 2021, cash costs and AISC per ounce of gold sold exclude the impact of any fair value adjustment on acquired inventories. |
For the three months ended September 30, 2022 and 2021, Marigold produced 52,236 and 52,049 ounces of gold, respectively. For the nine months ended September 30, 2022 and 2021, Marigold produced 131,793 and 177,877 ounces of gold, respectively. During the third quarter, production costs were $1,079 per ounce and AISC were $1,444. Marigold stacked 65,000 recoverable ounces in the third quarter as mining of higher grade ore continued in the quarter.
For the year ended December 31, 2022, Marigold’s production guidance has been revised to 195,000 to 205,000 ounces of gold at production costs of $1,065 to $1,095 per ounce and AISC of $1,410 to $1,440 per ounce.
Seabee, Canada
|
Three Months Ended |
Nine Months Ended |
|||||||||||
|
September 30 |
September 30 |
|||||||||||
|
Operating Data |
2022 |
2021 |
2022 |
2021 |
||||||||
|
Gold produced (oz) |
20,493 |
22,589 |
111,416 |
83,318 |
||||||||
|
Gold sold (oz) |
19,700 |
22,950 |
110,000 |
85,416 |
||||||||
|
Ore mined (kt) |
108 |
101 |
307 |
287 |
||||||||
|
Waste removed (kt) |
73 |
76 |
201 |
209 |
||||||||
|
Total material mined (kt) |
181 |
177 |
508 |
496 |
||||||||
|
Ore milled (kt) |
101 |
91 |
295 |
269 |
||||||||
|
Gold mill feed grade (g/t) |
6.07 |
7.70 |
11.84 |
9.75 |
||||||||
|
Gold recovery (%) |
97.3 |
98.0 |
98.2 |
98.2 |
||||||||
|
Average realized gold price ($/oz sold) |
$ |
1,714 |
$ |
1,786 |
$ |
1,884 |
$ |
1,803 |
||||
|
Production costs ($/oz gold sold) |
$ |
908 |
$ |
657 |
$ |
485 |
$ |
551 |
||||
|
Cash costs ($/oz gold sold) (14) |
$ |
910 |
$ |
606 |
$ |
486 |
$ |
513 |
||||
|
AISC ($/oz gold sold) (14) |
$ |
1,304 |
$ |
914 |
$ |
735 |
$ |
830 |
||||
|
(14) |
The Company reports the non-GAAP financial measures of cash costs and AISC per ounce of gold sold to manage and evaluate operating performance at Seabee. See “Non-GAAP Financial Measures” for an explanation of these financial measures and a reconciliation to production costs, which are the comparable GAAP financial measure. |
For the three months ended September 30, 2022 and 2021, Seabee produced 20,493 and 22,589 ounces of gold, respectively. During the third quarter, the Company accelerated underground development to access another high grade area of the Santoy Reserves. For the nine months ended September 30, 2022 and 2021, Seabee produced 111,416 and 83,318 ounces of gold, respectively. The increase in gold production during the first nine months of 2022 compared to the prior year was the result of a 21.4% increase in mill feed grade to 11.84 g/t and increased mine and mill productivity levels. Exploration and definition work is continuing at the high grade zone mined in the first quarter which, if successful, could enable mining in this area in 2023. During the third quarter, production costs were $908 per ounce and AISC were $1,304.
For the year ended December 31, 2022, Seabee remains on track for the lower end of its 150,000 to 160,000 ounce production guidance at production costs of $455 to $485 per ounce and AISC of $715 to $745 per ounce.
Puna, Argentina
|
Three Months Ended |
Nine Months Ended |
|||||||||||
|
September 30 |
September 30 |
|||||||||||
|
Operating Data |
2022 |
2021 |
2022 |
2021 |
||||||||
|
Silver produced (‘000 oz) |
2,738 |
2,184 |
6,008 |
5,966 |
||||||||
|
Silver sold (‘000 oz) |
2,234 |
1,486 |
5,766 |
5,349 |
||||||||
|
Lead produced (‘000 lb) |
11,390 |
10,571 |
27,582 |
26,377 |
||||||||
|
Lead sold (‘000 lb) |
9,169 |
6,843 |
28,255 |
20,630 |
||||||||
|
Zinc produced (‘000 lb) |
1,590 |
3,420 |
4,940 |
10,434 |
||||||||
|
Zinc sold (‘000 lb) |
1,050 |
1,964 |
5,546 |
5,896 |
||||||||
|
Gold equivalent sold (‘000 oz) (15) |
24,850 |
19,956 |
69,284 |
76,136 |
||||||||
|
Ore mined (kt) |
544 |
437 |
1,396 |
1,051 |
||||||||
|
Waste removed (kt) |
2,228 |
2,519 |
6,617 |
7,165 |
||||||||
|
Total material mined (kt) |
2,772 |
2,956 |
8,013 |
8,216 |
||||||||
|
Strip ratio |
4.1 |
5.8 |
4.7 |
6.8 |
||||||||
|
Ore milled (kt) |
431 |
422 |
1,223 |
1,214 |
||||||||
|
Silver mill feed grade (g/t) |
206.5 |
167.0 |
159.9 |
160.0 |
||||||||
|
Lead mill feed grade (%) |
1.29 |
1.20 |
1.11 |
1.07 |
||||||||
|
Zinc mill feed grade (%) |
0.43 |
0.54 |
0.42 |
0.60 |
||||||||
|
Silver mill recovery (%) |
95.8 |
96.3 |
95.6 |
95.7 |
||||||||
|
Lead mill recovery (%) |
92.7 |
94.4 |
92.5 |
92.4 |
||||||||
|
Zinc mill recovery (%) |
38.9 |
67.9 |
43.7 |
64.9 |
||||||||
|
Average realized silver price ($/oz sold) |
$ |
18.98 |
$ |
24.06 |
$ |
22.99 |
$ |
25.67 |
||||
|
Production Costs ($/oz sold) |
$ |
15.47 |
$ |
15.74 |
$ |
17.82 |
$ |
14.72 |
||||
|
Cash costs ($/oz silver sold) (16) |
$ |
13.33 |
$ |
9.65 |
$ |
13.31 |
$ |
10.68 |
||||
|
AISC ($/oz silver sold) (16) |
$ |
15.91 |
$ |
11.65 |
$ |
15.32 |
$ |
12.73 |
||||
|
(15) |
Gold equivalent ounces are calculated multiplying the silver ounces by the ratio of the silver price to the gold price, using the average LBMA prices for the period. The Company does not include by-products in the gold equivalent ounce calculations. |
|
(16) |
The Company reports the non-GAAP financial measures of cash costs and AISC per ounce of silver sold to manage and evaluate operating performance at Puna. See “Non-GAAP Financial Measures” for an explanation of these financial measures and a reconciliation to production costs, which are the comparable GAAP financial measure. |
For the three months ended September 30, 2022 and 2021, Puna produced 2.7 million and 2.2 million ounces of silver, respectively. The year-over-year increase is primarily driven by the higher grade of silver ore processed. For the nine months ended September 30, 2022 and 2021, Puna produced 6.0 million ounces of silver in both periods. Third quarter production costs were $15.47 per ounce of silver sold and AISC were $15.91 per ounce of silver sold.
During the quarter, the Company restarted exploration drilling at Puna for the first time since 2018. SSR Mining’s exploration team has identified a number of in-pit and near mine targets that, if successful, could provide mine life extension opportunities. The Company is on track for production guidance of 8.25 to 8.75 million ounces of silver at improved production costs of $17.25 to $17.75 per ounce and AISC of $15.00 to $15.50 per ounce.
Conference Call Information
This news release should be read in conjunction with the Company’s Quarterly Report on Form 10-Q for the quarter ended September 30, 2022, filed with the U.S. Securities and Exchange Commission (the “SEC”) and available on the SEC website at www.sec.gov or www.ssrmining.com.
- Conference call and webcast: Tuesday, November 8, 2022, at 5:00 pm EST.
|
Toll-free in U.S. and Canada: |
+1 (800) 319-4610 |
||||
|
All other callers: |
+1 (604) 638-5340 |
||||
|
Webcast: |
http://ir.ssrmining.com/investors/events |
- The conference call will be archived and available on our website. Audio replay will be available for two weeks by calling:
|
Toll-free in U.S. and Canada: |
+1 (855) 669-9658, replay code 9373 |
|||||
|
All other callers: |
+1 (412) 317-0088, replay code 9373 |
Dividend Declaration
On November 8, 2022 the Board of Directors declared a quarterly cash dividend of $0.07 per common share, payable on December 19, 2022 to holders of record at the close of business on November 18, 2022. This dividend qualifies as an eligible dividend for Canadian income tax purposes.
The dividend payment applies to holders of SSR Mining’s common shares, which trade on the Toronto Stock Exchange and the Nasdaq under the symbol SSRM, and to holders of its CHESS Depositary Interests (CDIs), which trade on the Australian Securities Exchange under the symbol SSR. Each CDI confers a beneficial interest in one common share. Therefore, CDI holders are entitled to a dividend calculated on the same basis as the holders of SSR Mining’s common shares.
SSR Mining has sought and been granted a temporary waiver of certain of the ASX Settlement Operating Rules. Under the authority of the waiver, the processing of conversions of common shares to CDIs, or CDIs to common shares, lodged on or after or after November 17, 2022, will be deferred until after the record date of November 18, 2022. The key dates with respect to the dividend are as follows:
|
Last date for processing requests to convert CDIs into common shares and to convert common shares into CDIs before the record date for the dividend |
November 16, 2022 |
|
|
CDIs trade on the ASX on an ex‐dividend basis |
November 17, 2022 |
|
|
Common shares trade on the TSX and Nasdaq on an ex‐dividend basis |
November 17, 2022 |
|
|
Record date for the dividend |
November 18, 2022 |
|
|
Processing recommences for requests to convert CDIs into common shares and to convert common shares into CDIs |
November 21, 2022 |
|
|
Common share dividend payment date (in Canada and the United States) |
December 19, 2022 |
|
|
Payment of dividend to CDI holders (in Australia) |
December 20, 2022 |
Payments to Canadian shareholders will be made in Canadian dollars based on the exchange rate on the record date as reported by the Bank of Canada. Payments to other shareholders will be made in U.S. dollars. For CDI holders, payments will be made in Australian dollars, and it is expected to be based on the prevailing exchange rate sourced from the wholesale foreign exchange market on or around 5 business days after the record date.
About SSR Mining
SSR Mining Inc. is a leading, free cash flow focused gold company with four producing operations located in the USA, Türkiye, Canada, and Argentina, combined with a global pipeline of high-quality development and exploration assets. In 2021, the four operating assets produced approximately 794,000 gold-equivalent ounces. SSR Mining is listed under the ticker symbol SSRM on the NASDAQ and the TSX, and SSR on the ASX.
SSR Mining Contacts:
F. Edward Farid, Executive Vice President, Chief Corporate Development Officer
Alex Hunchak, Director, Corporate Development and Investor Relations
SSR Mining Inc.
E-Mail: [email protected]
Phone: +1 (888) 338-0046
To receive SSR Mining’s news releases by e-mail, please register using the SSR Mining website at www.ssrmining.com.
Cautionary Note Regarding Forward-Looking Information and Statements:
Except for statements of historical fact relating to us, certain statements contained in this news release constitute forward-looking information, future oriented financial information, or financial outlooks (collectively “forward-looking information”) within the meaning of applicable securities laws. Forward-looking information may be contained in this document and our other public filings. Forward-looking information relates to statements concerning our outlook and anticipated events or results and, in some cases, can be identified by terminology such as “may”, “will”, “could”, “should”, “expect”, “plan”, “anticipate”, “believe”, “intend”, “estimate”, “projects”, “predict”, “potential”, “continue” or other similar expressions concerning matters that are not historical facts.
Forward-looking information and statements in this news release are based on certain key expectations and assumptions made by us. Although we believe that the expectations and assumptions on which such forward-looking information and statements are based are reasonable, undue reliance should not be placed on the forward-looking information and statements because we can give no assurance that they will prove to be correct. Forward-looking information and statements are subject to various risks and uncertainties which could cause actual results and experience to differ materially from the anticipated results or expectations expressed in this news release. The key risks and uncertainties include, but are not limited to: local and global political and economic conditions; governmental and regulatory requirements and actions by governmental authorities, including changes in government policy, government ownership requirements, changes in environmental, tax and other laws or regulations and the interpretation thereof; developments with respect to the COVID-19 pandemic, including the duration, severity and scope of the pandemic and potential impacts on mining operations; and other risk factors detailed from time to time in our reports filed with the Securities and Exchange Commission on EDGAR and the Canadian securities regulatory authorities on SEDAR.
Forward-looking information and statements in this news release include any statements concerning, among other things: forecasts and outlook; preliminary cost reporting in this document; timing, production, operating, cost, and capital expenditure guidance; our operational and development targets and catalysts and the impact of any suspensions on operations; the results of any gold reconciliations; the ability to discover additional oxide gold ore; the generation of free cash flow and payment of dividends; matters relating to proposed exploration; communications with local stakeholders; maintaining community and government relations; negotiations of joint ventures; negotiation and completion of transactions; commodity prices; Mineral Resources, Mineral Reserves, conversion of Mineral Resources, realization of Mineral Reserves, and the existence or realization of Mineral Resource estimates; the development approach; the timing and amount of future production; the timing of studies, announcements, and analysis; the timing of construction and development of proposed mines and process facilities; capital and operating expenditures; economic conditions; availability of sufficient financing; exploration plans; receipt of regulatory approvals; expectations regarding COVID-19, its ongoing impact on us and any interruptions it may cause on our operations; renewal of the NCIB program; and any and all other timing, exploration, development, operational, financial, budgetary, economic, legal, social, environmental, regulatory, and political matters that may influence or be influenced by future events or conditions.
Such forward-looking information and statements are based on a number of material factors and assumptions, including, but not limited in any manner to, those disclosed in any other of our filings on EDGAR and SEDAR, and include: the inherent speculative nature of exploration results; the ability to explore; communications with local stakeholders; maintaining community and governmental relations; status of negotiations of joint ventures; weather conditions at our operations; commodity prices; the ultimate determination of and realization of Mineral Reserves; existence or realization of Mineral Resources; the development approach; availability and receipt of required approvals, titles, licenses and permits; sufficient working capital to develop and operate the mines and implement development plans; access to adequate services and supplies; foreign currency exchange rates; interest rates; access to capital markets and associated cost of funds; availability of a qualified work force; ability to negotiate, finalize, and execute relevant agreements; lack of social opposition to our mines or facilities; lack of legal challenges with respect to our properties; the timing and amount of future production; the ability to meet production, cost, and capital expenditure targets; timing and ability to produce studies and analyses; capital and operating expenditures; economic conditions; availability of sufficient financing; the ultimate ability to mine, process, and sell mineral products on economically favorable terms; and any and all other timing, exploration, development, operational, financial, budgetary, economic, legal, social, geopolitical, regulatory and political factors that may influence future events or conditions. While we consider these factors and assumptions to be reasonable based on information currently available to us, they may prove to be incorrect.
The above list is not exhaustive of the factors that may affect any of the Company’s forward-looking information. You should not place undue reliance on forward-looking information and statements. Forward-looking information and statements are only predictions based on our current expectations and our projections about future events. Actual results may vary from such forward-looking information for a variety of reasons including, but not limited to, risks and uncertainties disclosed in our filings on our website at www.ssrmining.com, on SEDAR at www.sedar.com, on EDGAR at www.sec.gov and on the ASX at www.asx.com.au and other unforeseen events or circumstances. Other than as required by law, we do not intend, and undertake no obligation to update any forward-looking information to reflect, among other things, new information or future events. The information contained on, or that may be accessed through, our website is not incorporated by reference into, and is not a part of, this document.
Cautionary Note to U.S. Investors
This news release includes terms that comply with reporting standards in Canada under National Instrument 43-101 – Standards of Disclosure for Mineral Projects (“NI 43-101”), including the terms “Mineral Reserves” and “Mineral Resources”. NI 43-101 is a rule developed by the Canadian Securities Administrators that establishes standards for all public disclosure an issuer makes of scientific and technical information concerning mineral projects. The standards of NI 43-101 differ significantly from the requirements of the SEC. Accordingly, information concerning mineral deposits set forth herein may not be comparable with information made in accordance with U.S. standards.
Cautionary Note Regarding Non-GAAP Financial Measures
We have included certain non-GAAP financial measures to assist in understanding the Company’s financial results. The non-GAAP financial measures are employed by us to measure our operating and economic performance and to assist in decision-making, as well as to provide key performance information to senior management. We believe that, in addition to conventional measures prepared in accordance with GAAP, certain investors and other stakeholders will find this information useful to evaluate our operating and financial performance; however, these non-GAAP performance measures do not have any standardized meaning. These performance measures are intended to provide additional information and should not be considered in isolation or as a substitute for measures of performance prepared in accordance with GAAP. Our definitions of our non-GAAP financial measures may not be comparable to similarly titled measures reported by other companies. These non-GAAP measures should be read in conjunction with our consolidated financial statements.
Cash costs, AISC per ounce sold, adjusted attributable net income (loss), free cash flow, and net cash are Non-GAAP Measures with no standardized definition under U.S GAAP.
Non-GAAP Measure – Net Cash
Net cash and net debt are used by management and investors to measure the Company’s underlying operating performance. The Company believes that net cash is a useful measure for shareholders as it helps evaluate the strength of liquidity and available cash.
The following table provides a reconciliation of cash and cash equivalents to net cash:
|
As of |
||||||
|
(in thousands) |
September 30, 2022 |
December 31, 2021 |
||||
|
Cash and cash equivalents |
$ |
748,476 |
$ |
1,017,562 |
||
|
Restricted cash |
$ |
35,569 |
$ |
35,303 |
||
|
Total Cash |
$ |
784,045 |
$ |
1,052,865 |
||
|
Short and Long Term Portion of Term Loan |
$ |
87,500 |
$ |
140,000 |
||
|
Face Value of 2019 Convertible Note |
$ |
230,000 |
$ |
230,000 |
||
|
Other Debt |
$ |
1,751 |
$ |
1,450 |
||
|
Total Debt |
$ |
319,251 |
$ |
371,450 |
||
|
Net Cash (Debt) |
$ |
464,794 |
$ |
681,415 |
||
Non-GAAP Measure – Cash Costs and AISC
The Company uses cash costs per ounce of precious metals sold to monitor its operating performance internally. The most directly comparable measure prepared in accordance with GAAP is production costs. The Company believes this measure provides investors and analysts with useful information about its underlying cash costs of operations and the impact of by-product credits on its cost structure. The Company also believes it is a relevant metric used to understand its operating profitability and ability to generate cash flow. When deriving the production costs associated with an ounce of precious metal, the Company includes by-product credits. Thereby allowing management and other stakeholders to assess the net costs of gold and silver production. In calculating cash costs per ounce, the Company also excludes the impact of specific items that are significant, but not reflective of its underlying operations.
AISC includes total production costs incurred at the Company’s mining operations, which forms the basis of cash costs. Additionally, the Company includes sustaining capital expenditures, sustaining mine-site exploration and evaluation costs, reclamation cost accretion and amortization, and general and administrative expenses. This measure seeks to reflect the ongoing cost of gold and silver production from current operations; therefore, expansionary capital and non-sustaining expenditures are excluded. Certain other cash expenditures, including tax payments and financing costs are also excluded.
The Company believes that AISC represents the total costs of producing gold and silver from current operations and provides the Company and other stakeholders with additional information about its operating performance and ability to generate cash flows. It allows the Company to assess its ability to support capital expenditures and to sustain future production from the generation of operating cash flows.
When deriving the number of ounces of precious metal sold, the Company considers the physical ounces available for sale after the treatment and refining process, commonly referred to as payable metal, as this is what is sold to third parties.
The following tables provide a reconciliation of production costs to cash costs and AISC:
|
Three Months Ended September 30, 2022 |
||||||||||||||||||
|
(in thousands, unless otherwise noted) |
Çöpler |
Marigold |
Seabee |
Puna |
Corporate |
Total |
||||||||||||
|
Production costs (GAAP) |
$ |
306 |
$ |
53,684 |
$ |
17,894 |
$ |
34,568 |
$ |
— |
$ |
106,452 |
||||||
|
By-product credits |
$ |
5 |
$ |
(33) |
$ |
(21) |
$ |
(8,448) |
$ |
— |
$ |
(8,497) |
||||||
|
Treatment and refining charges |
$ |
— |
$ |
123 |
$ |
56 |
$ |
3,663 |
$ |
— |
$ |
3,842 |
||||||
|
Cash costs (non-GAAP) |
$ |
311 |
$ |
53,774 |
$ |
17,929 |
$ |
29,783 |
$ |
— |
$ |
101,797 |
||||||
|
Sustaining capital expenditures |
$ |
6,299 |
$ |
15,881 |
$ |
7,055 |
$ |
3,445 |
$ |
— |
$ |
32,680 |
||||||
|
Sustaining exploration and evaluation expense |
$ |
383 |
$ |
1,626 |
$ |
— |
$ |
1,820 |
$ |
— |
$ |
3,829 |
||||||
|
Care and maintenance (17) |
$ |
31,067 |
$ |
— |
$ |
— |
$ |
— |
$ |
— |
$ |
31,067 |
||||||
|
Reclamation cost accretion and amortization |
$ |
415 |
$ |
526 |
$ |
703 |
$ |
432 |
$ |
— |
$ |
2,076 |
||||||
|
General and administrative expense and stock-based compensation expense |
$ |
215 |
$ |
— |
$ |
— |
$ |
70 |
$ |
12,429 |
$ |
12,714 |
||||||
|
Total AISC (non-GAAP) |
$ |
38,690 |
$ |
71,807 |
$ |
25,687 |
$ |
35,550 |
$ |
12,429 |
$ |
184,163 |
||||||
|
Gold sold (oz) |
2,591 |
49,744 |
19,700 |
— |
— |
72,035 |
||||||||||||
|
Silver sold (oz) |
— |
— |
— |
2,234,323 |
— |
2,234,323 |
||||||||||||
|
Gold equivalent sold (oz) (18, 19) |
2,591 |
49,744 |
19,700 |
24,850 |
— |
96,885 |
||||||||||||
|
Production cost per gold equivalent ounce sold |
118 |
1,079 |
908 |
1,391 |
N/A |
1,099 |
||||||||||||
|
Cash cost per gold ounce sold |
160 |
1,081 |
910 |
N/A |
N/A |
N/A |
||||||||||||
|
Cash cost per silver ounce sold |
N/A |
N/A |
N/A |
13.33 |
N/A |
N/A |
||||||||||||
|
Cash cost per gold equivalent ounce sold |
160 |
1,081 |
910 |
1,199 |
N/A |
1,051 |
||||||||||||
|
AISC per gold ounce sold |
14,972 |
1,444 |
1,304 |
N/A |
N/A |
N/A |
||||||||||||
|
AISC per silver ounce sold |
N/A |
N/A |
N/A |
15.91 |
N/A |
N/A |
||||||||||||
|
AISC per gold equivalent ounce sold |
14,972 |
1,444 |
1,304 |
1,431 |
N/A |
1,901 |
||||||||||||
|
Three Months Ended September 30, 2021 |
||||||||||||||||||
|
(in thousands, unless otherwise noted) |
Çöpler |
Marigold |
Seabee |
Puna |
Corporate |
Total |
||||||||||||
|
Production costs (GAAP) |
$ |
65,773 |
$ |
50,281 |
$ |
15,077 |
$ |
23,390 |
$ |
— |
$ |
154,521 |
||||||
|
By-product credits |
$ |
(1,487) |
$ |
(14) |
$ |
(18) |
$ |
(10,784) |
$ |
— |
$ |
(12,303) |
||||||
|
Treatment and refining charges |
$ |
— |
$ |
65 |
$ |
49 |
$ |
2,962 |
$ |
— |
$ |
3,076 |
||||||
|
Incremental COVID-19 related costs (20) |
$ |
— |
$ |
(46) |
$ |
(1,204) |
$ |
(1,231) |
$ |
— |
$ |
(2,481) |
||||||
|
Fair value adjustment on acquired inventories |
$ |
(17,161) |
$ |
— |
$ |
— |
$ |
— |
$ |
— |
$ |
(17,161) |
||||||
|
Cash costs (non-GAAP) |
$ |
47,125 |
$ |
50,286 |
$ |
13,904 |
$ |
14,337 |
$ |
— |
$ |
125,652 |
||||||
|
Sustaining capital expenditures |
$ |
9,155 |
$ |
8,996 |
$ |
6,932 |
$ |
2,385 |
$ |
— |
$ |
27,468 |
||||||
|
Sustaining exploration and evaluation expense |
$ |
147 |
$ |
217 |
$ |
— |
$ |
36 |
$ |
— |
$ |
400 |
||||||
|
Reclamation cost accretion and amortization |
$ |
527 |
$ |
616 |
$ |
152 |
$ |
406 |
$ |
— |
$ |
1,701 |
||||||
|
General and administrative expense and stock-based compensation expense |
$ |
1,032 |
$ |
— |
$ |
(8) |
$ |
154 |
$ |
10,791 |
$ |
11,969 |
||||||
|
Total AISC (non-GAAP) |
$ |
57,986 |
$ |
60,115 |
$ |
20,980 |
$ |
17,318 |
$ |
10,791 |
$ |
167,190 |
||||||
|
Gold sold (oz) |
80,054 |
53,339 |
22,950 |
— |
— |
156,343 |
||||||||||||
|
Silver sold (oz) |
— |
— |
— |
1,486,272 |
— |
1,486,272 |
||||||||||||
|
Gold equivalent sold (oz) (18, 19) |
80,054 |
53,339 |
22,950 |
19,956 |
— |
176,299 |
||||||||||||
|
Production cost per gold equivalent ounce sold |
822 |
943 |
657 |
1,172 |
N/A |
876 |
||||||||||||
|
Cash cost per gold ounce sold |
589 |
943 |
606 |
N/A |
N/A |
N/A |
||||||||||||
|
Cash cost per silver ounce sold |
N/A |
N/A |
N/A |
9.65 |
N/A |
N/A |
||||||||||||
|
Cash cost per gold equivalent ounce sold |
589 |
943 |
606 |
718 |
N/A |
713 |
||||||||||||
|
AISC per gold ounce sold |
724 |
1,127 |
914 |
N/A |
N/A |
N/A |
||||||||||||
|
AISC per silver ounce sold |
N/A |
N/A |
N/A |
11.65 |
N/A |
N/A |
||||||||||||
|
AISC per gold equivalent ounce sold |
724 |
1,127 |
914 |
868 |
N/A |
948 |
||||||||||||
|
(17) |
Care and maintenance expense in the AISC calculation only includes direct costs, as depreciation is not included in the calculation of AISC. |
|
(18) |
Gold equivalent ounces are calculated multiplying the silver ounces by the ratio of the silver price to the gold price, using the average LBMA prices for the period. The Company does not include by-products in the gold equivalent ounce calculations. |
|
(19) |
Gold equivalent ounces sold may not re-calculate based on amounts presented in this table due to rounding. |
|
(20) |
COVID-19 related costs include direct, incremental costs associated with COVID-19. |
|
Nine Months Ended September 30, 2022 |
||||||||||||||||||
|
(in thousands, unless otherwise noted) |
Çöpler |
Marigold |
Seabee |
Puna |
Corporate |
Total |
||||||||||||
|
Production costs (GAAP) |
$ |
125,985 |
$ |
142,841 |
$ |
53,319 |
$ |
102,755 |
$ |
— |
$ |
424,900 |
||||||
|
By-product credits |
$ |
(2,726) |
$ |
(96) |
$ |
(97) |
$ |
(37,017) |
$ |
— |
$ |
(39,936) |
||||||
|
Treatment and refining charges |
$ |
— |
$ |
301 |
$ |
262 |
$ |
11,029 |
$ |
— |
$ |
11,592 |
||||||
|
Cash costs (non-GAAP) |
$ |
123,259 |
$ |
143,046 |
$ |
53,484 |
$ |
76,767 |
$ |
— |
$ |
396,556 |
||||||
|
Sustaining capital expenditures |
$ |
20,778 |
$ |
45,431 |
$ |
26,316 |
$ |
8,085 |
$ |
— |
$ |
100,610 |
||||||
|
Sustaining exploration and evaluation expense |
$ |
2,111 |
$ |
6,577 |
$ |
— |
$ |
1,984 |
$ |
— |
$ |
10,672 |
||||||
|
Care and maintenance (17) |
$ |
31,067 |
$ |
— |
$ |
— |
$ |
— |
$ |
— |
$ |
31,067 |
||||||
|
Reclamation cost accretion and amortization |
$ |
677 |
$ |
1,596 |
$ |
1,053 |
$ |
1,295 |
$ |
— |
$ |
4,621 |
||||||
|
General and administrative expense and stock-based compensation expense |
$ |
1,670 |
$ |
1 |
$ |
11 |
$ |
233 |
$ |
46,507 |
$ |
48,422 |
||||||
|
Total AISC (non-GAAP) |
$ |
179,562 |
$ |
196,651 |
$ |
80,864 |
$ |
88,364 |
$ |
46,507 |
$ |
591,948 |
||||||
|
Gold sold (oz) |
132,862 |
132,681 |
110,000 |
— |
— |
375,543 |
||||||||||||
|
Silver sold (oz) |
— |
— |
— |
5,766,165 |
— |
5,766,165 |
||||||||||||
|
Gold equivalent sold (oz) (18, 19) |
132,862 |
132,681 |
110,000 |
69,284 |
— |
444,827 |
||||||||||||
|
Production cost per gold equivalent ounce sold |
948 |
1,077 |
485 |
1,483 |
N/A |
955 |
||||||||||||
|
Cash cost per gold ounce sold |
928 |
1,078 |
486 |
N/A |
N/A |
N/A |
||||||||||||
|
Cash cost per silver ounce sold |
N/A |
N/A |
N/A |
13.31 |
N/A |
N/A |
||||||||||||
|
Cash cost per gold equivalent ounce sold |
928 |
1,078 |
486 |
1,108 |
N/A |
891 |
||||||||||||
|
AISC per gold ounce sold |
1,351 |
1,482 |
735 |
N/A |
N/A |
N/A |
||||||||||||
|
AISC per silver ounce sold |
N/A |
N/A |
N/A |
15.32 |
N/A |
N/A |
||||||||||||
|
AISC per gold equivalent ounce sold |
1,351 |
1,482 |
735 |
1,275 |
N/A |
1,331 |
||||||||||||
|
Nine Months Ended September 30, 2021 |
||||||||||||||||||
|
(in thousands, unless otherwise noted) |
Çöpler |
Marigold |
Seabee |
Puna |
Corporate |
Total |
||||||||||||
|
Production costs (GAAP) |
$ |
201,927 |
$ |
155,582 |
$ |
47,105 |
$ |
78,716 |
$ |
— |
$ |
483,330 |
||||||
|
By-product credits |
$ |
(4,494) |
$ |
(74) |
$ |
(79) |
$ |
(29,066) |
$ |
— |
$ |
(33,713) |
||||||
|
Treatment and refining charges |
$ |
— |
$ |
327 |
$ |
308 |
$ |
10,442 |
$ |
— |
$ |
11,077 |
||||||
|
Incremental COVID-19 related costs(20) |
$ |
— |
$ |
(649) |
$ |
(3,526) |
$ |
(2,985) |
$ |
— |
$ |
(7,160) |
||||||
|
Fair value adjustment on acquired inventories |
$ |
(49,205) |
$ |
— |
$ |
— |
$ |
— |
$ |
— |
$ |
(49,205) |
||||||
|
Cash costs (non-GAAP) |
$ |
148,228 |
$ |
155,186 |
$ |
43,808 |
$ |
57,107 |
$ |
— |
$ |
404,329 |
||||||
|
Sustaining capital expenditures |
$ |
25,728 |
$ |
44,902 |
$ |
26,594 |
$ |
7,906 |
$ |
— |
$ |
105,130 |
||||||
|
Sustaining exploration and evaluation expense |
$ |
367 |
$ |
1,207 |
$ |
— |
$ |
90 |
$ |
— |
$ |
1,664 |
||||||
|
Reclamation cost accretion and amortization |
$ |
1,911 |
$ |
2,055 |
$ |
469 |
$ |
1,218 |
$ |
— |
$ |
5,653 |
||||||
|
General and administrative expense and stock-based compensation expense |
$ |
6,021 |
$ |
(103) |
$ |
19 |
$ |
1,776 |
$ |
27,223 |
$ |
34,936 |
||||||
|
Total AISC (non-GAAP) |
$ |
182,255 |
$ |
203,247 |
$ |
70,890 |
$ |
68,097 |
$ |
27,223 |
$ |
551,712 |
||||||
|
Gold sold (oz) |
239,428 |
178,351 |
85,416 |
— |
— |
503,195 |
||||||||||||
|
Silver sold (oz) |
— |
— |
— |
5,349,386 |
— |
5,349,386 |
||||||||||||
|
Gold equivalent sold (oz) (18, 19) |
239,428 |
178,351 |
85,416 |
76,136 |
— |
579,331 |
||||||||||||
|
Production cost per gold equivalent ounce sold |
843 |
872 |
551 |
1,034 |
N/A |
834 |
||||||||||||
|
Cash cost per gold ounce sold |
619 |
870 |
513 |
N/A |
N/A |
N/A |
||||||||||||
|
Cash cost per silver ounce sold |
N/A |
N/A |
N/A |
10.68 |
N/A |
N/A |
||||||||||||
|
Cash cost per gold equivalent ounce sold |
619 |
870 |
513 |
750 |
N/A |
698 |
||||||||||||
|
AISC per gold ounce sold |
761 |
1,140 |
830 |
N/A |
N/A |
N/A |
||||||||||||
|
AISC per silver ounce sold |
N/A |
N/A |
N/A |
12.73 |
N/A |
N/A |
||||||||||||
|
AISC per gold equivalent ounce sold |
761 |
1,140 |
830 |
894 |
N/A |
952 |
||||||||||||
|
(17) |
Care and maintenance expense in the AISC calculation only includes direct costs, as depreciation is not included in the calculation of AISC. |
|
(18) |
Gold equivalent ounces are calculated multiplying the silver ounces by the ratio of the silver price to the gold price, using the average LBMA prices for the period. The Company does not include by-products in the gold equivalent ounce calculations. |
|
(19) |
Gold equivalent ounces sold may not re-calculate based on amounts presented in this table due to rounding. |
|
(20) |
COVID-19 related costs include direct, incremental costs associated with COVID-19. |
The following tables provide a reconciliation of production costs to cash costs and AISC used in our 2022 guidance:
|
Current Guidance as of November 8, 2022 |
|||||||||||||
|
(operating guidance 100% basis) (21) |
Çöpler |
Marigold |
Seabee |
Puna |
Corporate |
Total |
|||||||
|
Gold Production |
koz |
180 — 190 |
195 — 205 |
150 — 160 |
— |
— |
525 — 555 |
||||||
|
Silver Production |
Moz |
— |
— |
— |
8.25 — 8.75 |
— |
8.25 — 8.75 |
||||||
|
Gold Equivalent Production |
koz |
180 — 190 |
195 — 205 |
150 — 160 |
95 — 100 |
— |
620 — 655 |
||||||
|
Gold Sold |
koz |
180 — 190 |
195 — 205 |
150 — 160 |
— |
— |
525 — 555 |
||||||
|
Silver Sold |
Moz |
— |
— |
— |
8.25 — 8.75 |
— |
8.25 — 8.75 |
||||||
|
Gold Equivalent Sold |
koz |
180 — 190 |
195 — 205 |
150 — 160 |
95 — 100 |
— |
620 — 655 |
||||||
|
Production Costs (GAAP) |
$M |
185 — 195 |
213 — 223 |
68 — 78 |
143 — 153 |
— |
608 — 648 |
||||||
|
By-Product Credits + Treatment & Refining Costs |
$M |
(3) |
— |
— |
(35) |
— |
(38) |
||||||
|
Cash Cost (non-GAAP) |
$M |
182 — 192 |
213 — 223 |
68 — 78 |
108 — 118 |
— |
570 — 610 |
||||||
|
Sustaining Capital Expenditures (23) |
$M |
34 |
57 |
43 |
16 |
— |
150 |
||||||
|
Sustaining Exploration Expenditures |
$M |
3 |
6 |
1 |
3 |
— |
13 |
||||||
|
Care & Maintenance |
$M |
31 |
— |
— |
— |
— |
31 |
||||||
|
General & Administrative |
$M |
— |
— |
— |
— |
65 |
65 |
||||||
|
All-In Sustaining Cost (non-GAAP) |
$M |
250 — 260 |
275 — 285 |
110 — 120 |
125 — 135 |
65 |
830 — 870 |
||||||
|
Production Costs per Ounce (GAAP) (22) |
$/oz |
1,000 — 1,030 |
1,065 — 1,095 |
455 — 485 |
17.25 — 17.75 |
— |
960 — 990 |
||||||
|
Cash Cost per Ounce (non-GAAP) (22) |
$/oz |
985 — 1,015 |
1,065 — 1,095 |
455 — 485 |
13.00 — 13.50 |
— |
900 — 930 |
||||||
|
All-In Sustaining Cost per Ounce (non-GAAP) (22) |
$/oz |
1,345— 1,375 |
1,410 — 1,440 |
715 — 745 |
15.00 — 15.50 |
— |
1,315 — 1,345 |
||||||
|
Growth Capital Expenditures |
$M |
3 |
— |
5 |
— |
— |
8 |
||||||
|
Growth Exploration and Resource Development Expenditures (24) |
$M |
16 |
18 |
14 |
— |
5 |
53 |
||||||
|
Total Growth Capital |
$M |
19 |
18 |
19 |
— |
5 |
61 |
||||||
|
(21) |
Figures may not add up due to rounding. Figures are reported on a 100% basis. Çöpler is 80% owned by SSR Mining. |
|
(22) |
Çöpler, Marigold and Seabee costs per ounce based on gold ounces sold; Puna costs per ounce based on silver ounces sold. Gold equivalent ounces sold are used in the calculation for Total costs per ounce. |
|
(23) |
Excludes sustaining exploration and evaluation expenditures. Includes approximately $9.0 million in lease payments at Çöpler. Includes mine development at Seabee. |
|
(24) |
Growth exploration and resource development expenditures are shown on a 100% basis, of which SSR Mining attributable amount totals $50 million. |
Non-GAAP Measure – Adjusted Attributable Net Income (loss)
Adjusted attributable net income (loss) and adjusted attributable net income (loss) per share are used by management to measure the Company’s underlying operating performance. We believe this measure is also useful for shareholders to assess the Company’s operating performance. The most directly comparable financial measures prepared in accordance with GAAP are net income (loss) attributable to equity holders of SSR Mining and net income (loss) per share attributable to equity holders of SSR Mining. Adjusted attributable net income (loss) is defined as net income (loss) adjusted to exclude the after-tax impact of specific items that are significant, but not reflective of the Company’s underlying operations, including impairment charges; foreign exchange (gains) losses and inflationary impacts on tax balances; transaction, integration, and SEC conversion expenses; and other non-recurring items.
The following table provides a reconciliation of net income (loss) attributable to equity holders of SSR Mining to adjusted net income (loss) attributable to equity holders of SSR Mining:
|
Three Months Ended |
Nine Months Ended |
|||||||||||
|
(in thousands of US dollars, except per share data) |
September 30, |
September 30, |
||||||||||
|
2022 |
2021 |
2022 |
2021 |
|||||||||
|
Net income (loss) attributable to equity holders of SSR Mining (GAAP) |
$ |
(25,793) |
$ |
57,060 |
$ |
100,256 |
$ |
240,641 |
||||
|
Interest saving on convertible notes, net of tax |
$ |
— |
$ |
1,226 |
$ |
3,677 |
$ |
3,662 |
||||
|
Net income (loss) used in the calculation of diluted net income (loss) per share |
$ |
(25,793) |
$ |
58,286 |
$ |
103,933 |
$ |
244,303 |
||||
|
Weighted-average shares used in the calculation of net income (loss) and adjusted net income (loss) per share |
||||||||||||
|
Basic |
207,983 |
213,426 |
210,986 |
217,392 |
||||||||
|
Diluted |
207,983 |
225,689 |
223,543 |
229,652 |
||||||||
|
Net income (loss) per share attributable to common stockholders (GAAP) |
||||||||||||
|
Basic |
$ |
(0.12) |
$ |
0.27 |
$ |
0.48 |
$ |
1.11 |
||||
|
Diluted |
$ |
(0.12) |
$ |
0.26 |
$ |
0.46 |
$ |
1.06 |
||||
|
Adjustments: |
||||||||||||
|
Fair value adjustment on acquired assets (25) |
$ |
— |
$ |
26,449 |
$ |
— |
$ |
75,928 |
||||
|
COVID-19 related costs (26) |
$ |
— |
$ |
2,480 |
$ |
— |
$ |
7,160 |
||||
|
Foreign exchange loss (gain) |
$ |
11,577 |
$ |
1,595 |
$ |
19,733 |
$ |
2,904 |
||||
|
Alacer transaction and integration costs |
$ |
— |
$ |
611 |
$ |
— |
$ |
5,815 |
||||
|
Pitarrilla transaction costs |
$ |
1,561 |
$ |
— |
$ |
1,561 |
$ |
— |
||||
|
SEC conversion costs |
$ |
— |
$ |
64 |
$ |
1,255 |
$ |
245 |
||||
|
Impairment of long-lived and other assets |
$ |
— |
$ |
5 |
$ |
— |
$ |
22,354 |
||||
|
Change in fair value of marketable securities |
$ |
37 |
$ |
4,524 |
$ |
3,836 |
$ |
6,472 |
||||
|
Loss (gain) on sale of mineral properties, plant and equipment |
$ |
(128) |
$ |
1,152 |
$ |
1,213 |
$ |
(462) |
||||
|
Income tax impact related to above adjustments |
$ |
(382) |
$ |
(8,607) |
$ |
(2,045) |
$ |
(25,448) |
||||
|
Foreign exchange (gain) loss and inflationary impacts on tax balances |
$ |
(11,850) |
$ |
(5,015) |
$ |
(18,020) |
$ |
(44,666) |
||||
|
Other tax adjustments (27) |
$ |
11,445 |
$ |
— |
$ |
11,445 |
$ |
— |
||||
|
Impact of tax rate change on fair value adjustments |
$ |
— |
$ |
7,947 |
$ |
— |
$ |
12,555 |
||||
|
Adjusted net income (loss) attributable to equity holders of SSR Mining (Non-GAAP) |
$ |
(13,533) |
$ |
88,265 |
$ |
119,234 |
$ |
303,498 |
||||
|
Adjusted net income (loss) per share attributable to SSR Mining shareholders (Non-GAAP) |
||||||||||||
|
Basic |
$ |
(0.07) |
$ |
0.41 |
$ |
0.57 |
$ |
1.40 |
||||
|
Diluted |
$ |
(0.07) |
$ |
0.40 |
$ |
0.55 |
$ |
1.34 |
||||
|
(25) |
Fair value adjustments on acquired assets relate to the acquisition of Alacer’s inventories and mineral properties. |
|
(26) |
COVID-19 related costs include direct, incremental costs associated with COVID-19 at all operations. |
|
(27) |
Represents charges related to a tax settlement and an uncertain tax position. |
Non-GAAP Measure – Free Cash Flow
The Company uses free cash flow, cash flow from operating activities before changes in working capital, and free cash flow before changes in working capital to supplement information in its condensed consolidated financial statements. The most directly comparable financial measures prepared in accordance with GAAP is cash provided by operating activities. The Company believes that in addition to conventional measures prepared in accordance with US GAAP, certain investors and analysts use this information to evaluate the ability of the Company to generate cash flow after capital investments and build the Company’s cash resources. The Company calculates free cash flow by deducting cash capital spending from cash generated by operating activities.
The following table provides a reconciliation of cash provided by operating activities to free cash flow:
|
Three Months Ended |
Nine Months Ended |
|||||||||||
|
(in thousands of US dollars, except per share data) |
September 30, |
September 30, |
||||||||||
|
2022 |
2021 |
2022 |
2021 |
|||||||||
|
Cash provided by operating activities (GAAP) |
$ |
(52,226) |
$ |
161,124 |
$ |
42,799 |
$ |
424,380 |
||||
|
Expenditures on mineral properties, plant, and equipment |
$ |
(39,825) |
$ |
(35,677) |
$ |
(116,155) |
$ |
(128,924) |
||||
|
Free cash flow (non-GAAP) |
$ |
(92,051) |
$ |
125,447 |
$ |
(73,356) |
$ |
295,456 |
||||
Starting in this period, we are presenting operating cash flow before working capital adjustments and free cash flow before working capital adjustments as non-GAAP cash flow measures to supplement our operating cash flow and free cash flow (non-GAAP) measures. We believe presenting both operating cash flow and free cash flow before working capital adjustments, which reflects an exclusion of net changes in operating assets and liabilities, will be useful for investors because it presents cash flow that is actually generated from the continuing business. The Company calculates cash flow from operating activities before changes in working capital by adjusting cash provided by operating activities by the net change in operating assets and liabilities. The Company also calculates free cash flow before changes in working capital by deducting cash capital spending from cash flow from operating activities before changes in working capital.
The following table provides a reconciliation of cash provided by operating activities to free cash flow before changes in working capital:
|
Three Months Ended |
Nine Months Ended |
|||||||||||
|
(in thousands of US dollars, except per share data) |
September 30, |
September 30, |
||||||||||
|
2022 |
2021 |
2022 |
2021 |
|||||||||
|
Cash generated by (used in) operating activities (GAAP) |
$ |
(52,226) |
$ |
161,124 |
$ |
42,799 |
$ |
424,380 |
||||
|
Net change in operating assets and liabilities |
$ |
28,560 |
$ |
(16,920) |
$ |
169,904 |
$ |
56,683 |
||||
|
Cash generated by (used in) operating activities before changes in working capital (non-GAAP) |
$ |
(23,666) |
$ |
144,204 |
$ |
212,703 |
$ |
481,063 |
||||
|
Expenditures on mineral properties, plant, and equipment |
$ |
(39,825) |
$ |
(35,677) |
$ |
(116,155) |
$ |
(128,924) |
||||
|
Free cash flow before changes in working capital (non-GAAP) |
$ |
(63,491) |
$ |
108,527 |
$ |
96,548 |
$ |
325,139 |
||||
View original content:https://www.prnewswire.com/news-releases/ssr-mining-reports-third-quarter-2022-results-301671035.html
SOURCE SSR Mining Inc.
drilling
tsx-ssrm
ssr-mining-inc
ssr mining inc
financing
issuer bid
acquisition
press-release


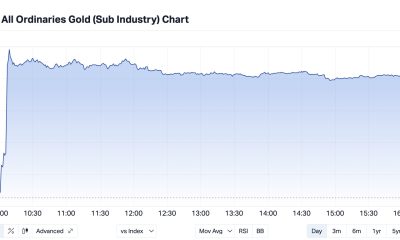


Capella Announces Definitive Agreement for the Sale of is Central Norway Copper-Cobalt Projects to NickelX and Financing Update
Capella Announces Definitive Agreement for the Sale of is Central Norway Copper-Cobalt Projects to NickelX and Financing Update
Canada NewsWire
VANCOUVER, BC, Oct. 17, 2023
VANCOUVER, BC, Oct. 17, 2023 /CNW/ – Capella Minerals Ltd (TSXV: CMIL) (OTC…
Goldgroup Announces Exercise of Cerro Prieto Purchase Option
Vancouver, British Columbia–(Newsfile Corp. – October 17, 2023) – Goldgroup Mining Inc. (TSX: GGA) (OTC PINK: GGAZF) (BMV SIX: GGAN.MX) ("Goldgroup" or…
Canada Silver Cobalt Works Confirms Pegmatites up to 20 meters wide and 70 meters long at Sangster West
Pegmatite Confirmations and Advanced Geochemical Insights Propel Exploration Success
Coquitlam, BC – TheNewswire – October 17, 2023 – Canada Silver…


