Energy & Critical Metals
Visualized: Per Capita Electricity Emissions, by State
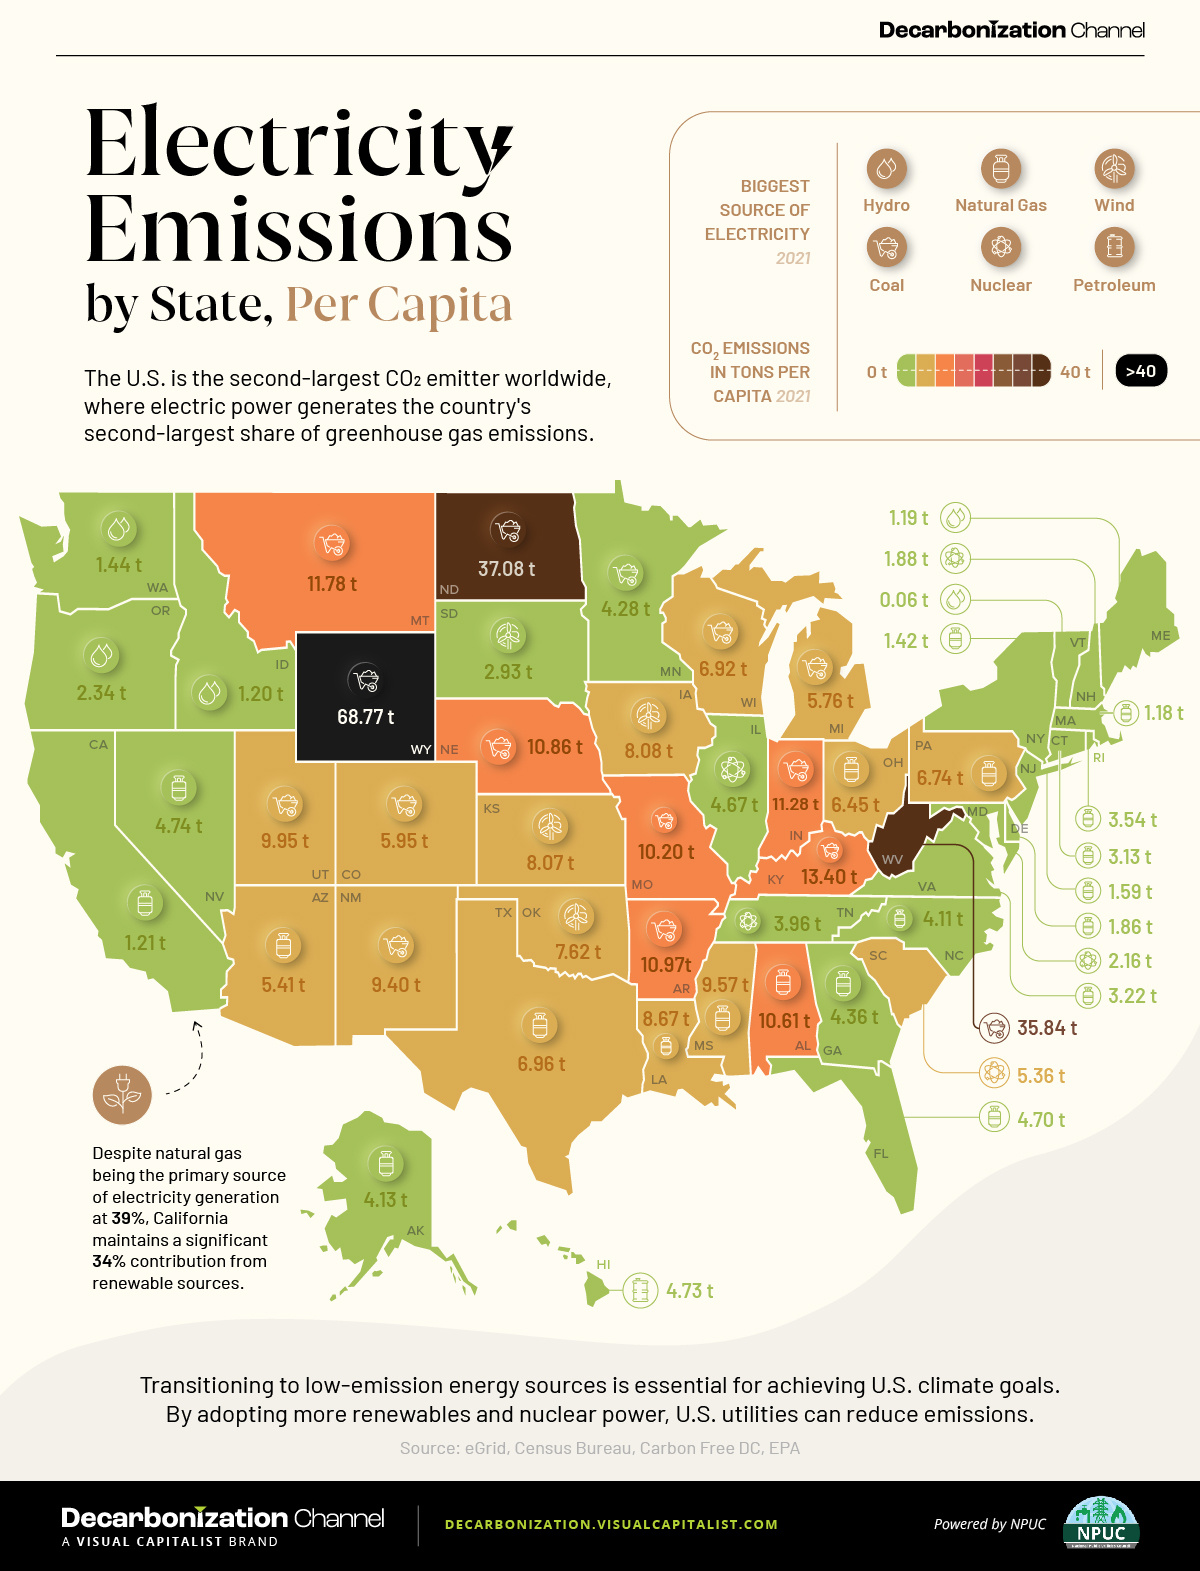
This graphic showcases electricity emissions by state, highlighting each state’s largest source of power.
The post Visualized: Per Capita Electricity Emissions,…
Subscribe to the Decarbonization Channel’s free mailing list for more like this
Per Capita Electricity Emissions by State
This was originally posted on the Decarbonization Channel. Subscribe to the free mailing list to be the first to see graphics related to decarbonization with a focus on the U.S. energy sector.
The U.S. is the second-largest CO₂ emitter worldwide, with electric power contributing significantly to the country’s greenhouse gas (GHG) emissions.
In collaboration with the National Public Utilities Council, this graphic uses data from eGrid to showcase per-capita electricity emissions by state and each state’s largest source of power.
U.S. Power Sector: Second in CO₂ Emissions
According to the Global Carbon Atlas, the top three global polluters are China, the U.S., and India—accounting for half of the world’s CO₂ emissions.
The U.S., however, leads by far in terms of CO₂ emissions per capita, with 15.3 metric tons per person, while China and India have lower rates at 7.4 and 1.9, respectively.
A substantial portion of these emissions comes from electricity generation. According to the United States Environmental Protection Agency, the electric power sector is the second-largest source of U.S. greenhouse gas emissions, contributing 25% to the total.
Examining emissions per state, Wyoming, North Dakota, and West Virginia top the list of CO₂ emissions per capita, relying primarily on coal as their source of energy.
Here is a table showing emissions by state per capita, from highest to lowest:
| State | CO2 emissions in tons per capita (2021) | Biggest Source of Electricity (2021) |
|---|---|---|
| Wyoming | 68.77 t | Coal |
| North Dakota | 37.08 t | Coal |
| West Virginia | 35.84 t | Coal |
| Kentucky | 13.40 t | Coal |
| Montana | 11.78 t | Coal |
| Indiana | 11.28 t | Coal |
| Arkansas | 10.97 t | Coal |
| Nebraska | 10.87 t | Coal |
| Alabama | 10.61 t | Natural Gas |
| Missouri | 10.20 t | Coal |
| Utah | 9.95 t | Coal |
| Mississippi | 9.57 t | Natural Gas |
| New Mexico | 9.40 t | Coal |
| Louisiana | 8.67 t | Natural Gas |
| Iowa | 8.08 t | Wind |
| Kansas | 8.07 t | Wind |
| Oklahoma | 7.62 t | Wind |
| Texas | 6.96 t | Natural Gas |
| Wisconsin | 6.92 t | Coal |
| Pennsylvania | 6.74 t | Natural Gas |
| Ohio | 6.45 t | Natural Gas |
| Colorado | 5.95 t | Coal |
| Michigan | 5.76 t | Coal |
| Arizona | 5.41 t | Natural Gas |
| South Carolina | 5.36 t | Nuclear |
| Nevada | 4.74 t | Natural Gas |
| Hawaii | 4.73 t | Petroleum |
| Florida | 4.70 t | Natural Gas |
| Illinois | 4.67 t | Nuclear |
| Georgia | 4.36 t | Natural Gas |
| Minnesota | 4.28 t | Coal |
| Alaska | 4.13 t | Natural Gas |
| North Carolina | 4.11 t | Natural Gas |
| Tennessee | 3.96 t | Nuclear |
| Rhode Island | 3.54 t | Natural Gas |
| Virginia | 3.22 t | Natural Gas |
| Connecticut | 3.13 t | Natural Gas |
| South Dakota | 2.93 t | Wind |
| Oregon | 2.34 t | Hydro |
| Maryland | 2.16 t | Nuclear |
| New Hampshire | 1.88 t | Nuclear |
| Delaware | 1.86 t | Natural Gas |
| New Jersey | 1.59 t | Natural Gas |
| Washington | 1.44 t | Hydro |
| New York | 1.42 t | Natural Gas |
| California | 1.21 t | Natural Gas |
| Idaho | 1.20 t | Hydro |
| Maine | 1.19 t | Hydro |
| Massachusetts | 1.18 t | Natural Gas |
| District of Columbia | 0.09 t | Natural Gas |
| Vermont | 0.06 t | Hydro |
Interestingly, from the top 10 on our list, only Alabama doesn’t have coal as the main source of electricity.
Conversely, four of the 10 states with the lowest CO₂ emissions per capita rely more heavily on renewables, especially hydropower.
Two of the largest consumers, California and Texas, have natural gas as their main source of electricity, but also maintain a significant share of renewable sources, with 34% and 44%, respectively.
Although coal accounted for 59% of CO₂ emissions from the energy sector, it represented only 23% of the electricity generated in the United States. Natural gas accounted for 37% of electricity generation in 2021.
The Transition to Low-Emission Sources
The U.S. has set a goal to reach 100% carbon pollution-free electricity by 2035.
Transitioning to low-emission energy sources like hydroelectricity, biomass, wind, and solar is essential for meeting U.S. climate goals.
In addition, clean energy stands out as the most significant job creator in America’s energy sector, with over 3 million Americans employed in clean energy jobs during 2021.
The post Visualized: Per Capita Electricity Emissions, by State appeared first on Visual Capitalist.


Uranium Exploration Company Announces Additional Staking in the Athabasca Basin
Source: Streetwise Reports 12/22/2023
Skyharbour Resources Ltd. announced an update from its Canada-based Falcon Project along with additional…
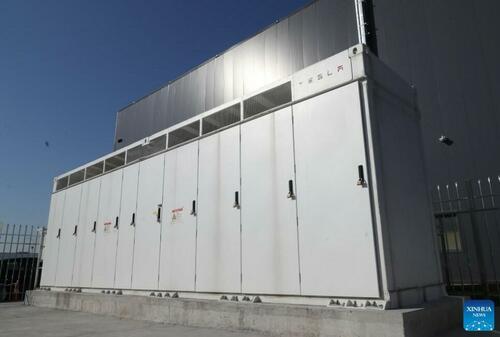
Tesla Launches New Mega Factory Project In Shanghai, Designed To Manufacture 10,000 Megapacks Per Year
Tesla Launches New Mega Factory Project In Shanghai, Designed To Manufacture 10,000 Megapacks Per Year
Tesla has launched a new mega factory…
Giving thanks and taking stock after “a remarkable year”
An end-of-year thank you to our readers, industry colleagues and advertisers before Electric Autonomy breaks from publishing until Jan. 2
The post Giving…