Economics
Where Is Inflation Persistence Coming From?
Elevated inflation continues to be a top-of-mind preoccupation for households, businesses, and policymakers. Why has the post-pandemic inflation proved…

Elevated inflation continues to be a top-of-mind preoccupation for households, businesses, and policymakers. Why has the post-pandemic inflation proved so persistent? In a Liberty Street Economics post early in 2022, we introduced a measure designed to dissect the buildup of the inflationary pressures that emerged in mid-2021 and to understand where the sources of its persistence are. This measure, that we labeled Multivariate Core Trend (MCT) inflation analyzes whether inflation is short-lived or persistent, and whether it is concentrated in particular economic sectors or broad-based.
As we documented in a series of posts (most recently here), MCT inflation remained roughly stable through most of 2020 despite a visible drop in headline and core personal consumption expenditures (PCE) inflation due to the pandemic (see chart below). Early in 2021 the MCT estimate started to rise, ahead of core PCE inflation, and peaked in mid-2022. Its decline since then has been more notable starting in March of this year. Today we are updating the MCT estimates following the release of the May PCE data and we are launching “Multivariate Core Trend Inflation” as a standalone product, with new readings to be published each month on the New York Fed’s public website, after the Bureau of Economic Analysis (BEA) official releases.
Multivariate Core Trend of PCE Inflation
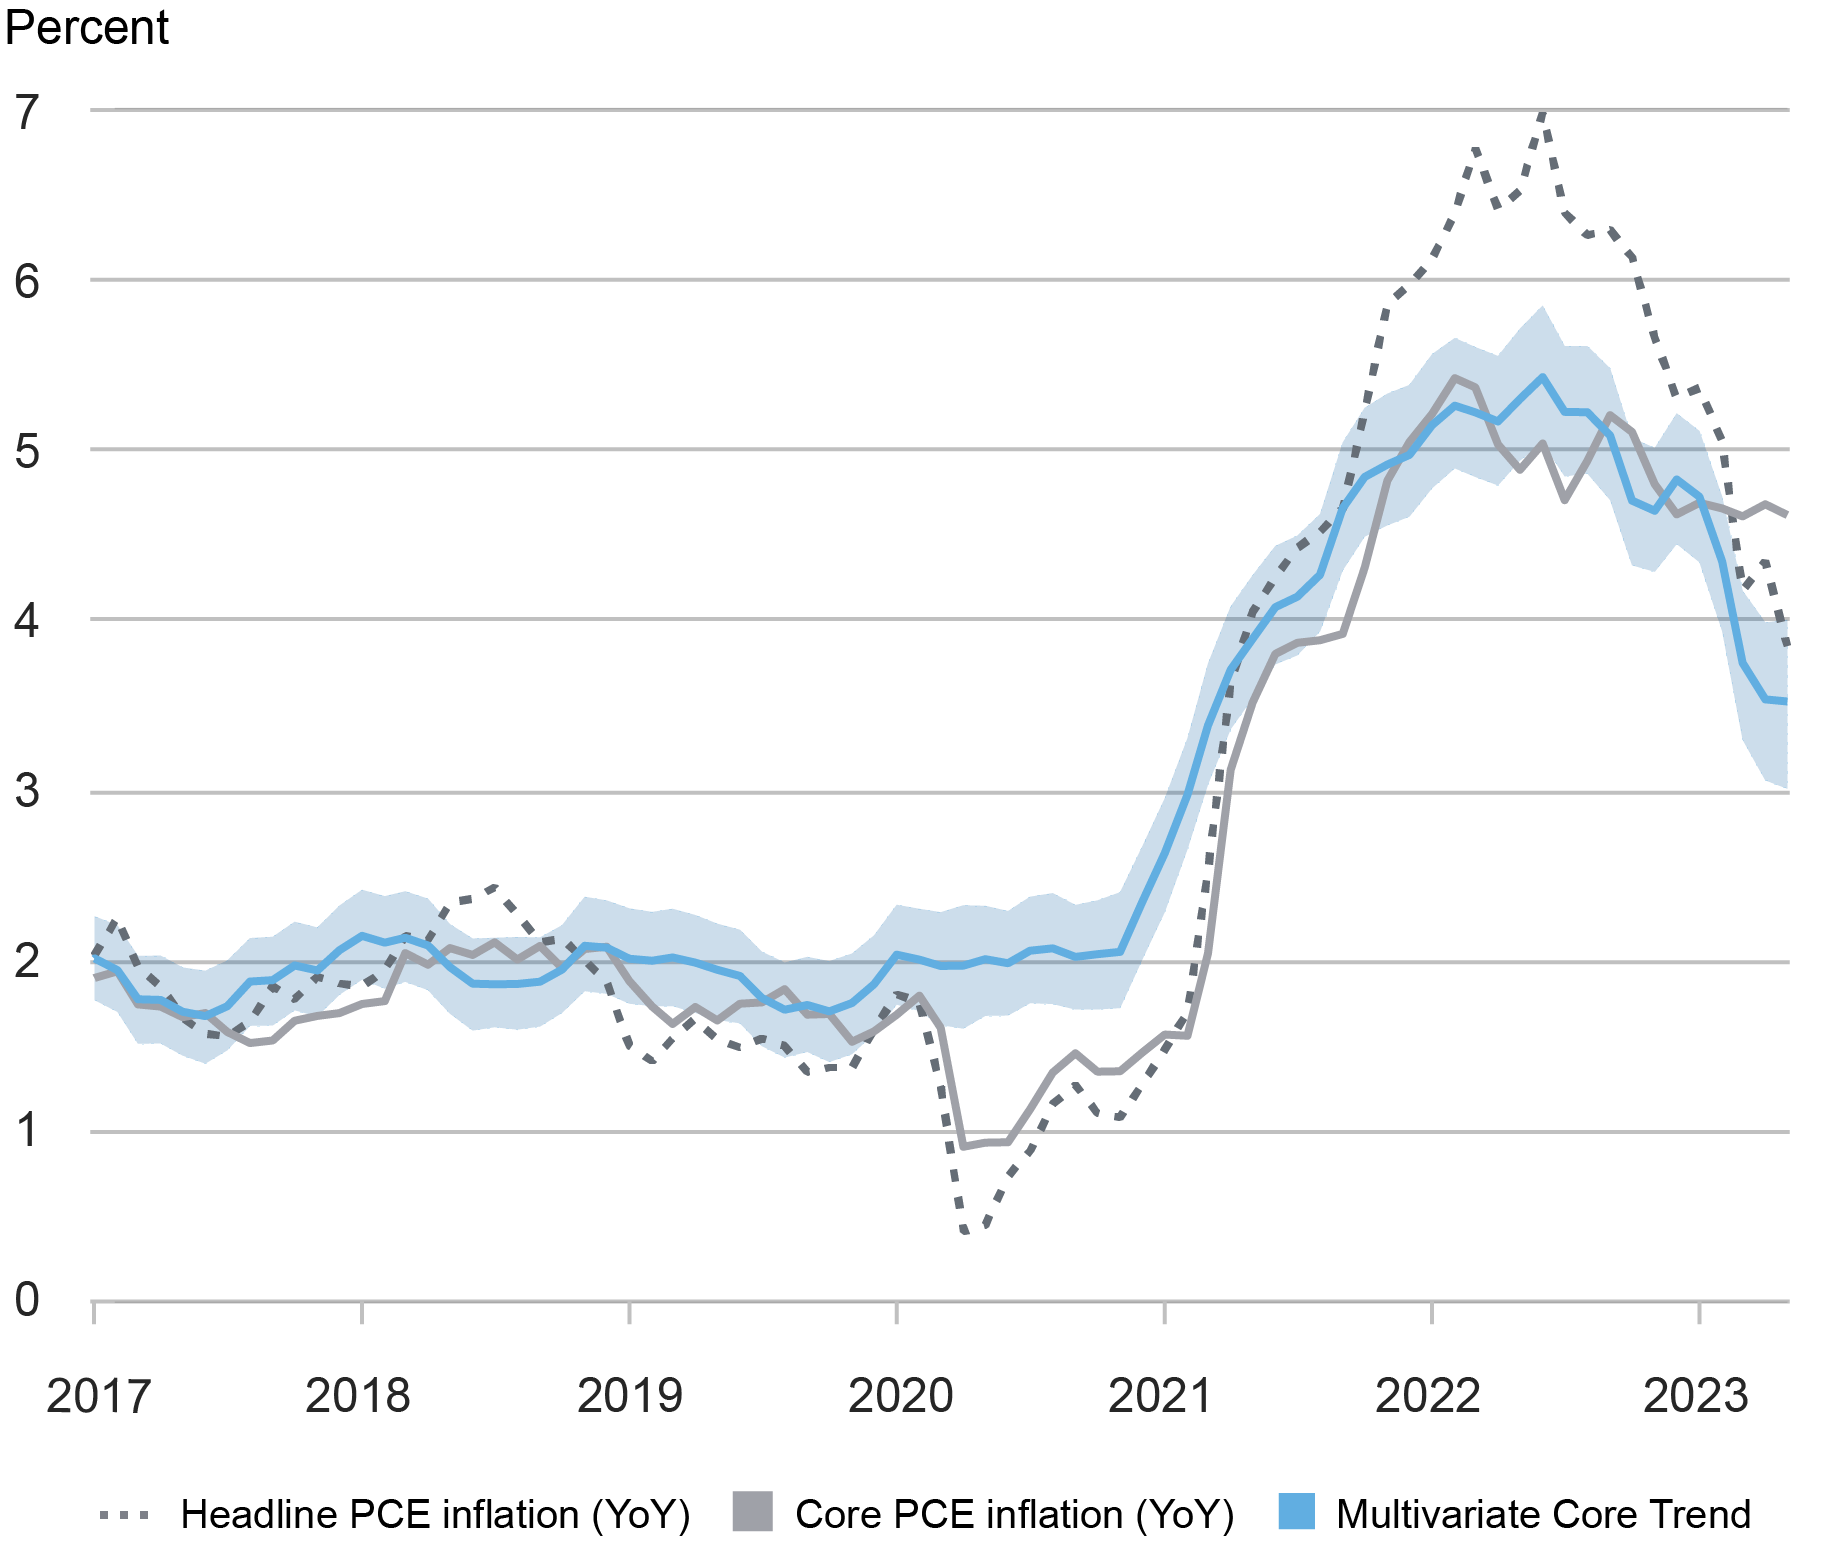
Notes: The twelve-month changes in the headline and core personal consumption expenditures (PCE) price indexes are plotted alongside Multivariate Core Trend (MCT) inflation for comparison. The shaded area surrounding the MCT estimate is a 68 percent probability band.
Methodology
The MCT measure is obtained by a dynamic factor model estimated on monthly data for the seventeen major sectors of the PCE price index. The approach (that builds on this paper) decomposes each sector’s inflation as the sum of a common trend, a sector-specific trend, a common transitory shock, and a sector-specific transitory shock. The trend in PCE inflation is constructed from the sectoral level estimates as the sum of the common and the sector-specific trends weighted by the expenditure shares. In the estimation, we use data from all seventeen of the PCE sectors; however, in constructing the trend in PCE inflation, we exclude the volatile non-core sectors (that is, food and energy).
MCT and Core PCE Inflation
The Multivariate Core Trend model estimate stands at 3.5 percent in May, as in April, after experiencing a substantial moderation in the first part of the year. For reference, the twelve-month core PCE inflation rate is at 4.6 percent.
Why is the MCT estimate so different from twelve-month core inflation rates? The MCT model measures the persistent component of month-on-month core inflation data as opposed to its twelve-month rate. This makes it timelier since transitory shocks tend to remain in the twelve-month measure for too long.
Additionally, the MCT model gives more weight to sectors that have relatively few transitory shocks (for example, housing and food services and accommodation) and less weight to sectors that have large amounts of noise (for example, motor vehicles and transportation). Recently, low inflation readings occurred in sectors with high signal value, leading to downward revisions of their trends, while increases occurred in sectors with low signal value, leaving their trends basically untouched.
We visualize the differences in the sectors’ contributions to the MCT estimate versus their contributions to the core PCE inflation in the chart below. The two panels in the chart compare the change in each measure over a period of run-up in inflation (on the left) and the period after the MCT peak (labeled “Moderation,” on the right).
Specifically, the “Run-up” panel reports each sector’s contribution (color-coded) to the increase in core PCE (left bar) and MCT inflation (right bar) in the June 2021-May 2022 period, where the contribution is measured relative to their respective pre-pandemic values (January-December 2019). Similarly, the “Moderation” panel on the right gives the sectoral decomposition of the changes in core PCE and MCT inflation since June 2022 (June 2022 was the recent peak of overall inflation, while it is near the recent peak for core inflation.)
As the chart illustrates, the MCT measure takes more signal from the moderation of inflation in food services and accommodation (purple bars) than does core inflation, and less from the moderation of motor vehicle inflation (brown bars). The different contribution of housing inflation (teal bars) is also notable. In the run-up, housing inflation has a larger positive contribution to the MCT estimate than to the core PCE measure; during the moderation period, it still adds positive pressure to the core PCE reading, while it contributes to the decline in the MCT measure.
Sectoral Contributions to the Inflation Estimates
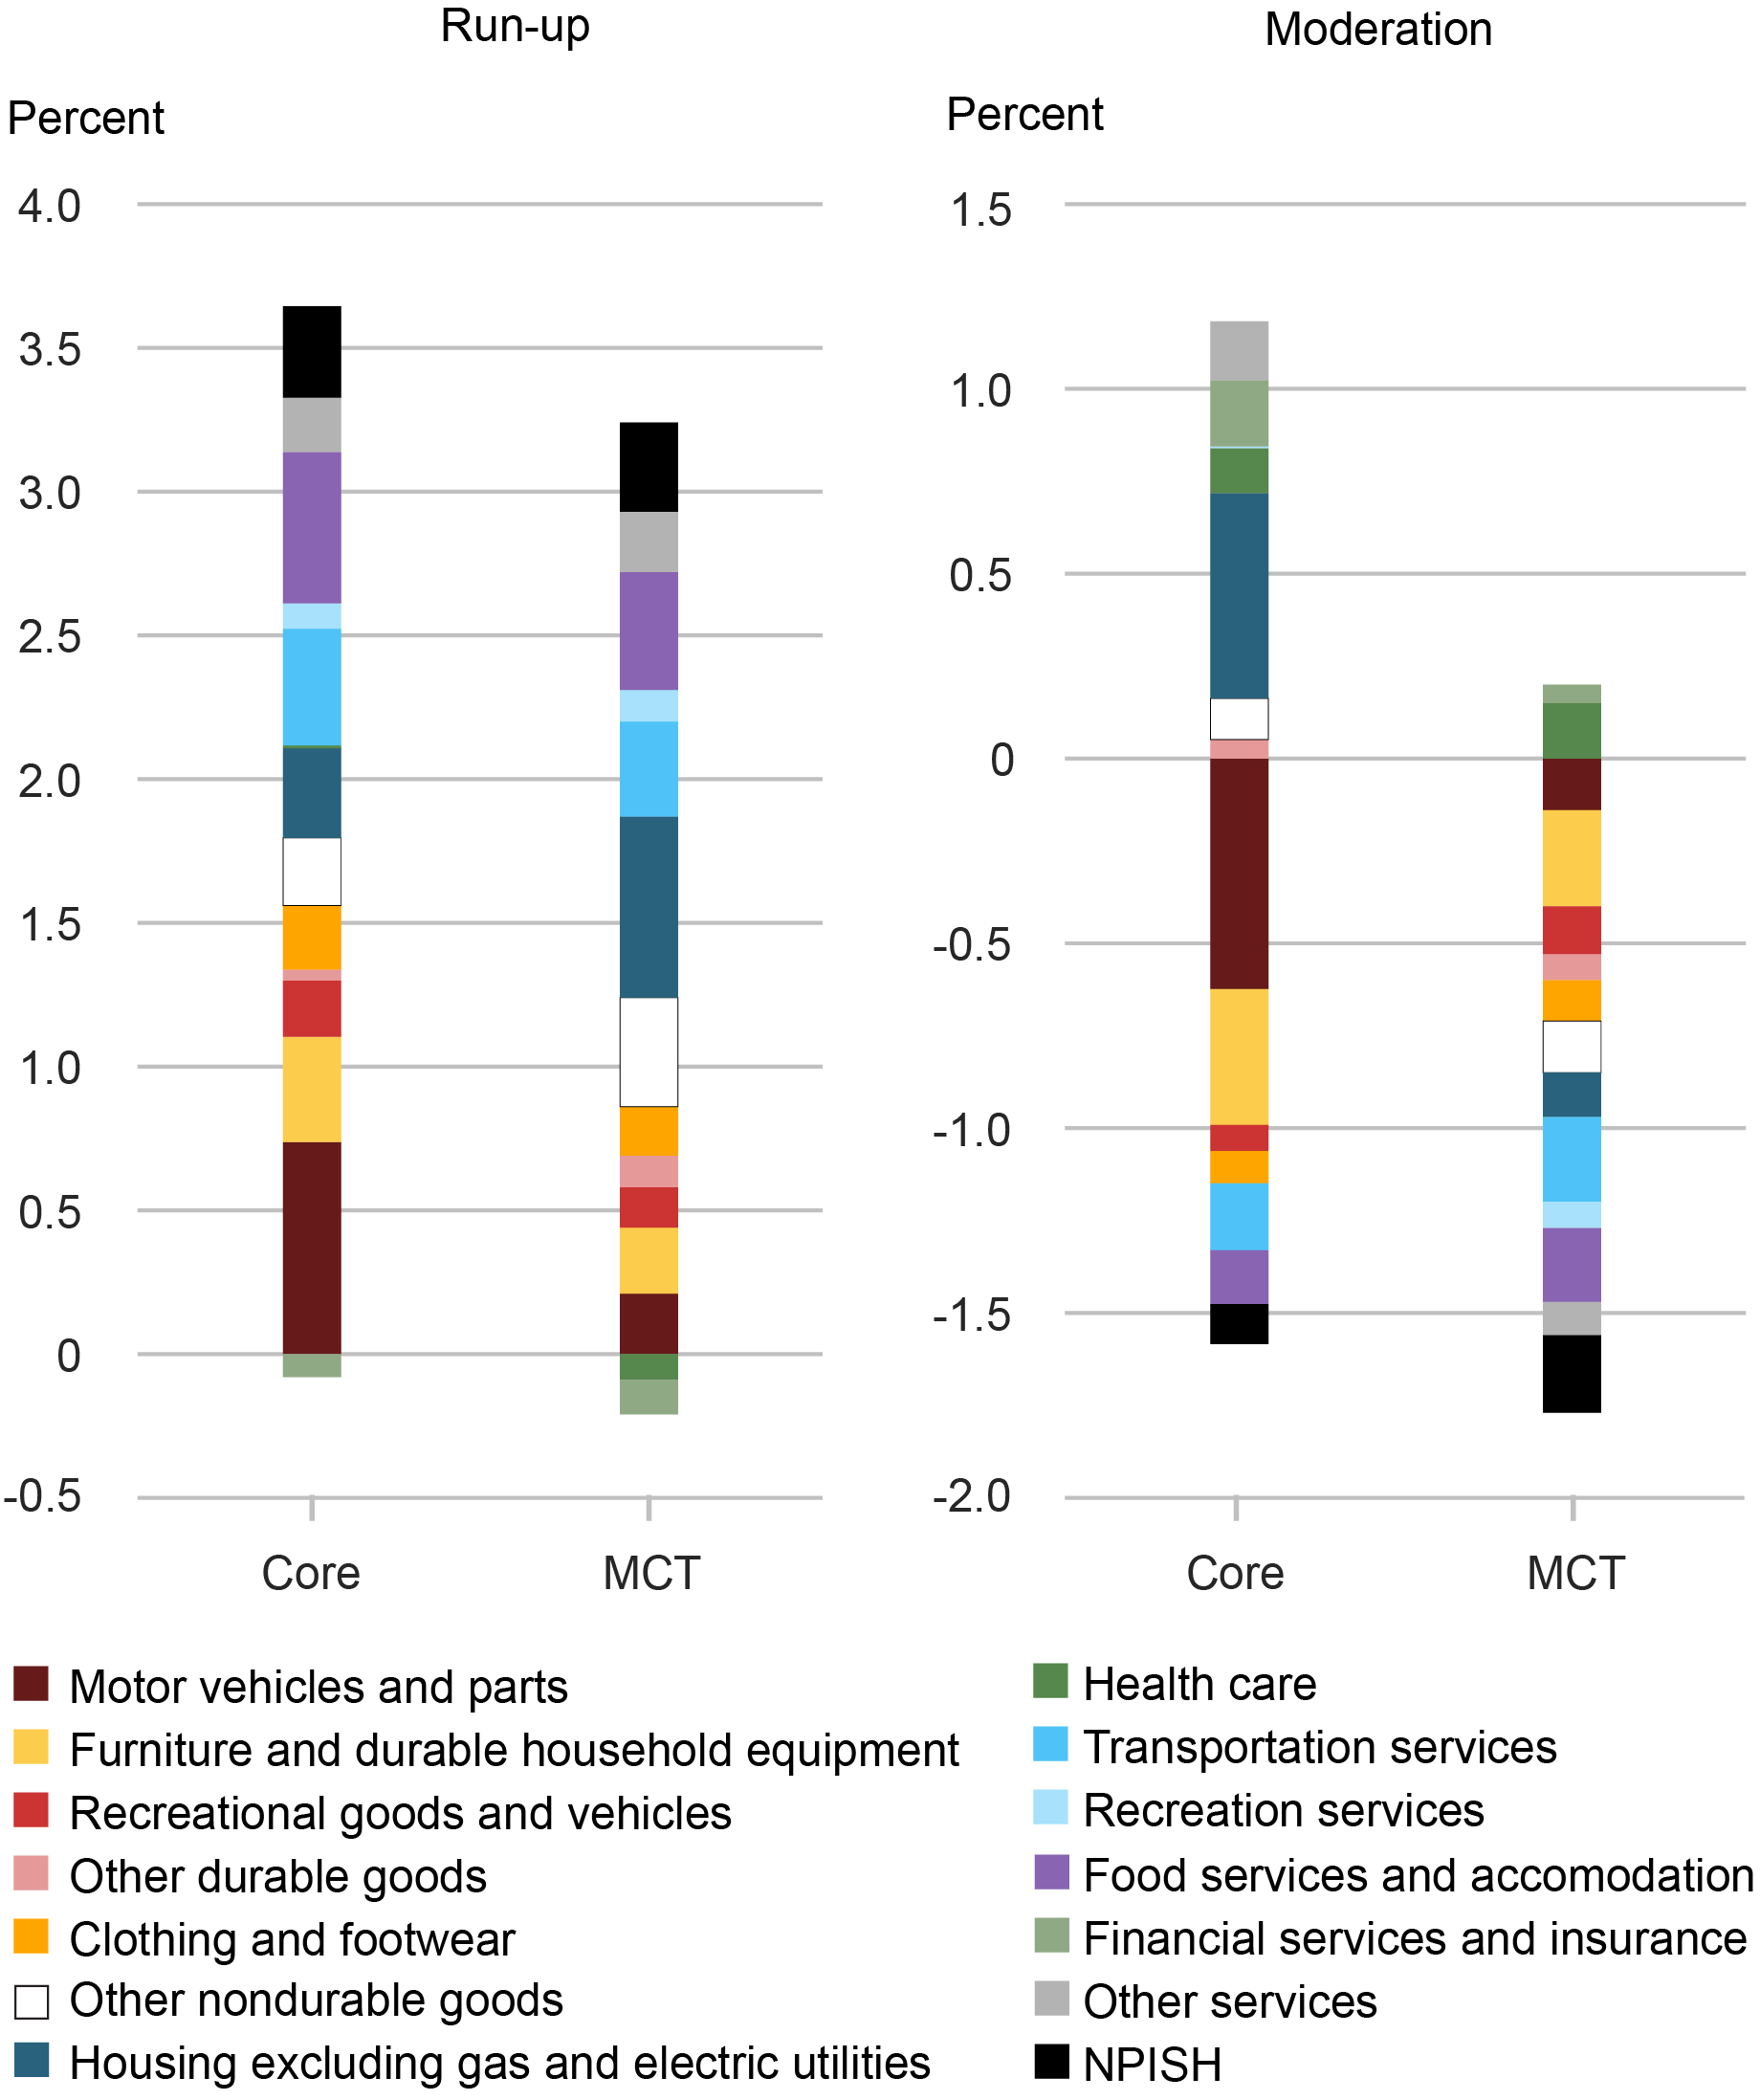
Notes: Core is core PCE inflation. MCT is MCT inflation. NPISH is nonprofit institutions serving households.
Indeed, while the decline in the inflation trend since early 2023 was initially due to declines in the aggregate core goods and non-housing services inflation, it is the moderation in month-on-month housing inflation that explains a large part of the decline in overall inflation persistence in the most recent months. This moderation, arguably due to prices of new rental contracts, is captured more clearly by the MCT model by its own design.
Conclusion
Post-pandemic imbalances have led to inflation rising well above policymakers’ longer-run objective. The MCT framework provides a model-based, sectoral perspective on inflationary pressures: interpreting the interrelated dynamics of multiple sectors, the model helps tracking the extent to which inflation is a broad-based phenomenon and in which sectors it remains most stubborn. Similarly, it helps interpreting the nature and the sources of the surge in inflation as well as its recent moderation.
Martín Almuzara is a research economist in Macroeconomic and Monetary Studies in the Federal Reserve Bank of New York’s Research and Statistics Group.

Babur Kocaoglu is a senior research analyst in the Federal Reserve Bank of New York’s Research and Statistics Group.
Argia Sbordone is the head of Macroeconomic and Monetary Studies in the Federal Reserve Bank of New York’s Research and Statistics Group.
How to cite this post:
Martin Almuzara, Babur Kocaoglu, and Argia Sbordone, “Where Is Inflation Persistence Coming From?,” Federal Reserve Bank of New York Liberty Street Economics, July 6, 2023, https://libertystreeteconomics.newyorkfed.org/2023/07/where-is-inflation-persistence-coming-from/.


Disclaimer
The views expressed in this post are those of the author(s) and do not necessarily reflect the position of the Federal Reserve Bank of New York or the Federal Reserve System. Any errors or omissions are the responsibility of the author(s).


Argentina Is One of the Most Regulated Countries in the World
In the coming days and weeks, we can expect further, far‐reaching reform proposals that will go through the Argentine congress.

Crypto, Crude, & Crap Stocks Rally As Yield Curve Steepens, Rate-Cut Hopes Soar
Crypto, Crude, & Crap Stocks Rally As Yield Curve Steepens, Rate-Cut Hopes Soar
A weird week of macro data – strong jobless claims but…

Fed Pivot: A Blend of Confidence and Folly
Fed Pivot: Charting a New Course in Economic Strategy Dec 22, 2023 Introduction In the dynamic world of economics, the Federal Reserve, the central bank…
