Economics
What’s New with Corporate Leverage?
The Federal Open Market Committee (FOMC) started increasing rates on March 16, 2022, and after the January 31–February 1, 2023, FOMC meeting, the lower…


The Federal Open Market Committee (FOMC) started increasing rates on March 16, 2022, and after the January 31–February 1, 2023, FOMC meeting, the lower bound of the target range of the federal funds rate had reached 4.50 percent, a level last registered in November 2007. Such a rapid rates increase could pass through to higher funding costs for U.S. corporations. In this post, we examine how corporate leverage and bond market debt have evolved over the course of the current tightening cycle and compare the current experience to that during the previous three tightening cycles.
How Has Corporate Bond Borrowing Evolved over the Cycle?
We begin by taking a detailed look at how nonfinancial firms have managed their U.S. corporate debt outstanding over the current and the previous three tightening cycles. With more than $6.7 trillion in amount outstanding as of the third quarter of 2022, the corporate bond market represents more than two-thirds of overall debt of nonfinancial firms in the U.S. and is thus a crucial funding market for nonfinancial firms. The chart below tracks the cumulative change in the total amount outstanding of U.S. corporate bonds as a function of the overall change (or cumulative tightening) in the target policy rate. Since the cumulative change in total amount outstanding reflects both new issuance and debt retirements due to either debt maturing, defaulting, or being called, we think of that change as reflecting the cumulative net issuance of nonfinancial corporate bonds.
In the current tightening cycle, cumulative net issuance has been slightly negative, indicating that the total amount outstanding of nonfinancial corporate bonds has declined as the FOMC has increased the target policy rate. In contrast, in all three of the previous tightening cycles, the total amount outstanding increased. As we noted in our post from January 2020, the large amount of cumulative net issuance that we observed in the 2015–18 tightening cycle in particular created a financial stability concern, a dynamic that we then saw play out during the March 2020 COVID-19-related market dislocations.
Cumulative Net Issuance Is Low Compared to Previous Cycles
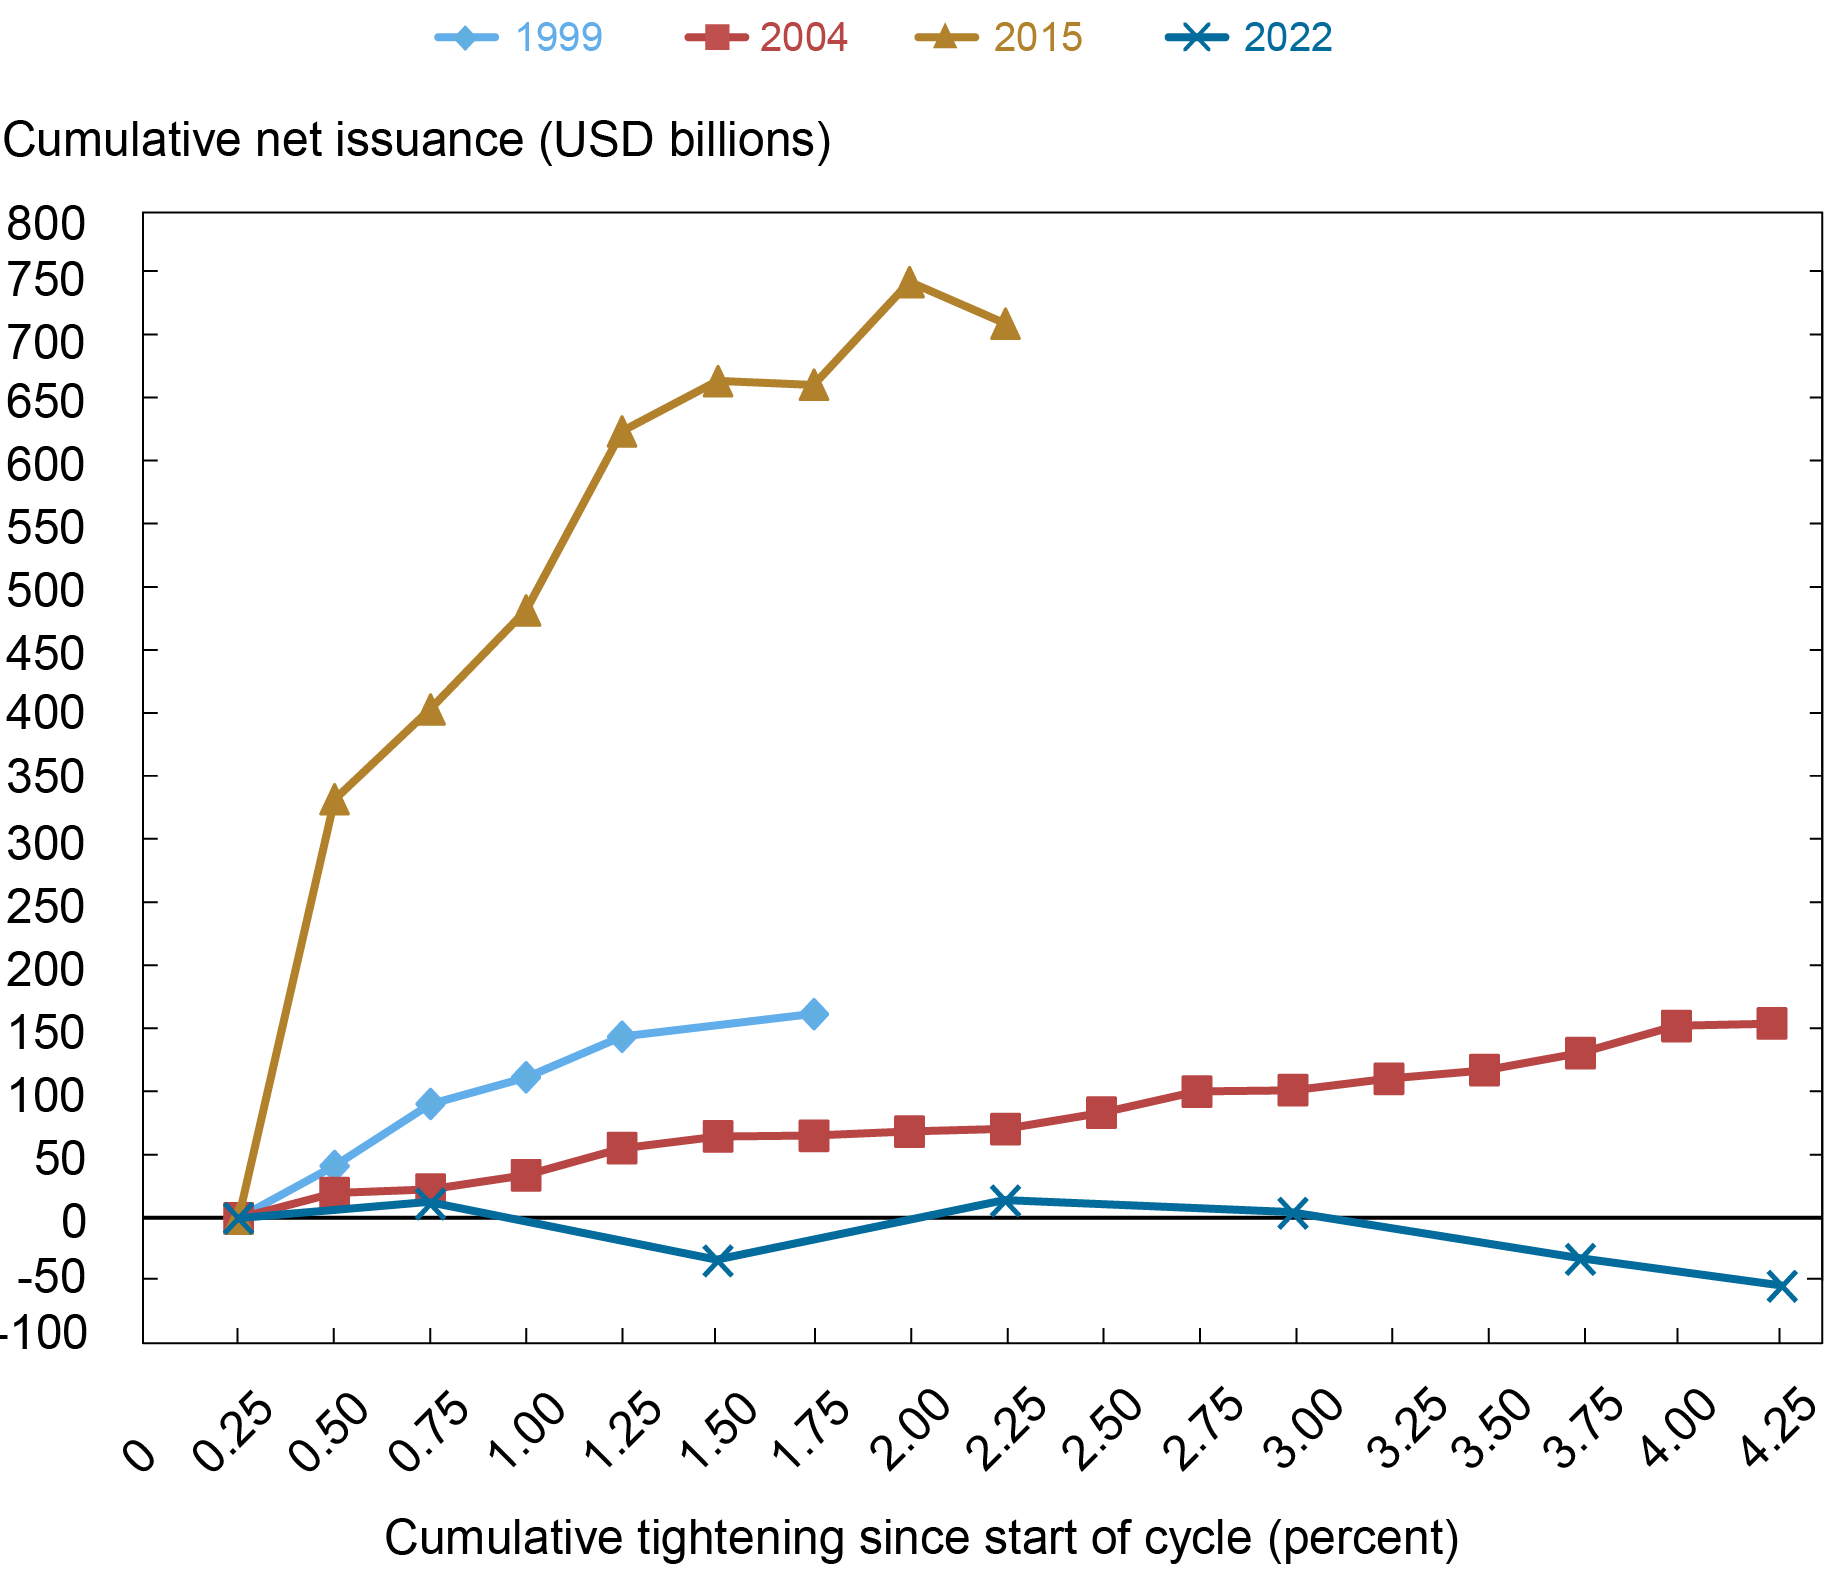
Note: The chart plots cumulative net corporate bond issuance by nonfinancial corporations.
One way in which a large amount of corporate bonds outstanding poses financial stability risks is through rollover risk: if a firm has to refinance debt during a period of rising interest rates, the costs of servicing that debt increase, potentially increasing the firm’s probability of default. When a large number of firms has to refinance debt at the same time, in a period of worsening economic outlook, this creates the risk of broad-based nonfinancial firm default. The next chart tracks the evolution of the weighted-average maturity of corporate bonds over the course of tightening cycles. The weighted-average maturity of corporate bonds outstanding has increased over the current tightening cycle by about four months, reducing the risk of a large rollover shock. While we observed a similar lengthening in the average time-to-maturity during the 2015 tightening cycle, both the 1999 and the 2004 tightening cycles saw a marked decline in corporate bond maturities. At the same time, the amount outstanding of callable bonds has declined over the current cycle, while the previous three tightening cycles saw an increase in callable amount outstanding, suggesting that firms have somewhat less flexibility in their coupon payment management than at the same point of previous cycles.
Weighted Average Time-to-Maturity Has Lengthened
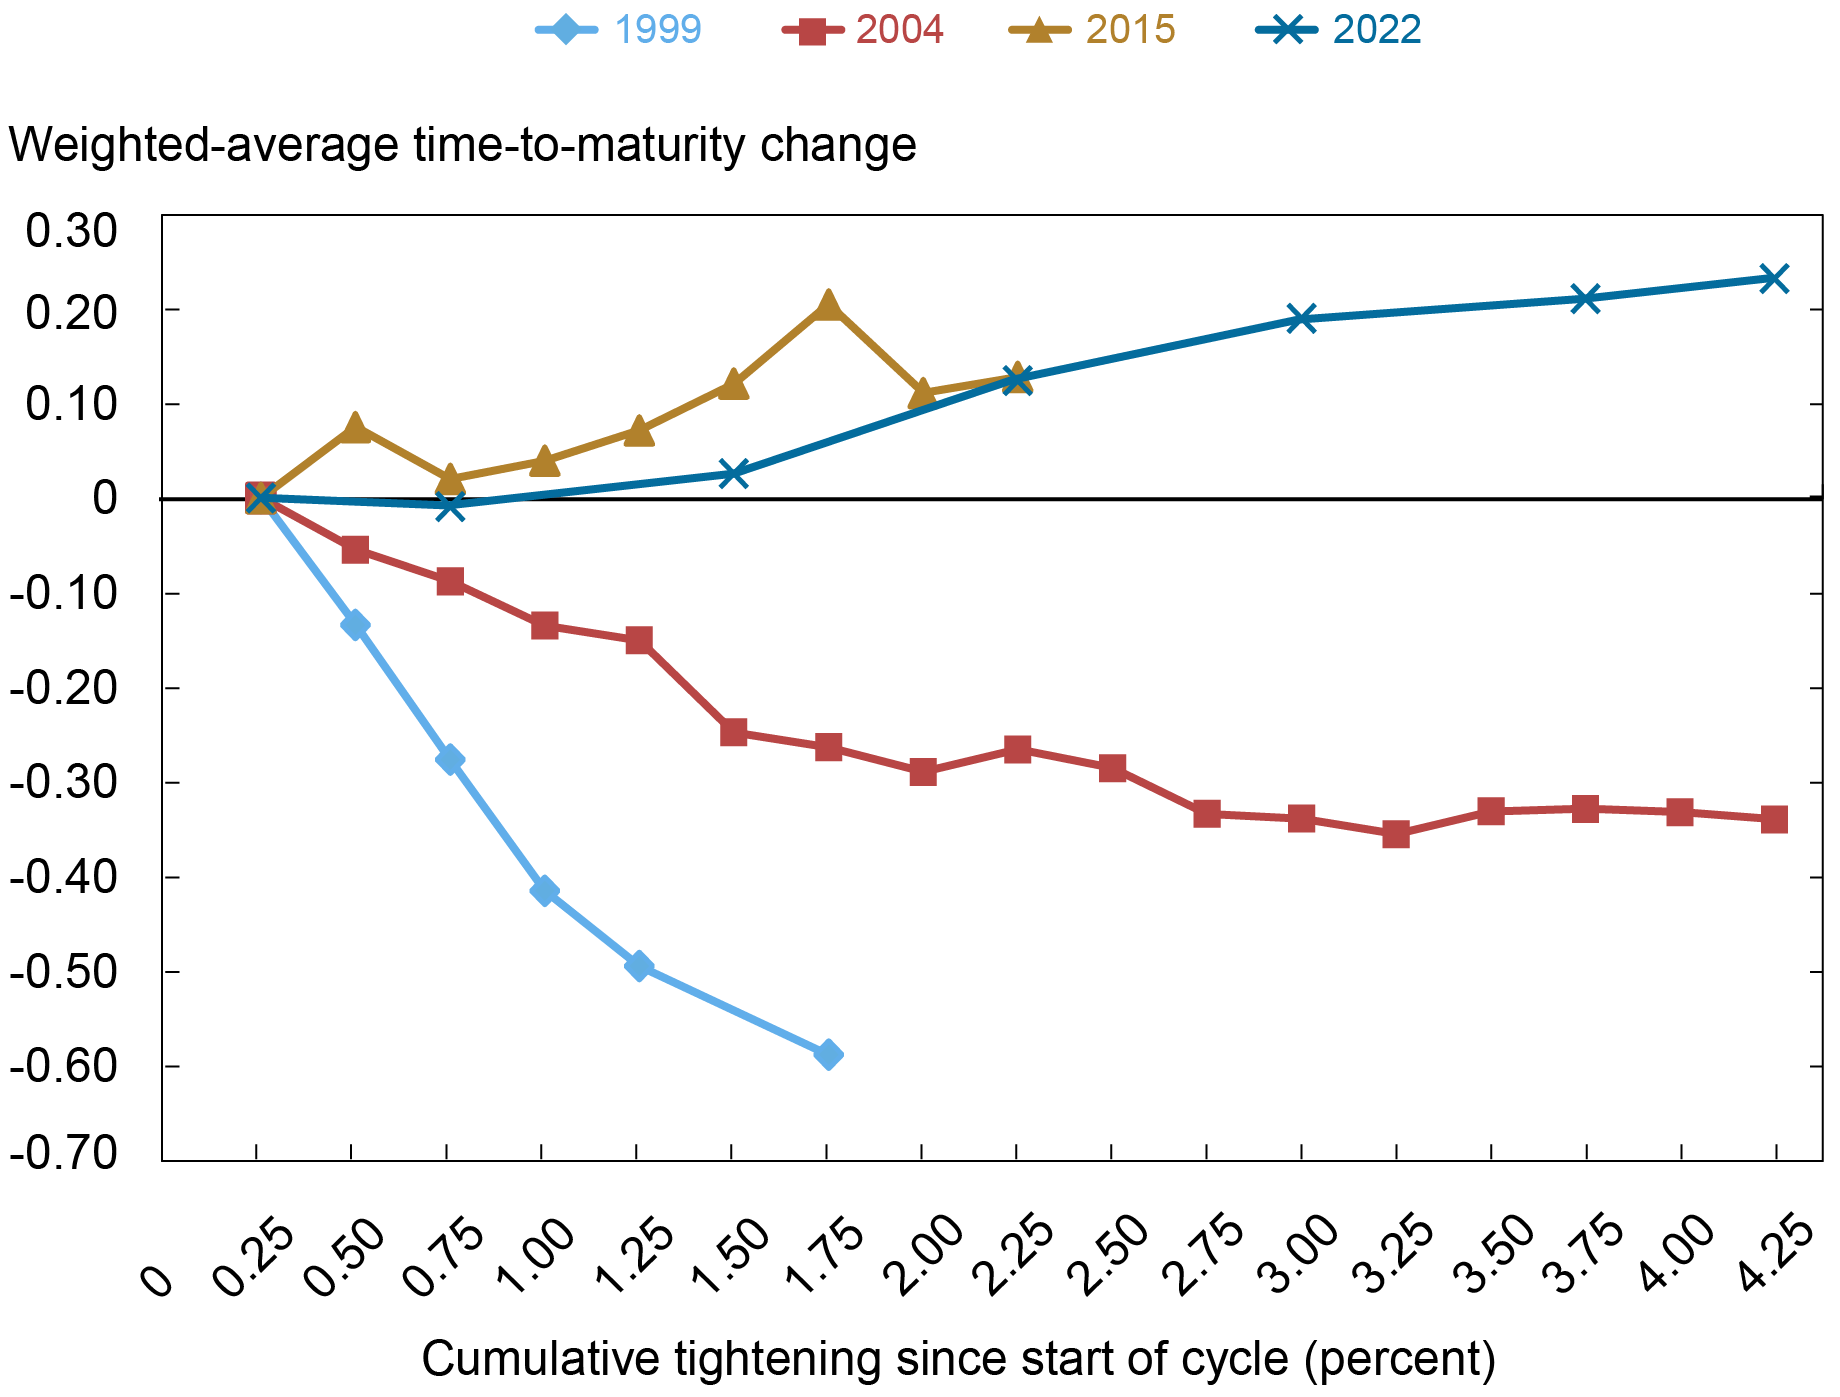
Note: The chart plots the weighted-average time-to-maturity of the amount outstanding for nonfinancial corporations relative to that at the start of each tightening cycle.
A natural question to ask is whether the decline in amount outstanding over the course of the current tightening cycle is due to a slowdown in issuance. Consistent with tighter monetary policy increasing borrowing costs for nonfinancial corporations, we see in the next chart that cumulative gross issuance has been subdued in the 2022 tightening cycle as compared to the previous three tightening cycles. As we documented in our November 2022 post, this slowdown in issuance follows record issuance in 2020 and 2021 and thus should not be interpreted as a sign of stress in the corporate bond market.
Cumulative Gross Issuance Is Also Subdued
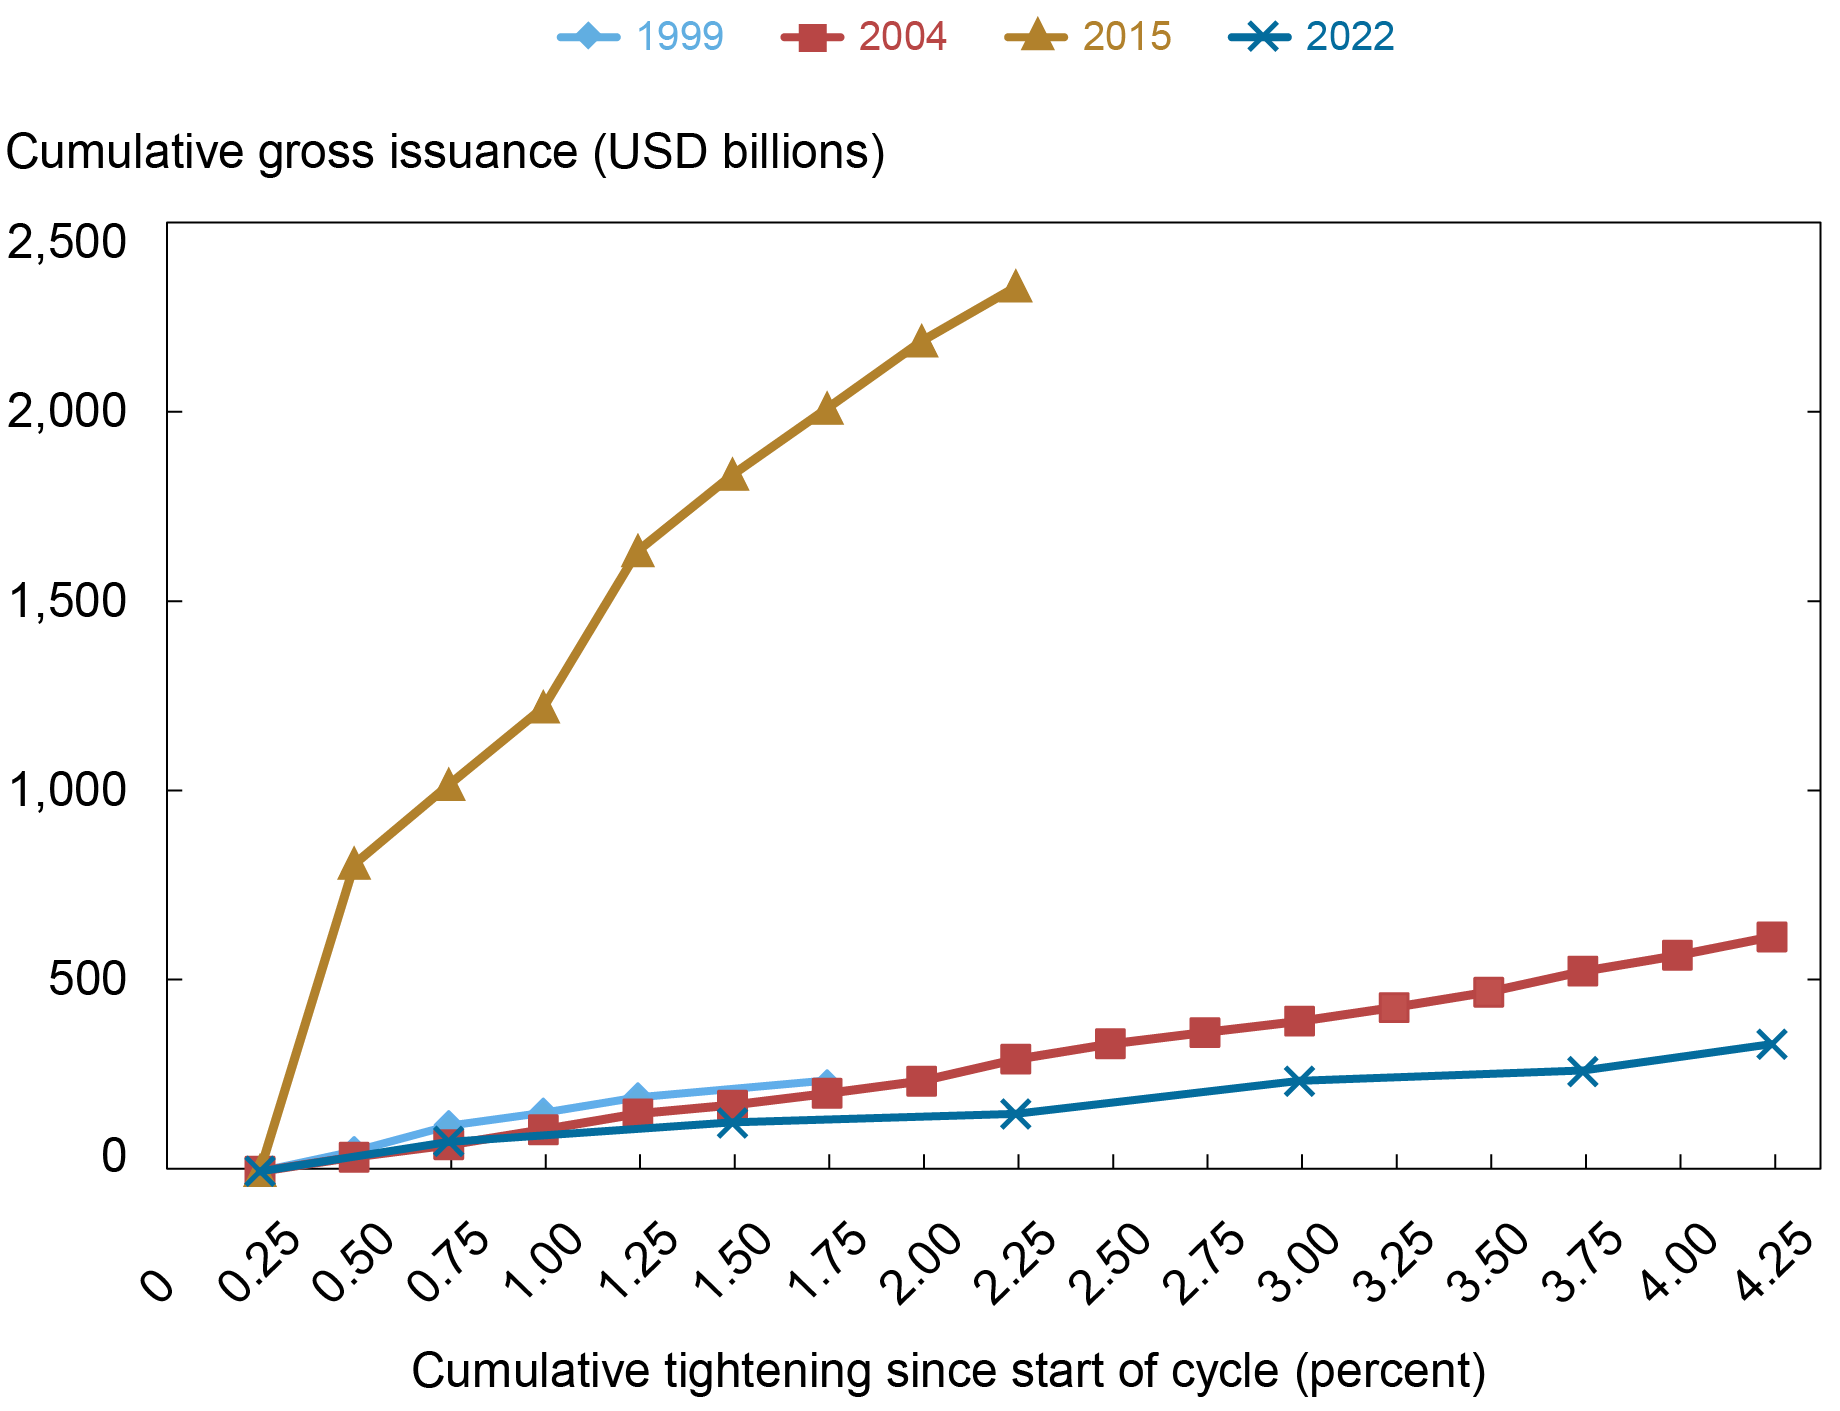
Note: This chart plots cumulative corporate bond issuance the since start of each tightening cycle by nonfinancial corporations.
Are There Emerging Signs of Risk for Nonfinancial Corporations?
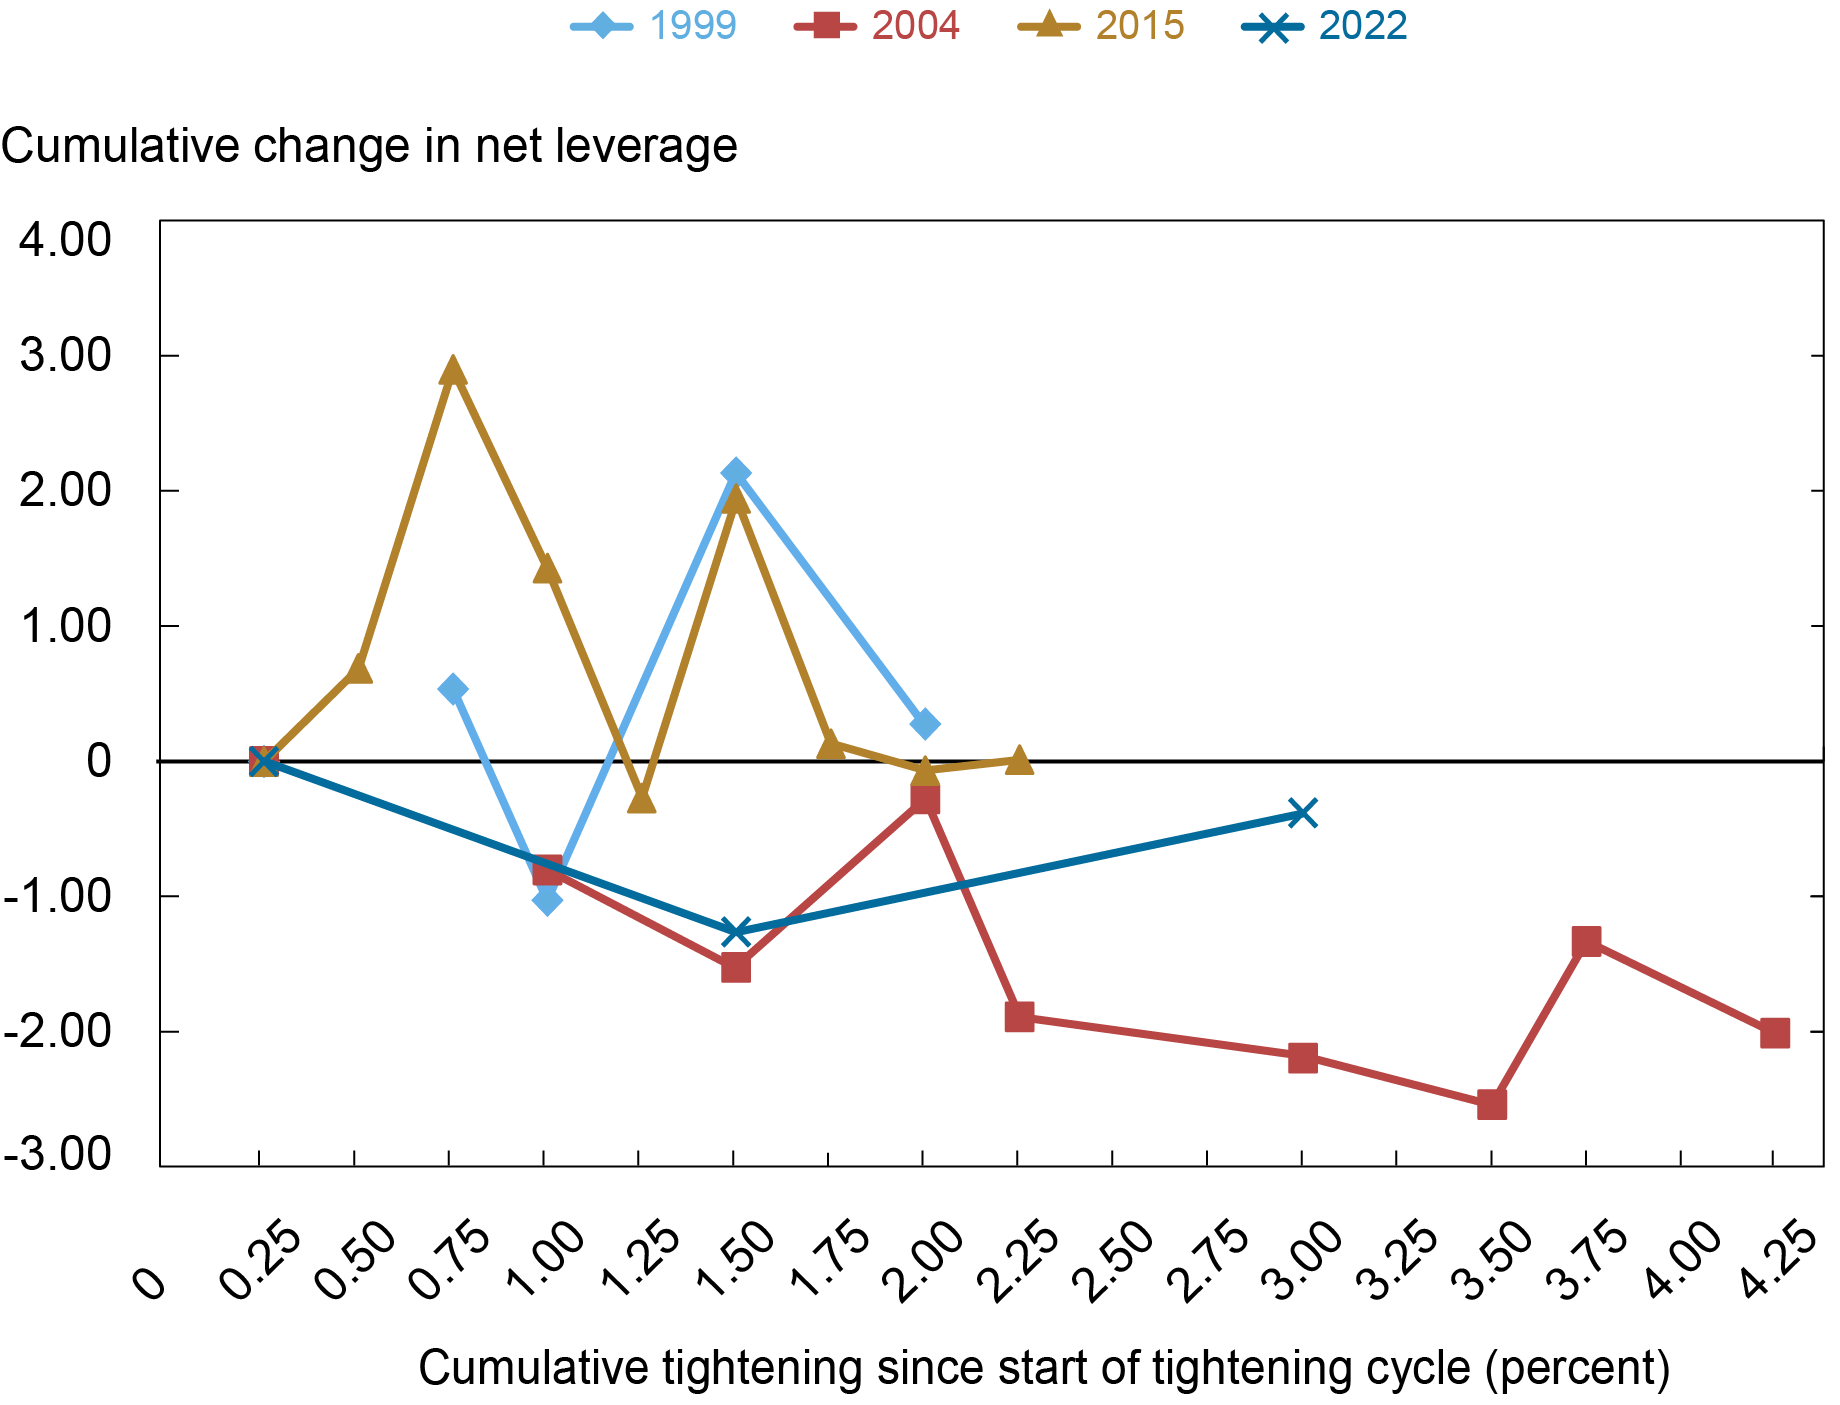
While focusing on the corporate bond market allows us to examine the characteristics of debt outstanding in detail, the overall health of nonfinancial firms’ balance sheets is better represented by net leverage—the ratio between a firm’s total debt, less cash and short-term investments, and the firm’s EBITDA. In the next chart, we see that, unlike the previous three tightening cycles, the median net leverage of investment grade firms—that is, those rated higher than Baa- by Moody’s or BBB- by S&P or Fitch Ratings on a plurality rating basis—has been declining noticeably. Net leverage, in contrast, remained flat or increased over the course of the previous three tightening cycles, suggesting that investment grade firms may have relatively healthy balance sheets currently.
Net Leverage for Investment-Grade Firms Has Declined
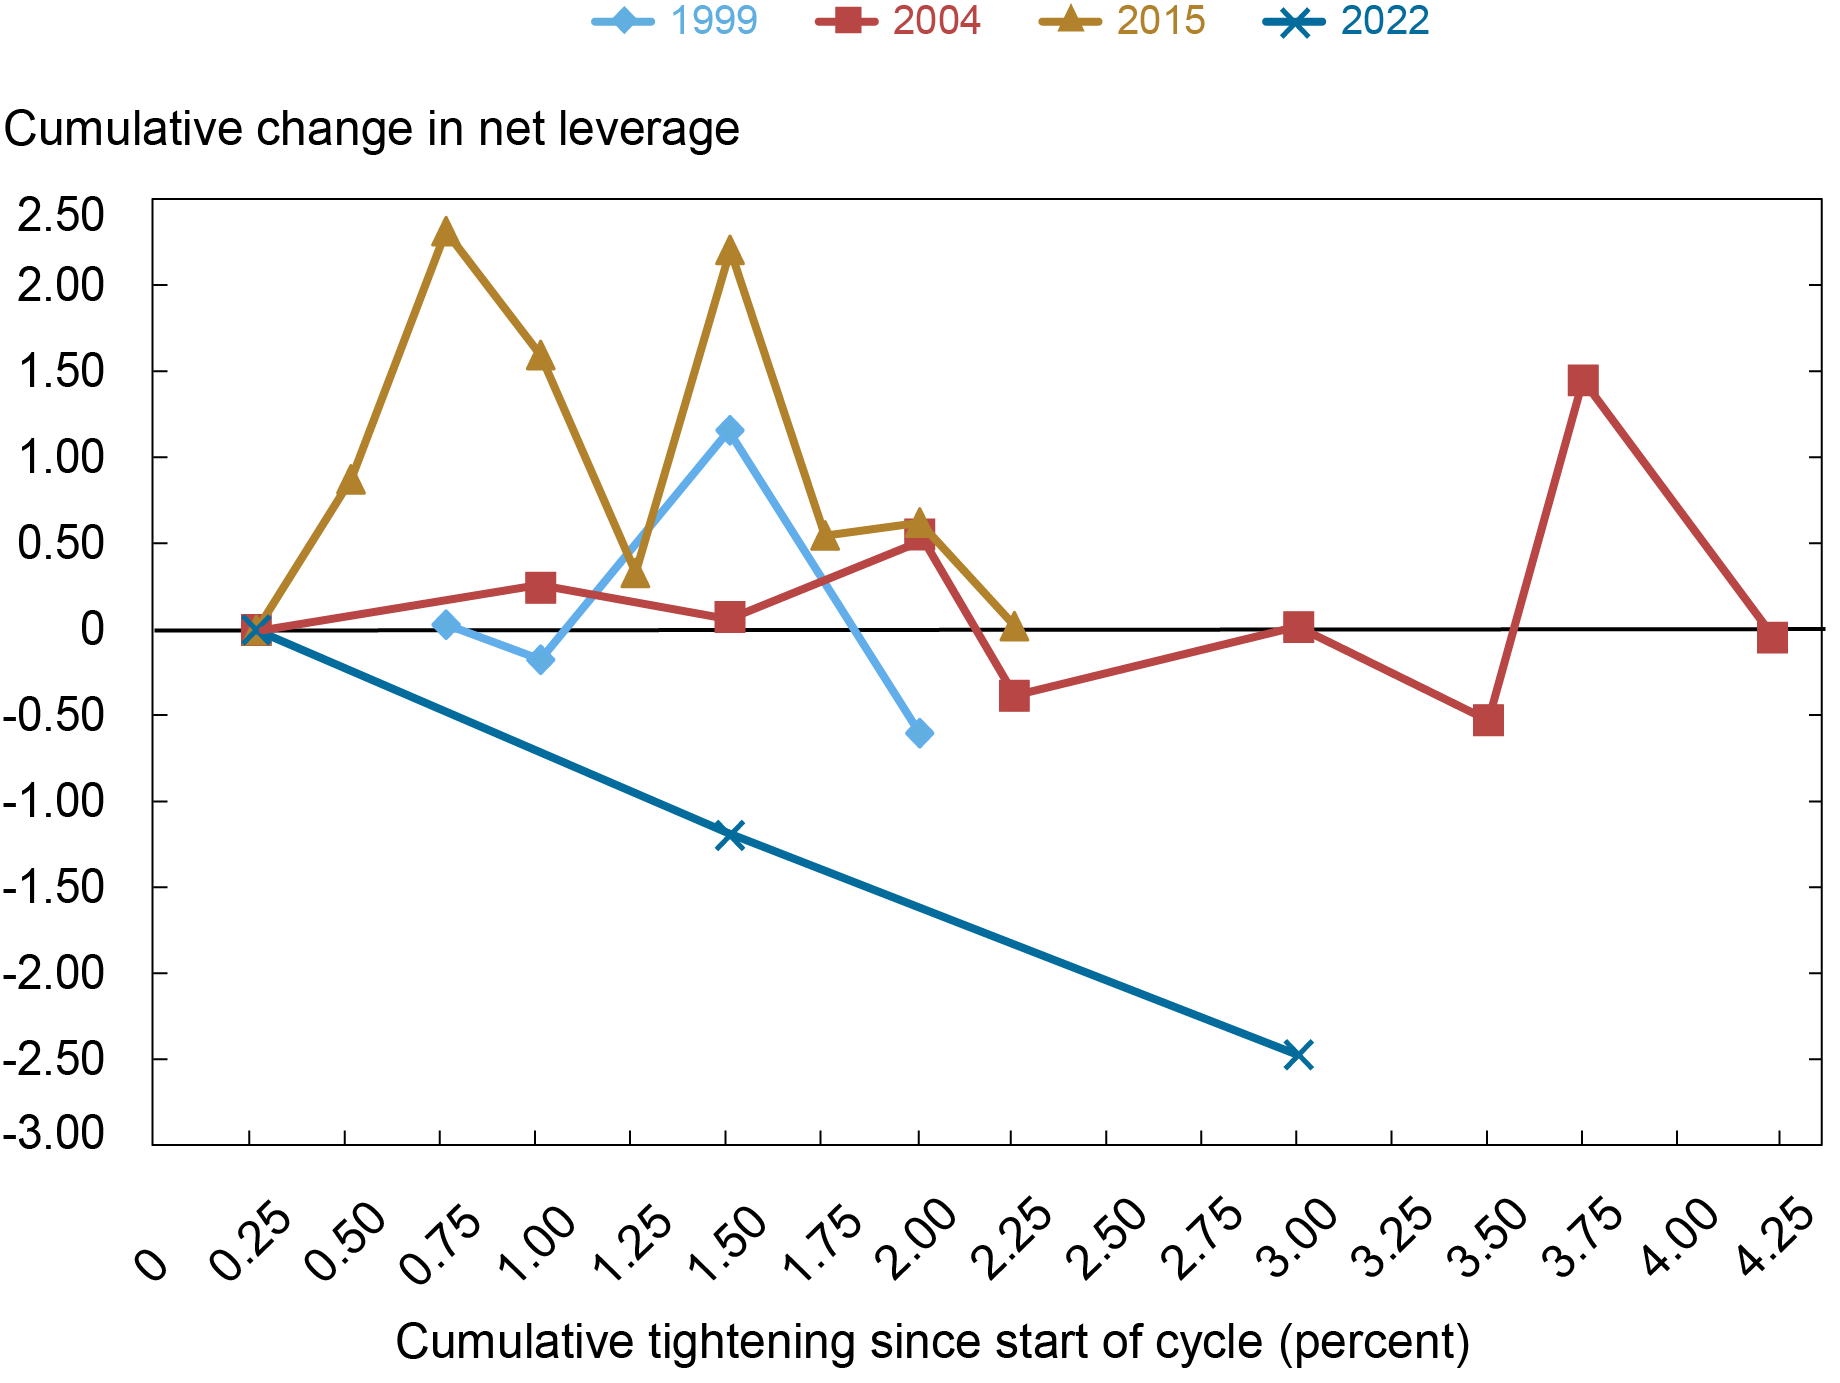
Notes: This chart plots the cumulative change in median net leverage for nonfinancial corporations since the start of the tightening cycle. Net leverage is defined as the ratio between a firm’s total debt, less cash and short-term investments, and the firm’s EBITDA. Investment-grade firms are identified as those whose plurality long-term debt rating across S&P, Moody’s, and Fitch Ratings is BAA-/BBB- or higher.
Finally, turning to net leverage for high-yield firms, we see in the next chart that the evolution of balance sheets for those firms is much more in line with that experienced over the previous three cycles. That is, while higher-rated investment-grade firms have been able to reduce their net leverage over the course of the current tightening cycle, net leverage of high-yield firms has remained stable.
Net Leverage for High-Yield Firms Has Remained Stable
Notes: This chart plots cumulative change in median net leverage for nonfinancial corporations since the start of the tightening cycle. Net leverage is defined as the ratio between a firm’s total debt, less cash and short-term investments, and the firm’s EBITDA. High-yield firms are identified as those whose plurality long-term debt rating across S&P, Moody’s, and Fitch Ratings is BA+/BB+ or lower.
Conclusion
Leverage allows nonfinancial firms to invest and grow, but high levels of corporate leverage increase the probability of downgrades and defaults. So far, nonfinancial firms have managed to lengthen the maturity of their bonds outstanding through the current tightening cycle, decreasing the risks of refinancing down the road. From the comparison to previous tightening cycles we learn that net leverage of investment-grade firms, which represent 65 percent of all sales by rated firms in the U.S., has been declining noticeably, suggesting that investment-grade firms may have relatively healthy balance sheets currently. Nevertheless, the large fraction of issuers at the lower end of the investment-grade spectrum poses a continuing financial vulnerability and only time will tell how these firms will adjust to the new interest rate environment.
Nina Boyarchenko is the head of Macrofinance Studies in the Federal Reserve Bank of New York’s Research and Statistics Group.
Or Shachar is a financial research advisor in Capital Markets Studies in the Federal Reserve Bank of New York’s Research and Statistics Group.
How to cite this post:
Nina Boyarchenko and Or Shachar, “What’s New with Corporate Leverage?,” Federal Reserve Bank of New York Liberty Street Economics, April 7, 2023, https://libertystreeteconomics.newyorkfed.org/2023/04/whats-new-with-corporate-leverage/.


Disclaimer
The views expressed in this post are those of the author(s) and do not necessarily reflect the position of the Federal Reserve Bank of New York or the Federal Reserve System. Any errors or omissions are the responsibility of the author(s).
monetary
markets
reserve
policy
interest rates
monetary policy


Argentina Is One of the Most Regulated Countries in the World
In the coming days and weeks, we can expect further, far‐reaching reform proposals that will go through the Argentine congress.

Crypto, Crude, & Crap Stocks Rally As Yield Curve Steepens, Rate-Cut Hopes Soar
Crypto, Crude, & Crap Stocks Rally As Yield Curve Steepens, Rate-Cut Hopes Soar
A weird week of macro data – strong jobless claims but…

Fed Pivot: A Blend of Confidence and Folly
Fed Pivot: Charting a New Course in Economic Strategy Dec 22, 2023 Introduction In the dynamic world of economics, the Federal Reserve, the central bank…


