Economics
What Rising Bond Yields Mean for Stocks
Treasury yields are breaking out and Bill Ackman doesn’t see them falling … losses from credit card companies are soaring … home sales are down,…

Treasury yields are breaking out and Bill Ackman doesn’t see them falling … losses from credit card companies are soaring … home sales are down, home prices are up … two powerful trading tools
As I write Monday morning, government bonds continue getting slaughtered…and more cracks are showing in the economy.
The 10-year Treasury yield has surged up to 4.53%. This is the highest level since 2007. Meanwhile, both the 5-year note and the 30-year bond are jumping too, hitting their highest levels since 2007 and 2011, respectively.
For months now in the Digest, we’ve been urging readers to be aware of what a “return to normal” looks like in terms of the fed funds rate and treasury yields. This is critical because the potential for higher baseline rates and yields will have a profound impact on your stock portfolio.
Investors have short memories. We look back at the 2010s and think that those halcyon days of low inflation, low fed funds rates, and low treasury yields were normal and where we’re headed once we win this fight against inflation.
Sorry, but no. Here’s the reality:
- Average fed funds rate in the 2010s: 0.609%.
- Average long-term fed funds rate: 4.60%
- Average 10-year Treasury yield in the 2010s: 2.17%.
- Average long-term 10-year Treasury yield: 5.88%.
We’re not the only ones predicting a higher baseline for rates and yields to come. Last week, billionaire investor Bill Ackman posted his thoughts to X (formerly Twitter).
Below are excerpts. Regular Digest readers will recognize many themes/concerns we’ve covered in our issues over recent weeks/months:
I believe that long-term rates, e.g, 30-year rates, will rise further from here…
The world is a structurally different place than it was. The peace dividend is no more. The long-term deflationary effects of outsourcing production to China are no more…
Energy prices are rising rapidly. Not refilling the SPR was a misguided and dangerous mistake…
The green energy transition is and will remain incalculably expensive. And higher gas prices will raise inflationary expectations. Just ask your average American. They see the prices at the pump and in the grocery store and don’t believe inflation is moderating.
Our national debt is $33 trillion and rising rapidly. There is no sign of fiscal discipline by either party or by the presumptive presidential nominees…
The government is selling hundreds of billions of bills, notes and bonds weekly. China and other foreign nations, historically major buyers of our debt, are now selling. And the QT unwind experiment has barely begun…
The long-term inflation rate is not going back to 2% no matter how many times Chairman Powell reiterates it as his target.
If your portfolio’s future gains require a return to low rates and low yields, be aware of all the influences pushing against such a market environment today.
Meanwhile, credit card losses are soaring at the fastest pace since the Great Financial Crisis
According to Goldman Sachs, credit card companies are suffering losses at a clip not seen in 30 years, with the notable exception of 2008.
Here’s CNBC:
Losses currently stand at 3.63%, up 1.5 percentage points from the bottom, and Goldman sees them rising another 1.3 percentage points to 4.93%.
This comes at a time when Americans owe more than $1 trillion on credit cards, a record high, according to the Federal Reserve Bank of New York.
The Goldman analyst noted that what makes this unusual is that the losses are accelerating outside of an economic downturn.
Excuse us for rolling our eyes.
In recent months in the Digests, we’ve repeatedly pointed toward the incongruence between the alleged “resilient” U.S. consumer and the true condition of the consumer. We’ve highlighted how consumer strength is smoke and mirrors based on artificially boosted stimulus dollars and record-setting consumer spending on credit cards at record-setting interest rates.
At some point, this resilient U.S. consumer will be revealed as not so resilient. This credit card loss data is a sign that we’re getting closer to that point.
Now, as I discussed this with my fellow-Digest-writer Luis Hernandez, he made a good point: the overall delinquency rate remains low.
As you’ll see in the chart below, he’s correct, and it presents two perspectives we need to balance.
Do we put more weight on the relatively low absolute value of delinquencies today? Or do we put more weight on the steep slope of those delinquencies?
Both are important to consider. Personally, I give “slope” a heavier weighting since I view this steep angle as indicative of where things are headed.
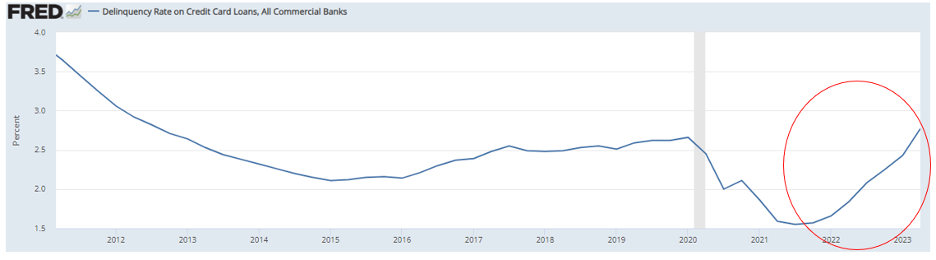 Source: Federal Reserve data
Over in the housing sector, home sales keep falling as home prices keep rising
According to the National Association of Realtors, sales of existing homes dropped 0.7% in August. And compared with August of one year ago, sales are down more than 15%.
As we’ve profiled in the Digest, owners of existing homes have no reason to sell. They’re sitting on 3% mortgage rates while today’s mortgage rates are 7%+. Worse, the National Association of Realtors Chief Economist Lawrence Yun thinks 8% is on the table.
Lack of existing home supply is pushing prices higher. The median price of a home sold in August was $407,100. That’s up 3.9% from a year ago. It also happens to be the highest reported price for the month of August – ever.
Circling back to our first story today – how Bill Ackman argues inflation isn’t going back to 2% – consider how these nosebleed home prices are going to affect our inflation data in 2024…
Experts suggest there’s a 12-month delay between real-time home price changes and when those changes are reflected in inflation reports like the Consumer Price Index and the Personal Consumption Expenditure Index.
With that in mind, look at the chart below of the S&P/Case-Shiller U.S. National Home Price Index. I’ll draw your attention to two points.
First, look at June 2022, circled in green. That’s when home prices topped out last summer and began falling.
Second, there’s January 2023, circled in red. That’s when home prices began climbing again.
Take a look and then we’ll provide commentary.
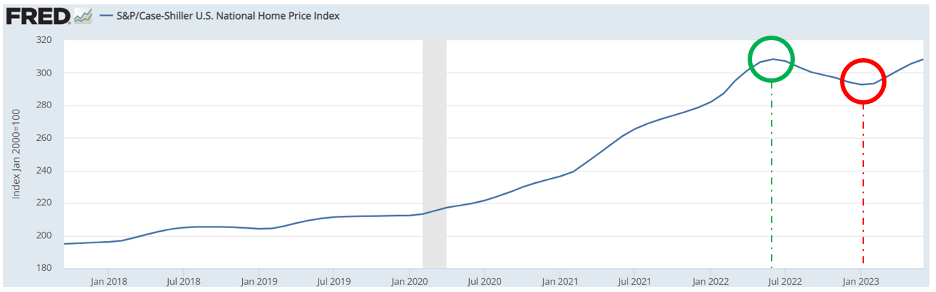 Source: Federal Reserve data
So, we had falling home prices from last June through last January.
If there’s a 12-month delay, that means we’re currently enjoying the fruits of those declining home prices in our inflationary data.
But what’s on the way this coming January?
That’s when we begin seeing last January’s uptick in home prices as they march back toward all-time highs.
And given how home/shelter costs command massive weightings in our inflation indexes, why in the world are some bulls expecting inflation to gracefully slide lower and lower next year?
By extension, if inflation will have a significant tailwind next year when the Fed is wrestling with its interest rate policy, why would we expect it to be slashing rates?
Well, we shouldn’t.
Federal Reserve Chairman Powell said as much at his press conference last week. The Fed went from projecting four rate cuts next year to just two. And if inflation surges in part because of these housing prices, perhaps it won’t even be two (barring a recession).
Bottom line: Realize how all these macro pieces are fitting together and recognize what’s out on the horizon.
As regular Digest readers know, we’ve suggested that a “trading” mentality can help investors adapt to this challenging market
This means riding the bullishness for as long as it’s here without committing to those positions as long-term, buy-and-hold additions to your portfolio.
Instead, use wise position sizes, maintain your stop-losses, and just ride the winners until the situation sours. At that point, move on to the next bullish set-up.
Let’s zero in on two fantastic tools to help you achieve this – one that’s “offensive,” and the other “defensive.”
As to “offense,” last week, our hypergrowth expert Luke Lango debuted his new, state-of-the-art AI-powered trading system, Prometheus.
It was trained on hundreds of thousands of financial market data points, with the sole purpose of pinpointing when a stock is about to surge higher. It scans the entire stock market every week to gauge the probability that a given stock will surge higher in price over the next month.
The higher the score, the more likely the stock is to surge over the next month. The lower the score, the less likely.
Below is a screenshot of Prometheus. As I write, it’s giving Nvidia a score of 65. Not bad, but certainly not super-high.
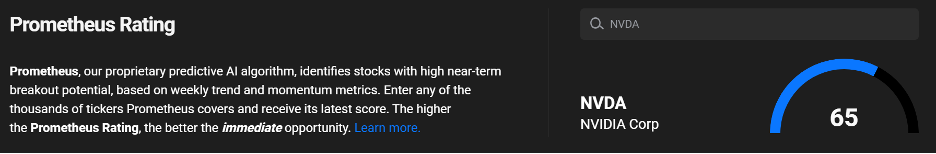
If you’re looking to add firepower to your portfolio even in a tough market environment, that’s what Prometheus is engineered to do.
Today, is the last day we’re making Luke’s presentation from last week available. To watch a free replay, click here.
Turning to “defense,” one of my oft-repeated phrases is “mind your stop-losses”
For anyone less familiar, a stop-loss is a predetermined price at which you’ll sell a stock to either lock in gains or prevent further losses.
The challenge with a stop-loss is “what’s the right amount to use?”
Luke captured this dynamic in a recent issue of AI Investor:
Below, we compare two stocks: perennial blue-chip Coca-Cola (KO) and Matador Resources (MTDR), an oil and gas exploration company.
From October of 2021 through mid-May of 2022, both stocks climbed exactly 27%. But the paths they took to get there were wildly different.
See for yourself. Matador is in black. Coke is in green.
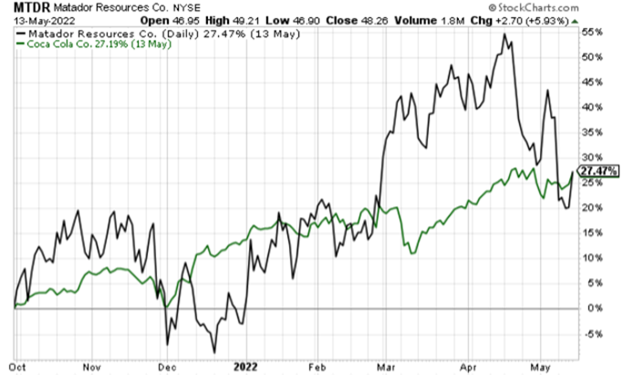 Source: StockCharts.com
Coke’s path is far smoother than Matador’s comparatively “violent” series of ups and downs.
Given this, would using the same stop-loss percentage have been appropriate for both stocks?
Clearly not. That would have ignored the reality that Matador’s normal volatility is far greater than that of Coke’s.
But that doesn’t mean Matador is a “riskier” stock. It just means traders need to factor this greater volatility into their position sizing, trade expectations, and stop-loss levels.
Failing to do so, and trying to trade Matador in the same way you would Coca-Cola, would result in a stop-loss that’s too tight. And that will mean one thing…
Goodbye, Matador. And goodbye to those eventual 27% gains (or far more had the stop-loss taken out the trade in late April).
Point is, it’s critical to have a stop-loss that’s tailored to the specific volatility of each unique stock you own.
On that note, I’ll point you toward an event Wednesday night with our macro expert Eric Fry and Keith Kaplan, the CEO of our corporate partner, TradeSmith
At what they’re calling the 11X Accelerator Event, Eric and Keith will discuss TradeSmith’s tool that gives investors the ability to boost their returns by as much as 11-fold. It does this by helping them avoid selling too early (missing gains that can make all the difference in a portfolio) while also helping them not hold too long (preventing reasonable losses from becoming catastrophic losses).
It does this, in part, by identifying a tailored stop-loss amount for any given stock’s unique volatility level.
Eric and Keith will cover all the details and answer your questions Wednesday night at 8:00 PM Eastern. To reserve your seat, just click here.
We’ll keep you updated on all today’s stories here in the Digest.
Have a good evening,
Jeff Remsburg
More From InvestorPlace
- Musk’s “Project Omega” May Be Set to Mint New Millionaires. Here’s How to Get In.
- ChatGPT IPO Could Shock the World, Make This Move Before the Announcement
- It doesn’t matter if you have $500 or $5 million. Do this now.
The post What Rising Bond Yields Mean for Stocks appeared first on InvestorPlace.
inflation
reserve
policy
interest rates
fed
inflationary
deflationary


Argentina Is One of the Most Regulated Countries in the World
In the coming days and weeks, we can expect further, far‐reaching reform proposals that will go through the Argentine congress.

Crypto, Crude, & Crap Stocks Rally As Yield Curve Steepens, Rate-Cut Hopes Soar
Crypto, Crude, & Crap Stocks Rally As Yield Curve Steepens, Rate-Cut Hopes Soar
A weird week of macro data – strong jobless claims but…

Fed Pivot: A Blend of Confidence and Folly
Fed Pivot: Charting a New Course in Economic Strategy Dec 22, 2023 Introduction In the dynamic world of economics, the Federal Reserve, the central bank…
