Economics
What Happens After The End Of Fed Rate-Hikes
What Happens After The End Of Fed Rate-Hikes
By Jessica Rabe of DataTrek
Fed Funds Futures think the Federal Reserve’s current rate hike…

What Happens After The End Of Fed Rate-Hikes
By Jessica Rabe of DataTrek
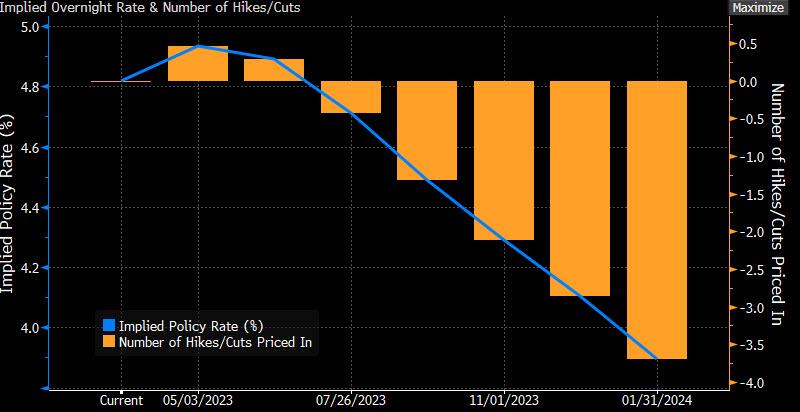
Fed Funds Futures think the Federal Reserve’s current rate hike cycle is over. In fact, they give over 50 percent odds of rate cuts starting in July. As a result, we’ve received client inquiries about what happens to US equities when the Fed stops increasing near-term rates.
Therefore, today we will look at the performance and volatility of US equities following the end of rate hike cycles back to 1990. We chose this timeframe because it captures the modern stock market when monetary policy became more transparent, so it is more comparable to today’s circumstances than previous rate cycles.
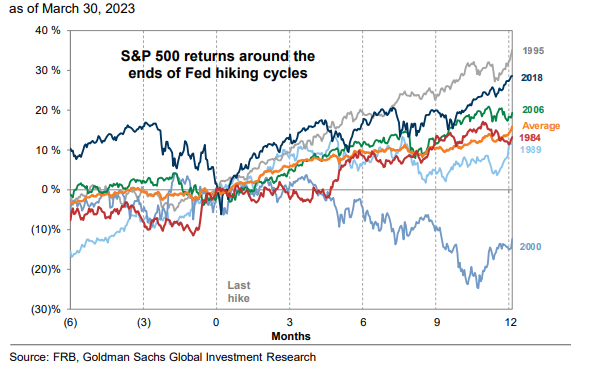
There have been 4 distinct rate hike cycles since the early 1990s. We exclude 1997 in this analysis, as it had just one rate increase of 25 basis points. First, here is how the S&P 500 performed in the month, 3 months, and year after these periods of monetary policy tightening:
January 31st, 1995 (the end of a rate cycle which started in February 1994):
- One month later: +3.6 pct
- 3-months later: +9.4 pct
- 1-year later: +35.2 pct
May 15th, 2000 (cycle started in June 1999):
- One month later: +1.8 pct
- 3-months later: +2.2 pct
- 1-year later: -14.0 pct
June 28th, 2006 (cycle started in June 2004):
- One month later: +2.6 pct
- 3-months later: +7.5 pct
- 1-year later: +20.8 pct
December 19th, 2018 (cycle started in December 2015):
- One month later: +5.0 pct
- 3-months later: +13.0 pct
- 1-year later: +27.9 pct
Average:
- One month later: +3.3 pct
- 3-months later: +8.0 pct
- 1-year later: +17.5 pct
Takeaway: US equities tend to rally in the month, 3 months and year after the Fed stops raising near-term rates. The only exception was in the year after the Fed’s last rate increase on March 15th, 2000 during the bursting of the dot com bubble. Aside from that one instance, the S&P was up a solid double digits (+28.0 pct) over the next year following a rate hike cycle. The “catch” – and it is a significant one – is that in every case the Fed started cutting rates in the 12 months after the end of each cycle.
As for measuring US equity volatility, we track how many times the S&P moves more than 1 percent up or down from close to close. That’s our preferred measure of how much investors “feel” real-time volatility. Two brief background points:
- Any one-day move greater than 1 percent to the upside or downside is +1 standard deviation from the S&P’s mean daily return since 1958 (first full year of data).
- During any given quarter and year, the S&P has averaged 13 and 55 one percent days respectively. That means there’s roughly 1 one percent day a week.
Now here’s how many one percent days there were in the month, 3 months and year after the Fed stopped raising rates over the last +3 decades:
January 31st, 1995:
- One month later: 1
- 3-months later: 3
- 1-year later: 18
May 15th, 2000:
- One month later: 9
- 3-months later: 21
- 1-year later: 103
June 28th, 2006:
- One month later: 6
- 3-months later: 8
- 1-year later: 27
December 19th, 2018:
- One month later: 9
- 3-months later: 13
- 1-year later: 42
Average:
- One month later: 6
- 3-months later: 11
- 1-year later: 48
Takeaway: US equity market volatility is usually around average in the month and 3 months after the Fed no longer increases rates, and below average in the following year. These trends make sense given that US equity returns and volatility are inversely correlated, so below average annual market choppiness coincided with the S&P posting a positive double digit return on average after a Fed rate hike cycle back to 1990. The one exception was again in 2000 to 2001 given weakening economic fundamentals during that period. Consequently, there were 103 one percent days in the year after March 15th, 2000 – almost double the average – while the S&P was down 14.0 pct. Higher volatility means more market uncertainty, hurting equity returns as a result.
Bottom line: Modern market history says if the Fed is done raising near-term rates and starts to cut them over the next year, US equities should rally over the next month, 3 months and year. Granted, this conclusion is based off a small sample size of the 4 most recent rate hike cycles, but that does capture how the market responds to a change in monetary policy with a more transparent Fed. Moreover, the early 2000s is a useful example to show that an economic shock can be more harmful than a monetary policy pivot proves helpful. While the Fed could cut rates later this year in response to a potential US recession, the severity of the economic contraction could trump an accommodative policy response as it did in the early 2000s. Additionally, unlike the other 4 periods in which the Fed decided to stop raising rates, the central bank is now fighting lasting elevated inflation. This dynamic limits the Fed’s ability to turn more dovish as the US economy cools.
Overall, this data points to a cautiously optimistic outlook for US equities with the Fed at or nearing the end of its rate hike cycle.
Tyler Durden
Thu, 04/06/2023 – 14:45
inflation
monetary
reserve
policy
fed
central bank
bubble
monetary policy


Argentina Is One of the Most Regulated Countries in the World
In the coming days and weeks, we can expect further, far‐reaching reform proposals that will go through the Argentine congress.

Crypto, Crude, & Crap Stocks Rally As Yield Curve Steepens, Rate-Cut Hopes Soar
Crypto, Crude, & Crap Stocks Rally As Yield Curve Steepens, Rate-Cut Hopes Soar
A weird week of macro data – strong jobless claims but…

Fed Pivot: A Blend of Confidence and Folly
Fed Pivot: Charting a New Course in Economic Strategy Dec 22, 2023 Introduction In the dynamic world of economics, the Federal Reserve, the central bank…


