Economics
Weekly Market Pulse: History Lessons
One of the toughest things about navigating this bear market and the widely anticipated coming recession is that we’ve had to differentiate between real…
One of the toughest things about navigating this bear market and the widely anticipated coming recession is that we’ve had to differentiate between real and nominal economic and market variables like nothing in recent decades. There are very few market commentators today who have navigated an inflationary environment like the current one. I haven’t either of course which is why I’ve spent a lot of time over the last 18 months looking at history.
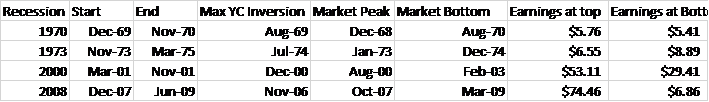
Specifically I’ve been digging into the 1970 and 1973 recessions and bear markets. I’ve concentrated on those two because, similar to today, they were periods marked by an acceleration in inflation after years of low readings. They were also periods when the Fed was very aggressive in hiking rates. The Fed Funds rate rose from 4% in 1967 to 9.25% by the onset of recession with the last 3% coming in 1969. In the early 70s the Fed hiked rates from 3.25% in early 1972 to 10% in late ’73. Both periods also saw very deep yield curve inversions, even worse than today. The 10 year/Fed funds spread fell to -5.1% in the summer of 1974. Today’s inversion which has everyone predicting the end of the world is a mere -1.5%.
So, while no two periods are just alike – actually every time is different to some degree – it does seem prudent to review these two recessions to see if there is anything to be learned.

The 2000 recession deserves our attention because it featured a lot of ridiculously priced stocks and so also resembles – to some degree – the conditions today. I don’t there is much about 2008 that compares to today but it is possible the current banking issues turn into something more. I don’t put much stock in that because balance sheets are a lot better today than they were back then. And with interest rates possibly already past their peak, some portion of the unrealized losses on bank balance sheets will cure themselves.
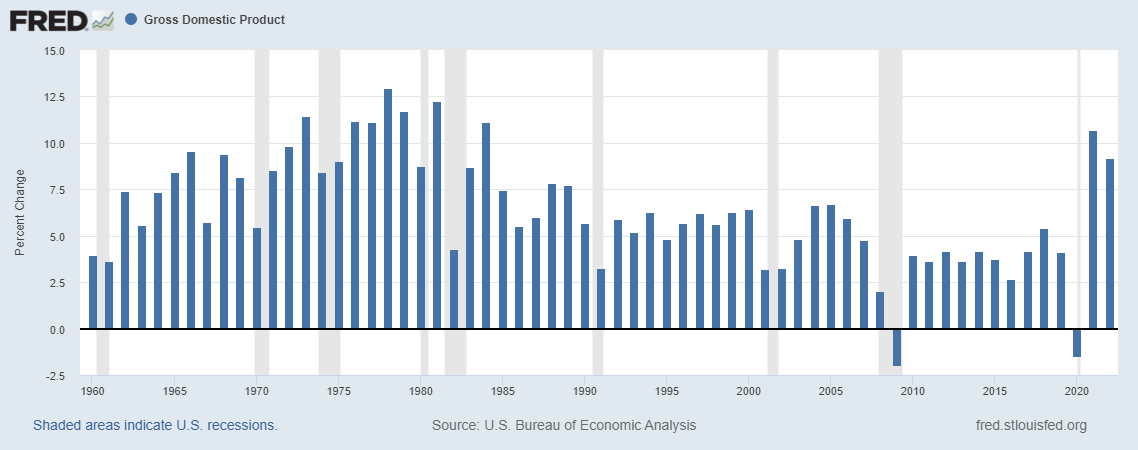
The first thing that jumps off the page here is that in the 1970 recession earnings barely fell and during the 1973 version earnings actually rose 35% (this is from Robert Shiller’s wonderful and free data). That’s the nominal versus real issue I alluded to at the top. When inflation is high so is nominal GDP growth and earnings are, of course, nominal. NGDP did fall in the two earlier recessions but the fall was much greater and started from lower levels in the latter cases. In the current case, NGDP has already had a large drop with the year over year change now at 7.3%, down from over 17% and earnings are barely down. Maybe both have more to fall but as long as NGDP growth stays high I wouldn’t bet on a big drop in earnings. Expectations for Q1 are for about a 7% drop from last year so we’ll find out soon how things are going.
Nominal GDP
Annual percent change
It is also interesting to note the timing of the yield curve inversions. In the 1969 bear market almost all of the drop in stocks happened after the max yield curve inversion. That is true of 2000 and 2008 as well. But 1973 was a little different. The max yield curve inversion came in the summer of ’74 and the market bottomed 4 months later. That 4 month drop was just 12% or so versus the total drop in that bear of nearly 50%.
I hear a lot of people today confidently predicting a stock market outcome based on the fact that the maximum yield curve inversion seems to have just happened. The assumption seems to be that as the yield curve re-steepens and the economy enters recession, stocks will fall hard. I tend to think we’ve seen the worst of the yield curve inversions but I don’t think it tells you a whole lot about the future course of the stock market.
A recession and a renewed bear market does seem like the high probability outcome and why we continue to sit on so much cash in our accounts. The economy may well be in recession by the end of the year; that would certainly be the logical bet. But if I’ve learned nothing else after 30 years of this, it is that the market rarely does what everyone thinks it will. It may be that the key variable is one we can’t know until after the fact – how long does the recession last? Because stocks anticipate and if the recession is short, stocks will start to discount it before we get to the end of it. You’ll notice in the chart above that stocks bottomed before the end of recession in 3 of the 4 examples.
By the way, if you think this bear market has been tough, take a look at that 2000-2003 ursa major. We’re a mere 15 months into this and the S&P 500 is down just a bit over 12%. In the turn of the century bear, 15 months in we were down 24% and still had another 15 months to go and the final low was down over 42%. And God help you if you owned any tech stocks. It was death by a thousand cuts. Now that’s a bear market.
Environment
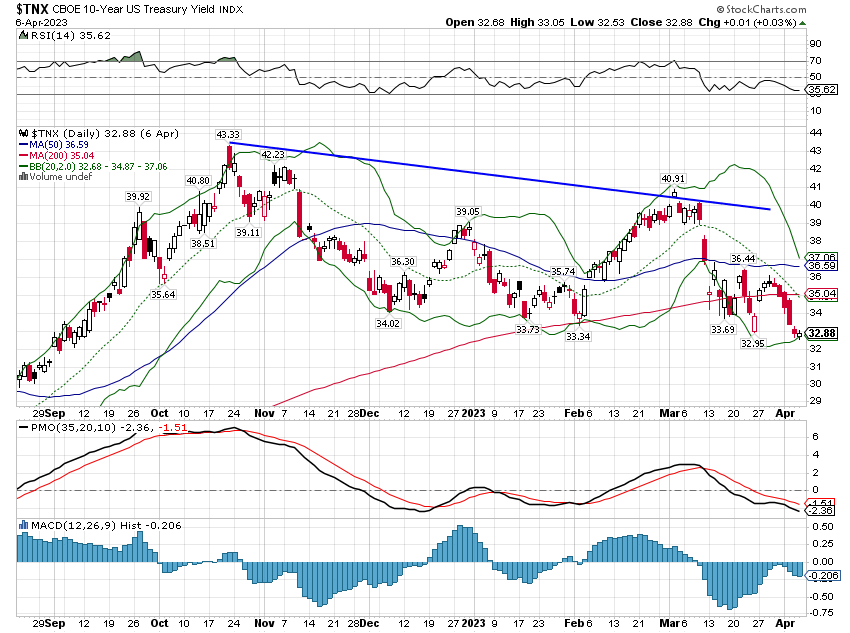
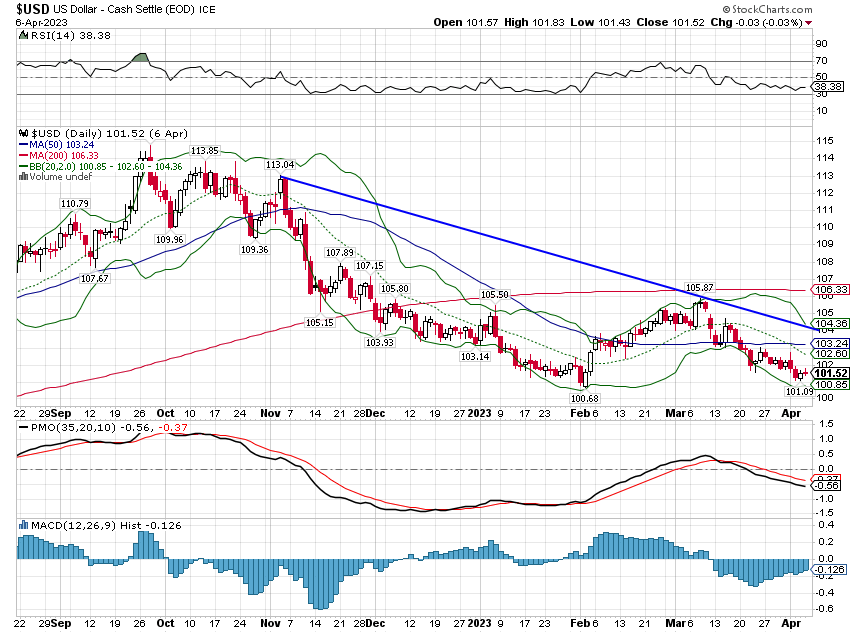
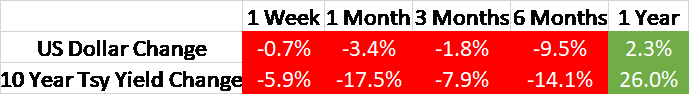
Interest rates and the dollar are still in short term downtrends. The drop in rates accelerated last week and I think they still have more to fall. But I’d be wary of going all in on a duration bet right here. Bonds are pretty well loved and overbought so don’t be surprised by a bounce in rates. The payroll report Friday shows the economy isn’t that bad yet. As for the dollar, I said last week a bounce seems likely and I haven’t changed my mind. With the major news channels talking about the demise of the dollar I’d be careful. This is not the arena of serious economic thinking.
Markets
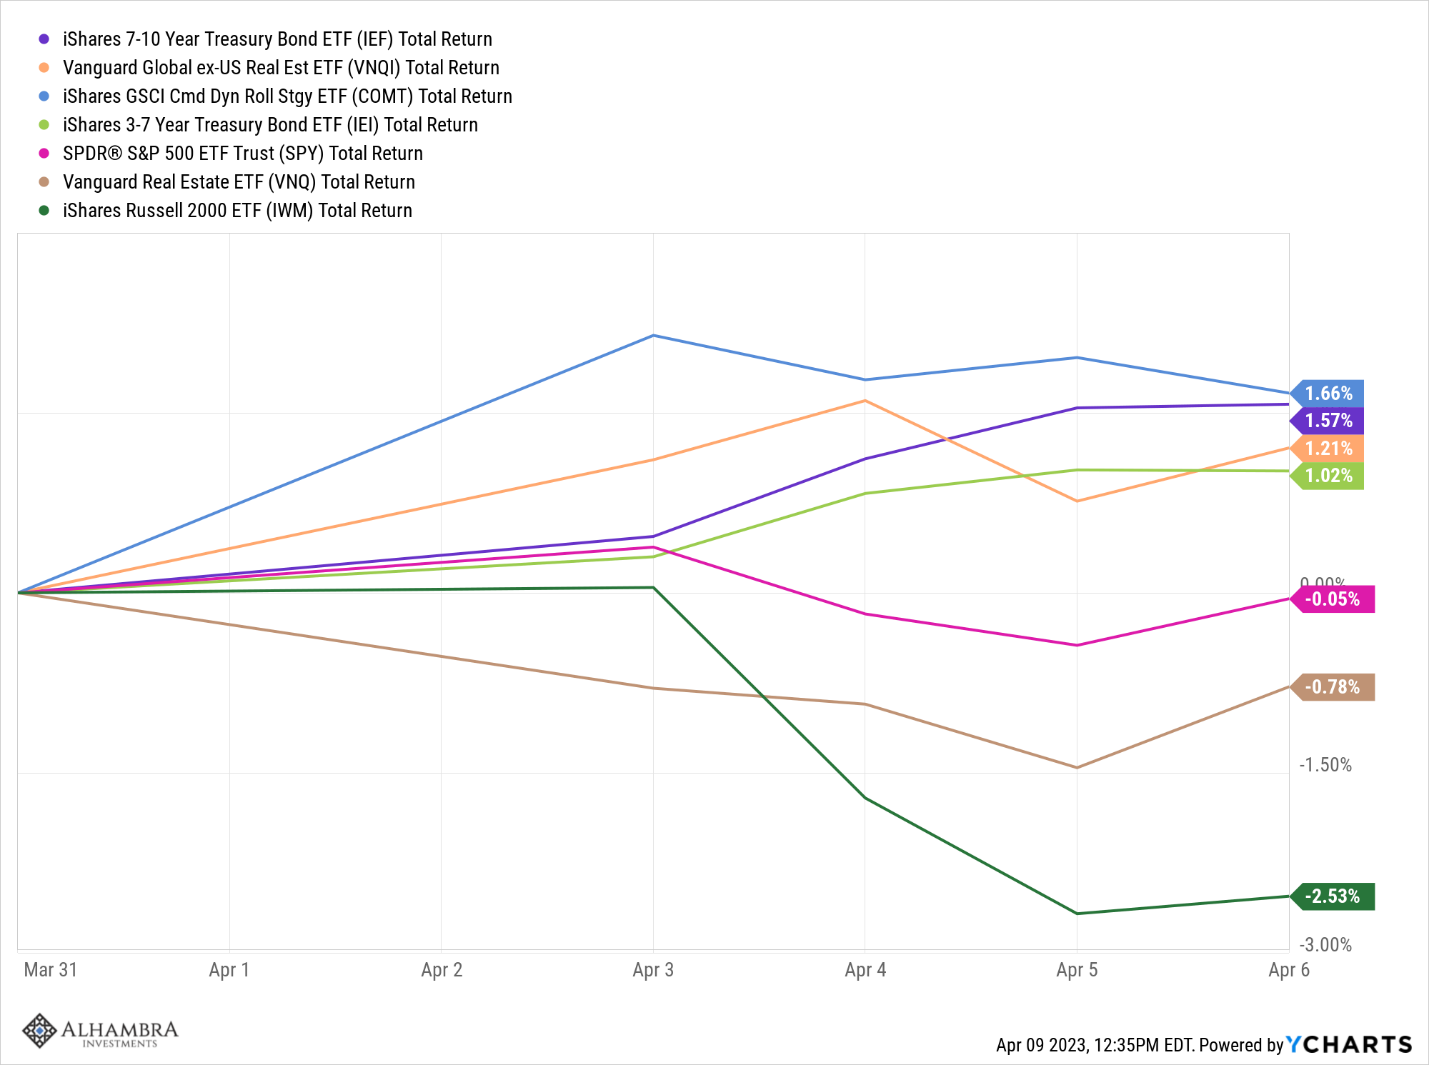
Bonds rallied last week as interest rates fell with the 3-7 year Treasury index up a little over 1%. The longer duration 7-10 year index rose 1.6%.
Commodities also had a good week as crude oil continued to rally (+6.7%) off the OPEC+ output cut. Natural gas, however, continues to sink, down another 9.25% for the week. Falling real rates spurred gains in the metals with gold, platinum and palladium all higher on the week. Copper, however, fell on the weaker economic data.
Real estate stocks were essentially flat on the week with international REITs higher and domestic slightly lower.
Small cap stocks had another rough week, down 2.5% in just 4 days of trading. The Russell 2000 is still in bear market territory, down over 26.6% since its high in November of 2021. It is down 12% since the beginning of February. Low valuations, relative to large cap and outright, have been no impediment to lower prices. Small caps trade for about 12 times earnings and 0.8 times sales while the large caps clock in at 18 times earnings and 2 times sales. And small cap also has higher long term earnings growth expectations.
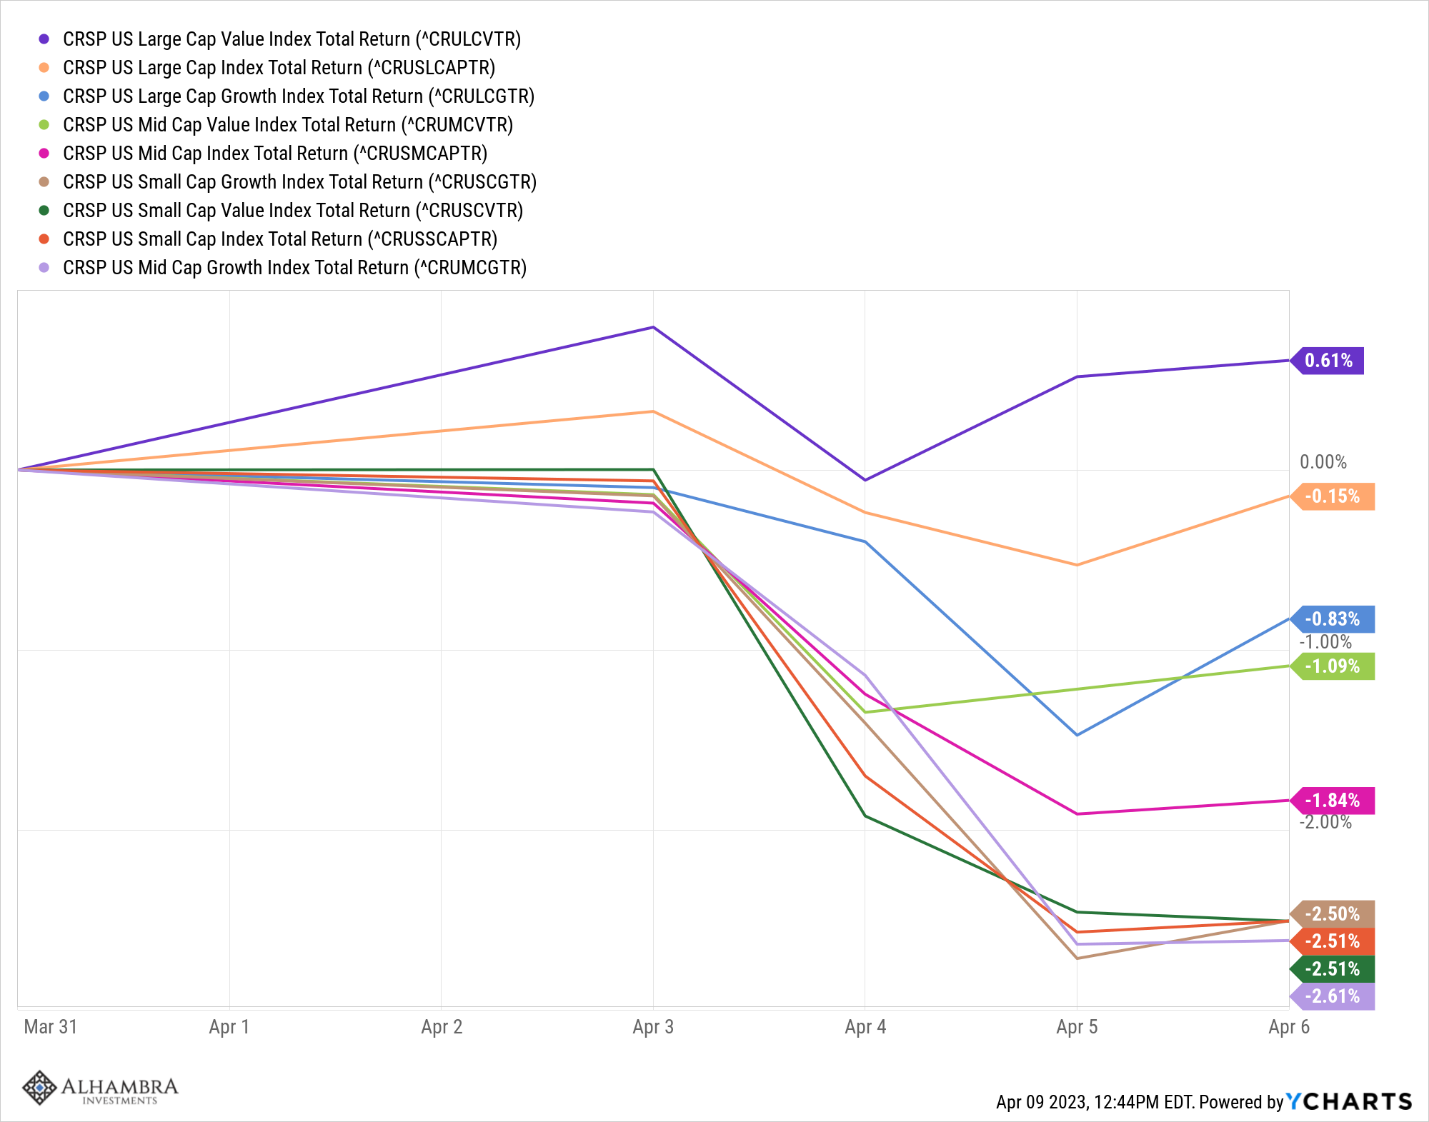
Large caps led last week with value outperforming growth. Large Value has outperformed through the bear market though, down just 1.5% since January 3, 2022 vs -23.1% for the growth index. That’s a lot of ground to make up and I have my doubts as to whether that will happen anytime soon. LC growth has been outperforming since mid-2007 but the downtrend appears to have been broken. Growth/value trends tend to persist – value outperformed from 2000-2007 – and I think the shift to value is far from complete.
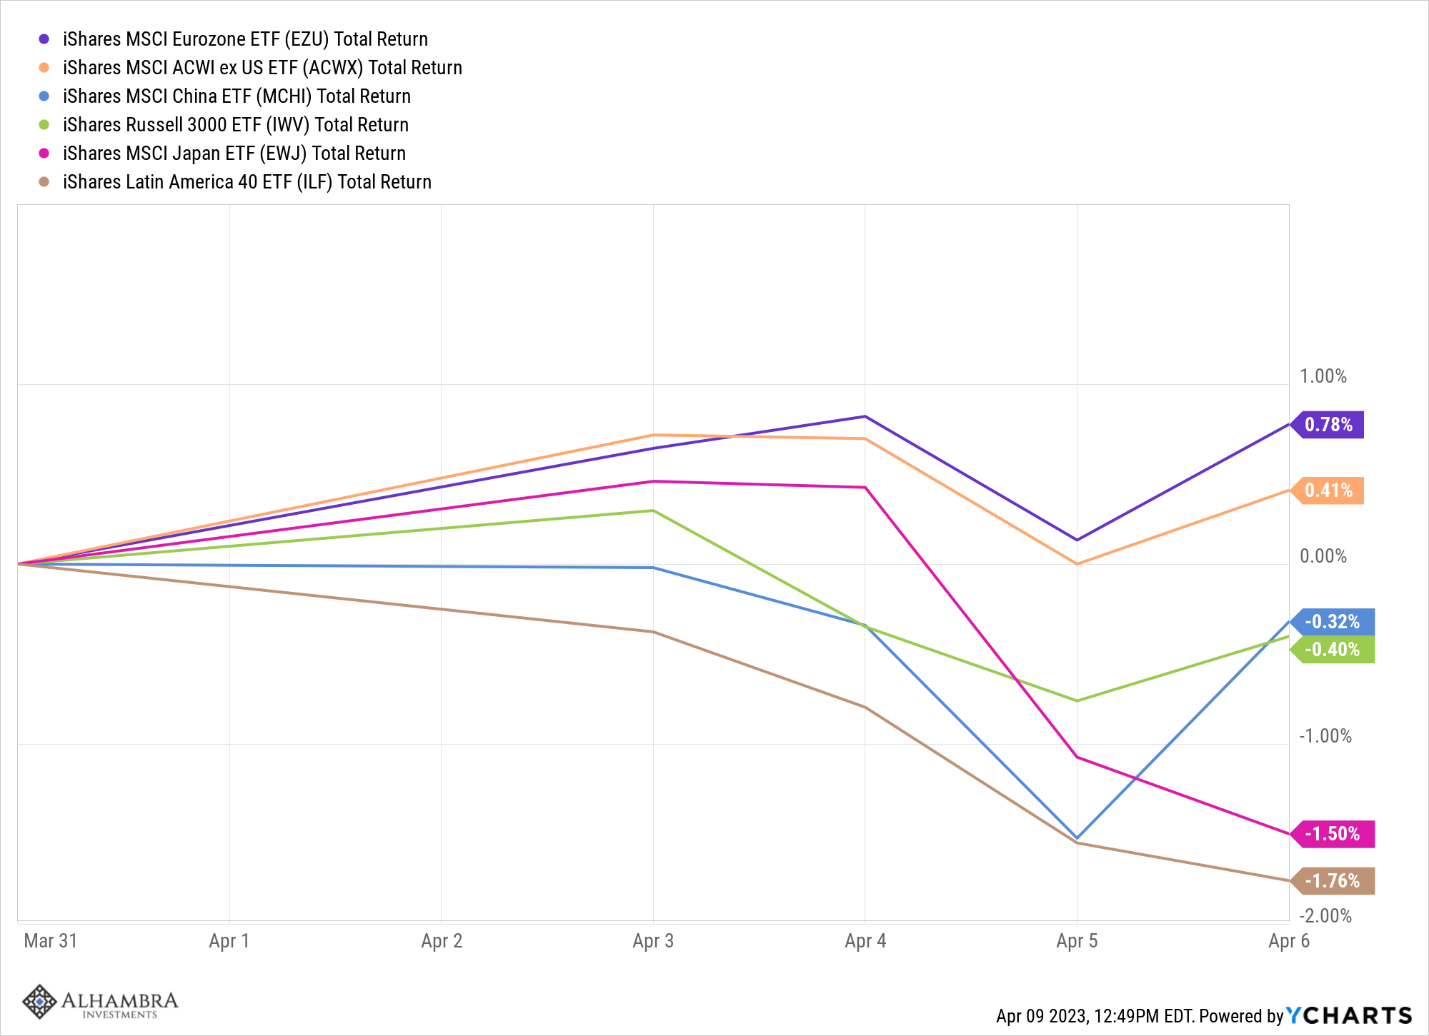
Non US stocks continue to lead with Europe putting in another good week. Latin America, despite a rally in commodities, continued its poor performance this year.
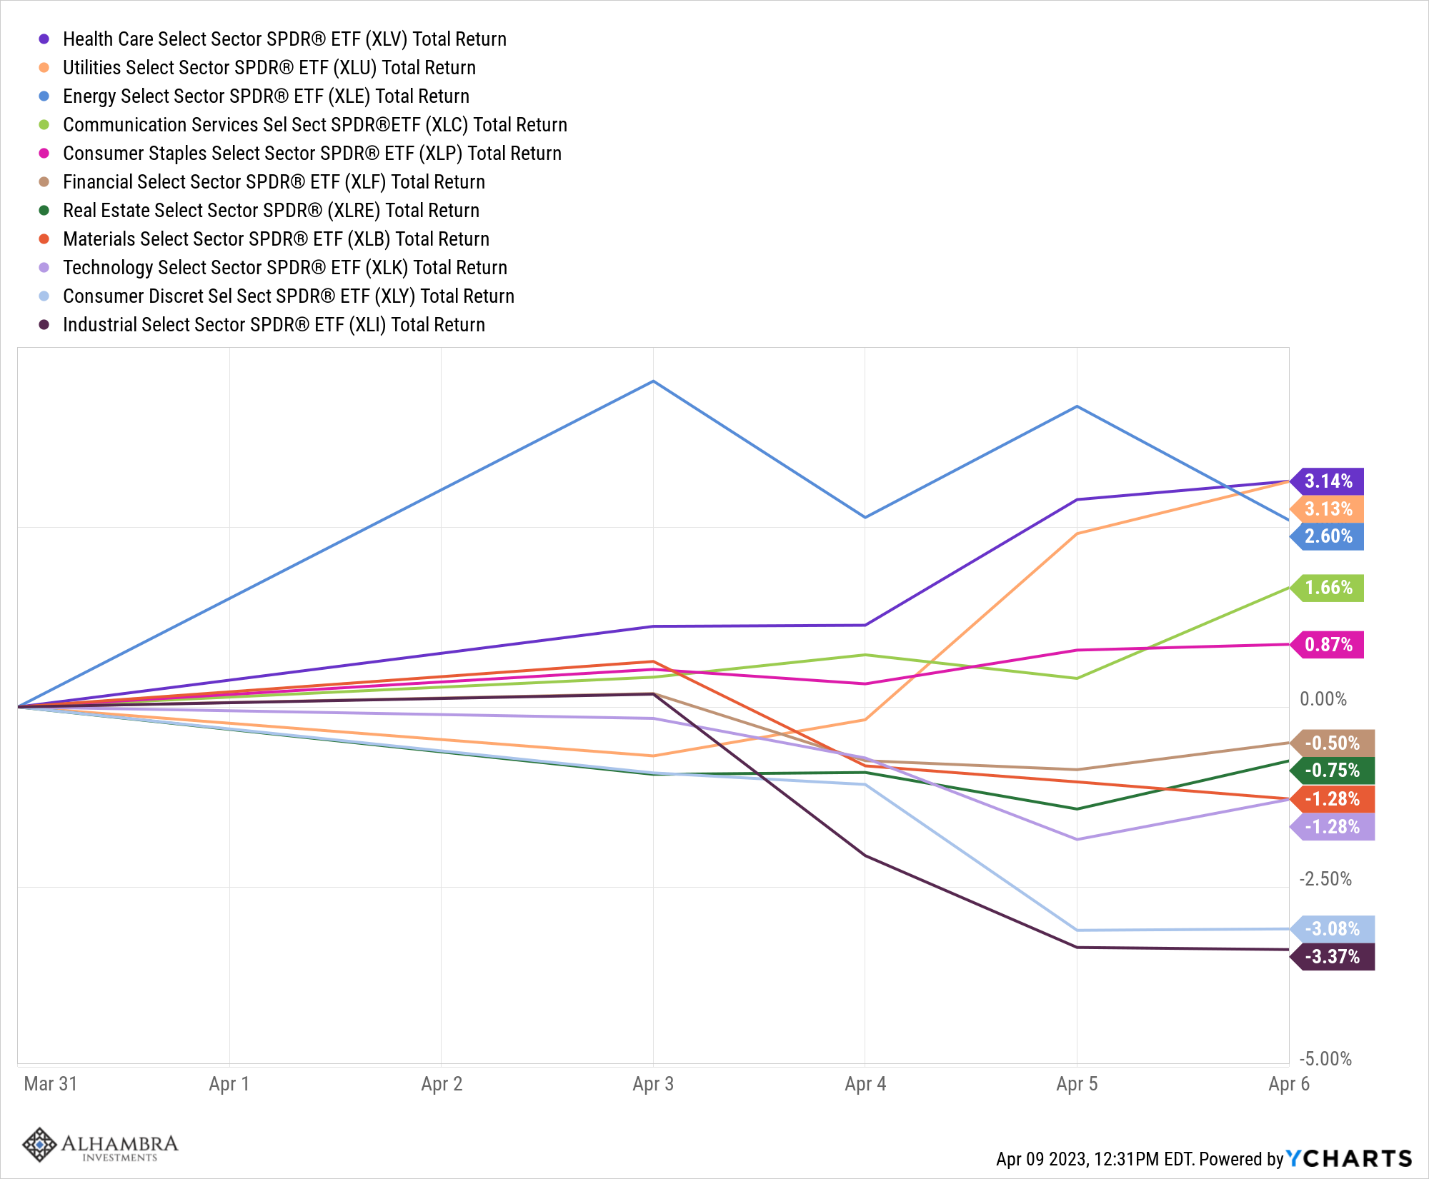
Utilities (XLU, Alhambra owns) and healthcare (XLV, Alhambra owns), both defensive sectors, led the way last week, up 3.8% and 2% respectively. Industrials and consumer discretionary stocks were the big losers presumable due to the weak ISM manufacturing read.
The economic data last week was not particularly encouraging which was the spur for the drop in interest rates and the rally in bonds. The ISM reports were both less than expected with the manufacturing version moving further into contraction territory. The services version is over 50 but just barely at 51.2.
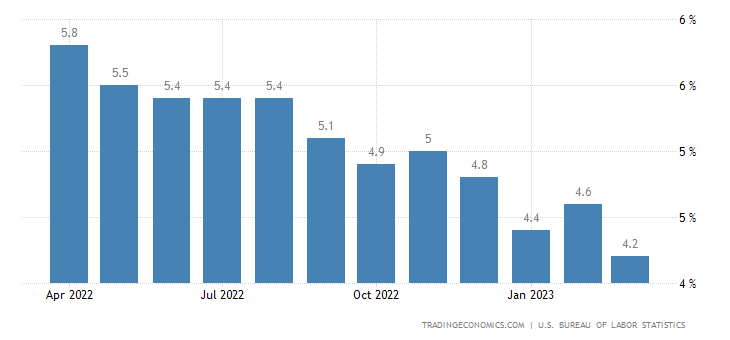
The employment report was pretty much as expected with the unemployment rate coming in at 3.5%. The change in average hourly earnings continues to moderate which may take some of the pressure off the Fed to continue hiking rates.
Average Hourly Earnings yoy % change

Studying the past doesn’t somehow allow us to predict the future. But it does tell us that there are a range of potential outcomes and we should be reluctant to make big changes to our portfolios based on any prediction. We have to remain open to the possibilities while doing our best to calculate the probabilities. Economic data in the form it is presented today doesn’t have a lot of history. The original formulation for GDP (GNP) was first presented in 1937. The Consumer Price Index only goes back to 1921 and has undergone numerous changes over the years. For almost every metric we have today, there isn’t sufficient data to draw any firm conclusions.
For the current economic condition, where the yield curve has just hit its maximum inversion for this cycle – probably – there isn’t even uniformity in the limited data we do have. Sometimes it hits this point before recession, sometimes in the middle of the recession. We also have the small matter that all economic data is revised through time; we could be in recession right now and not know it. And the historical data we use as a comparison for our analysis today has been revised significantly so we have no idea how it looked at the time it was released.
Further, even if you get the economic part right, even if you had a crystal ball that looked a month or two ahead and you knew how the economic data would evolve. there is no guarantee that it would help you predict how markets – people – would react. And that is the important thing for investors, how the humans who populate these markets will react to whatever data or information comes down the pike. That’s why the most important “data” we collect is about market sentiment. Fear and greed have always ruled markets and they still do. The important turning points occur at extremes of one of those two. Now all you have to do is define “extreme”. Good luck.
Joe Calhoun
dollar
gold
inflation
commodities
markets
metals
interest rates
fed
inflationary


Argentina Is One of the Most Regulated Countries in the World
In the coming days and weeks, we can expect further, far‐reaching reform proposals that will go through the Argentine congress.

Crypto, Crude, & Crap Stocks Rally As Yield Curve Steepens, Rate-Cut Hopes Soar
Crypto, Crude, & Crap Stocks Rally As Yield Curve Steepens, Rate-Cut Hopes Soar
A weird week of macro data – strong jobless claims but…

Fed Pivot: A Blend of Confidence and Folly
Fed Pivot: Charting a New Course in Economic Strategy Dec 22, 2023 Introduction In the dynamic world of economics, the Federal Reserve, the central bank…


