Disclaimer: opinions are personal to the author and do not reflect the opinions of Exness or LeapRate.
Economics
Weekly data: Action on the US Dollar and Oil ahead of US NFP release
From the technical analysis perspective the price is currently trading around the $1.04800 price area above the 23.6% of the fibonacci retracement level….


From the technical analysis perspective the price is currently trading around the $1.04800 price area above the 23.6% of the fibonacci retracement level. The US NFP release is expected to affect the fiber chart with the market expecting a decreased , yet positive, figure. This publication will most probably create volatility and might possibly give the bears some boost to push the price to the downside since the consensus is in favor of the US Dollar. If this is the case the first point of support might be the $1.02600 price area which consists of the 23.6% of the Fibonacci and also the inside support since mid August 2022. A second point of support might be the $1.01200 price area which falls around the 38.2% of the Fibonacci and also an inside support since mid September.
A continuation to the upside would probably face some resistance around the $1.0600 area which consists of an inside support since early July 2022 but with the Stochastic indicator in the overbought levels this scenario seems to be the least possible.
UKOIL, daily chart
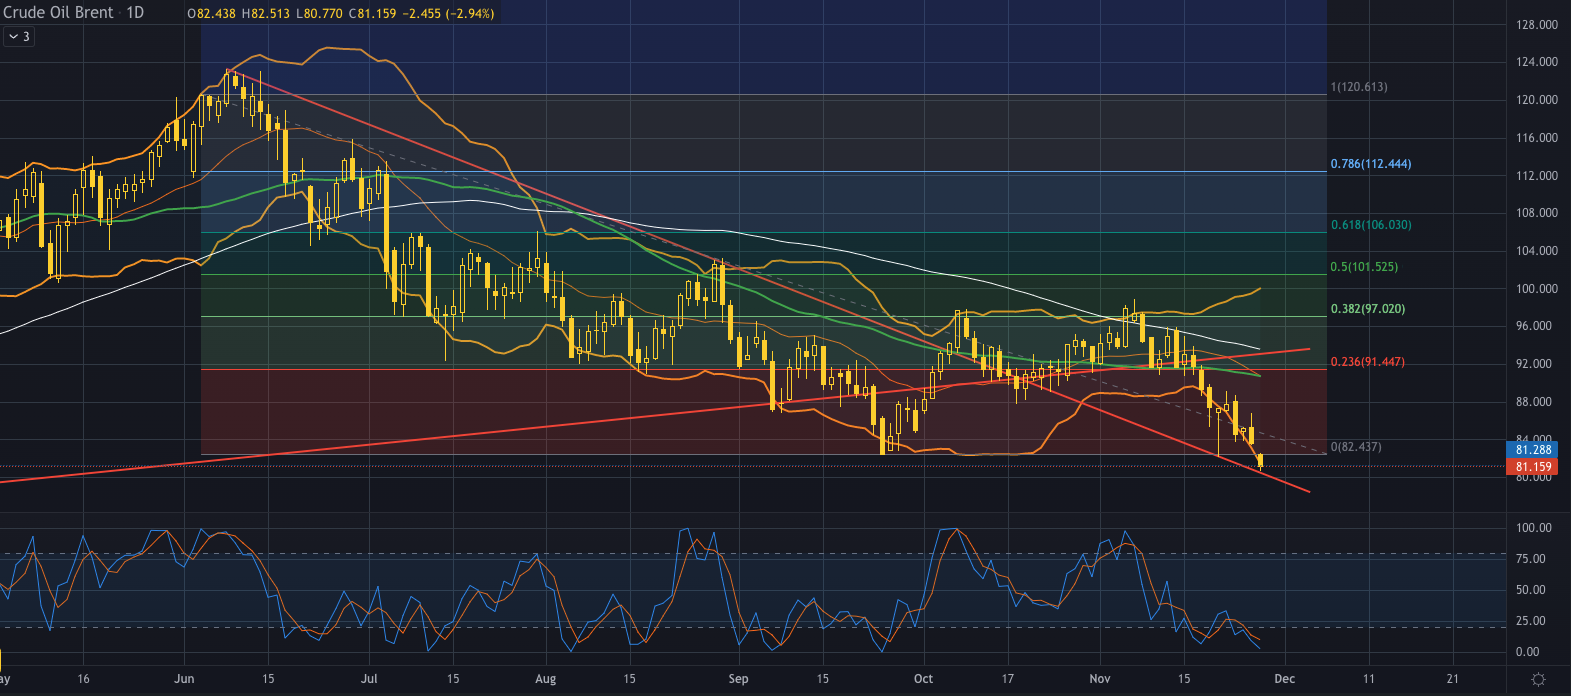
The next couple of weeks are extremely important for the price of oil since on December 1st we will have the US lay the sales tranche on the SPR (Strategic Petroleum Reserves), on December 4th there will be the OPEC meeting and on December 5th EU sanctions on oil will kick in. We are entering this pre-announcements period of this week so we might see some consolidation in the price because of the anticipation of these events by the market.
On the technical point of view the price has been trading exactly on the lower band of the Bollinger bands indicating great volatility in the market. After the break below the bearish weekly trendline and the 50 day moving average the price found resistance on the daily trendline without being able to break below it at least for the time that this report is written.
If the price finds adequate support on the Bollinger bands and the daily trendline it might correct to the upside with the first point of resistance being around the $ 91.5 price area which is just above the 23.6% of the Fibonacci retracement level and also around the 50 day moving average. This movement is further supported by the oversold level on the Stochastic indicator.
In the event that the price continues to move down we might expect some support around the $76 price area which consists of an inside support area since mid December 2021 but this might be an extreme example of support since the price is already very low compared to the years average price of around $1oo.
The post Weekly data: Action on the US Dollar and Oil ahead of US NFP release appeared first on LeapRate.


Argentina Is One of the Most Regulated Countries in the World
In the coming days and weeks, we can expect further, far‐reaching reform proposals that will go through the Argentine congress.

Crypto, Crude, & Crap Stocks Rally As Yield Curve Steepens, Rate-Cut Hopes Soar
Crypto, Crude, & Crap Stocks Rally As Yield Curve Steepens, Rate-Cut Hopes Soar
A weird week of macro data – strong jobless claims but…

Fed Pivot: A Blend of Confidence and Folly
Fed Pivot: Charting a New Course in Economic Strategy Dec 22, 2023 Introduction In the dynamic world of economics, the Federal Reserve, the central bank…


