Disclaimer: opinions are personal to the author and do not reflect the opinions of Exness or LeapRate.
Economics
Weekly data: Action on the US Dollar and Oil ahead of US inflation rate report
From the technical analysis perspective the price is currently trading around the 0.99900 price area just above the 61.8% of the fibonacci retracement…


From the technical analysis perspective the price is currently trading around the 0.99900 price area just above the 61.8% of the fibonacci retracement level. The US inflation rate is expected to affect the fiber chart with the market expecting a decrease on the figure (8%). This publication will possibly create volatility and might give the bears some more power to push the price to the downside. If this is the case the first point of support might be the $0.98700 price area which consists of the 50% of the Fibonacci and also the 50 day moving average. A second point of support might be the $0.97900 price area which falls around the 38.2% of the Fibonacci and also the major trendline. A continuation to the upside would probably face some resistance around the $1.00600 area which consists of the 78.6% of the fibonacci.
UKOIL, daily chart
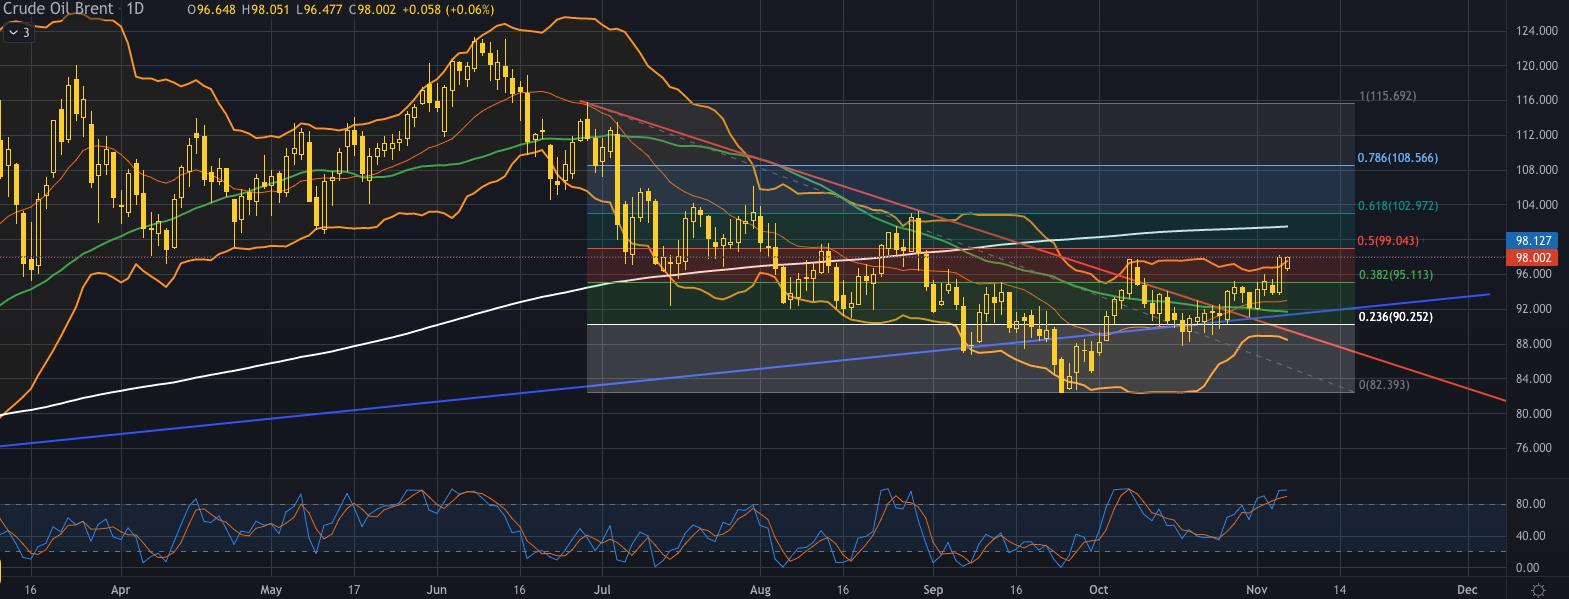
The price of Brent oil bounced to the upside after a week of lower supply which was announced on 5th of October at the OPEC meeting. The cut of the 2 million barrels per day came into effect on November 2nd with the price of “black gold” reacted accordingly.
After the break above the bearish trendline and the 50 day moving average the price found resistance on the upper band of the Bollinger bands just below the 50% of the Fibonacci retracement level. Currently the price is trading around the $98 price area exactly on the upper band of Bollinger bands. This indicates great volatility on the market with the bands showing an indication of expansion signaling the volume still goes strong. The Stochastic indicator is in the overbought levels possibly indicating that a correction to the downside is a possible scenario in the short term.
If the price finds adequate resistance on the Bollinger bands and corrects to the downside we might expect some support around the $ 92 price area which is a point on the major weekly trendline valid since November 2020 and also the 50 day moving average. If the bullish momentum is to continue then we can possibly see some resistance around the $99.100 price area just above the 50% of the Fibonacci retracement level and the psychological resistance of the round number.
The post Weekly data: Action on the US Dollar and Oil ahead of US inflation rate report appeared first on LeapRate.


Argentina Is One of the Most Regulated Countries in the World
In the coming days and weeks, we can expect further, far‐reaching reform proposals that will go through the Argentine congress.

Crypto, Crude, & Crap Stocks Rally As Yield Curve Steepens, Rate-Cut Hopes Soar
Crypto, Crude, & Crap Stocks Rally As Yield Curve Steepens, Rate-Cut Hopes Soar
A weird week of macro data – strong jobless claims but…

Fed Pivot: A Blend of Confidence and Folly
Fed Pivot: Charting a New Course in Economic Strategy Dec 22, 2023 Introduction In the dynamic world of economics, the Federal Reserve, the central bank…


