Economics
USD/JPY Technical: 142.25 resistance met with bullish exhaustion
The rally of USD/JPY has reached 142.25/142.50 key medium-term resistance ex-post BoJ monetary policy decision last Friday. Latest Commitments of Traders…

![]()
![]()
![]()
- The rally of USD/JPY has reached 142.25/142.50 key medium-term resistance ex-post BoJ monetary policy decision last Friday.
- Latest Commitments of Traders report on JPY futures on net large speculators’ open bearish positioning has reached close to a 3-year extreme.
- The next key related event will be the release of Japan’s nationwide inflation data for May on this Friday, 23 June.
This is a follow-up analysis from our earlier publication dated 15 June 2023, “USD/JPY Technical: Bullish breakout from 4-week range ahead of BOJ” (click here for a recap).
The USD/JPY has shaped the expected positive follow-through in price actions reinforced by the latest Bank of Japan (BoJ)’s dovish jawboning last Friday, 16 June to maintain its ultra-dovish monetary policy due to an expectation that inflation in Japan faces a risk of a slowdown in the second half of the current fiscal year.
The last 3 days of up move in the USD/JPY has led it to hit a 142.25/50 key resistance with bullish exhaustion elements at this juncture ahead of the next key related economic data release, the Japan nationwide inflation for May out on this Friday, 23 June.
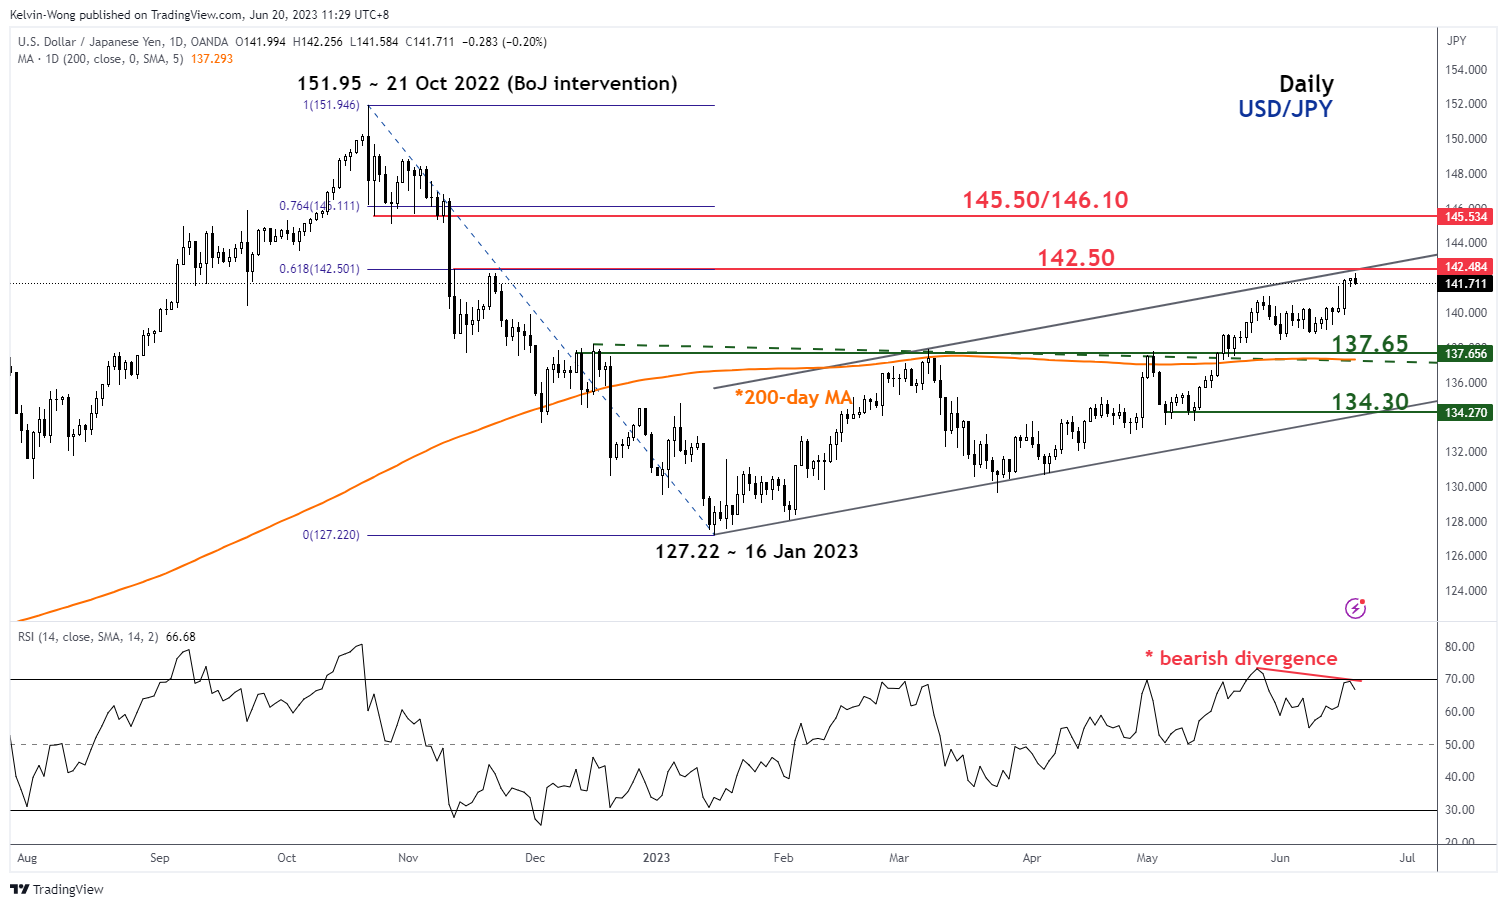
Fig 1: USD/JPY medium-term trend as of 20 Jun 2023 (Source: TradingView, click to enlarge chart)
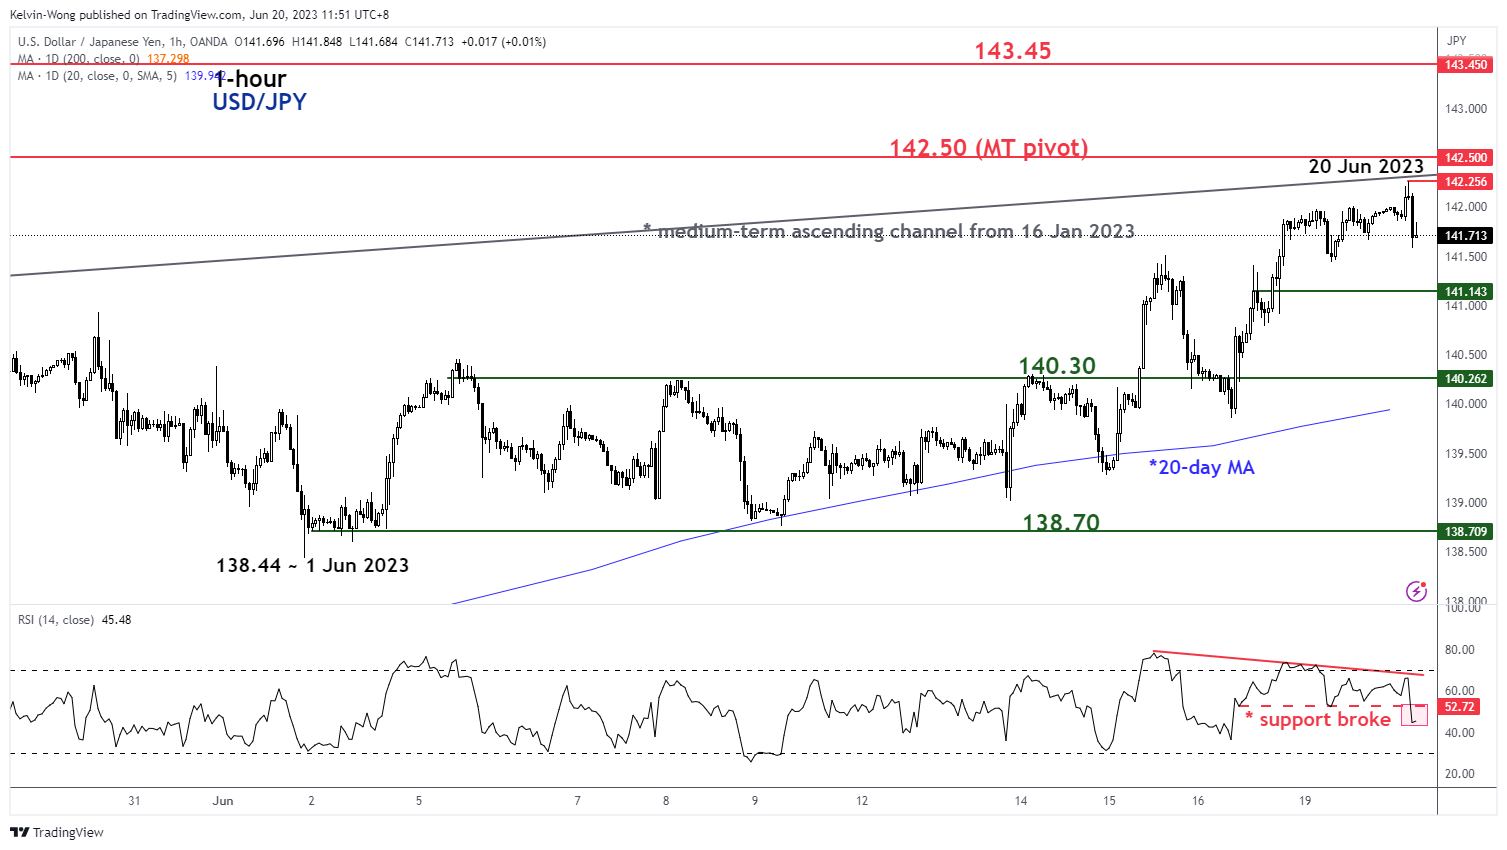
Fig 2: USD/JPY short-term minor trend as of 20 Jun 2023 (Source: TradingView, click to enlarge chart)
JPY futures’ bearish net open positioning of large speculators has reached close to a 3-year extreme
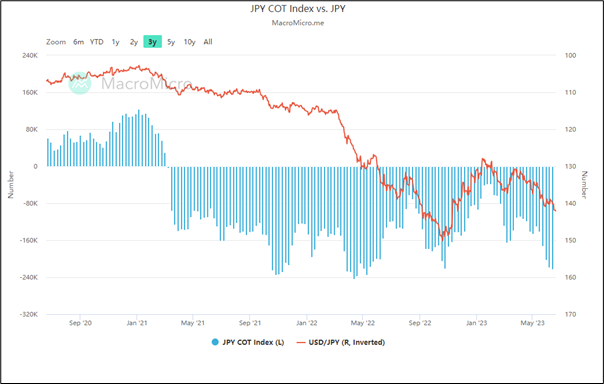
Fig 3: JPY futures net open positioning trend of large speculators as of 12 Jun 2023 (Source: MacroMicro, click to enlarge chart)
Traders’ sentiment from the Commitments of Traders report can be measured by the difference between the net open positions of large non-commercials (speculators) and the large commercials (hedgers/dealers) in the futures market. A positive number represents net long positions on JPY and a negative number represents net short on JPY.
Based on the latest weekly Commitments of Traders report as of 12 June 2023 compiled by the Commodity Futures Trading Commission (CFTC) on US exchange-listed FX futures market on the JPY futures contract (take note that JPY is quoted as the base currency & USD as the variable currency, i.e. JPY/USD), it has indeed shown that traders’ sentiment is skewed towards a more significant increase bearish positioning on JPY versus three months ago.
The latest weekly reported net open positions on the JPY futures market have indicated a jump of net shorts positions on JPY to -222,157 contracts which is close to a 3-year extreme with -243,729 contracts reported on 11 April 2022.
Interestingly, the current reported -222, 157 contracts on net short JPY futures open positions have surpassed the -220,700 contracts reported on 24 October 2022 and thereafter saw the JPY strengthen by +15% against the USD in the following three months.
That’s a form of contrarian opinion analysis where positioning has reached a relatively extreme level and the risk of a reversal in price actions is likely to be easily triggered if related news or events fail to meet the expectations of an “overconfident and exuberance” mindset of participants due to the overcrowding effect.
142.25/142.50 key medium-term resistance of USD/JPY is defined by a confluence of elements
There are three different elements that allow 142.25/142.50 on the USD/JPY to be classified as potential key resistance (see daily chart). Firstly, it is the prior swing highs area of 11 and 22 November 2022 that led to a significant decline in price actions thereafter.
Secondly, it is the upper boundary of a medium-term ascending channel that price actions have oscillated within it since the 16 January 2023 low of 127.72.
Thirdly, it’s the 61.8% Fibonacci retracement of the prior medium-term decline from the 21 October 2022 high to the 16 January 2023 low. Thus, such confluence of elements on the 142.25/142.50 resistance level may suggest that the USD/JPY medium-term uptrend from 16 January 2023 is at risk of hitting a terminal juncture where a potential corrective decline may occur next.
Upside momentum has started to wane
The daily RSI oscillator has flashed a bearish divergence signal at its overbought region and the shorter-term 1-hour RSI has broken below a corresponding support at the 52% level.
Below the 141.15 minor support exposes the next intermediate support at 140.30 (also the 20-day moving average) in the first step.
However, a clearance above 142.50 key medium-term pivotal resistance invalidates the bearish tone for the next resistance to come in at 143.45.


Argentina Is One of the Most Regulated Countries in the World
In the coming days and weeks, we can expect further, far‐reaching reform proposals that will go through the Argentine congress.

Crypto, Crude, & Crap Stocks Rally As Yield Curve Steepens, Rate-Cut Hopes Soar
Crypto, Crude, & Crap Stocks Rally As Yield Curve Steepens, Rate-Cut Hopes Soar
A weird week of macro data – strong jobless claims but…

Fed Pivot: A Blend of Confidence and Folly
Fed Pivot: Charting a New Course in Economic Strategy Dec 22, 2023 Introduction In the dynamic world of economics, the Federal Reserve, the central bank…
