Economics
US Oil Fund ETF (USO): Technical and Fundamental Analysis
USO, US Oil Fund the ETF, invests primarily in futures contracts for light, sweet crude oil, other types of crude oil, diesel-heating oil, gasoline, natural…

USO, US Oil Fund the ETF, invests primarily in futures contracts for light, sweet crude oil, other types of crude oil, diesel-heating oil, gasoline, natural gas, and other petroleum-based fuels.
Essentially, the top 6 holdings are crude oil futures from May to August-which like futures, will continue to roll out and into the next month as contract months expire.
The month of May has seen a tremendous about of ouflow of funds in US oil.
YTD total return for investors is -11.47%.
Energy, gas and oil are the underperformers this year and a main reason many call for deflation, recession or at the very least, end of accelerating inflation.
What we do know though as commodities traders, there are emerging trends, existing trends and trends that are on vacation (which could last months or years).
Which trend is US Oil in?
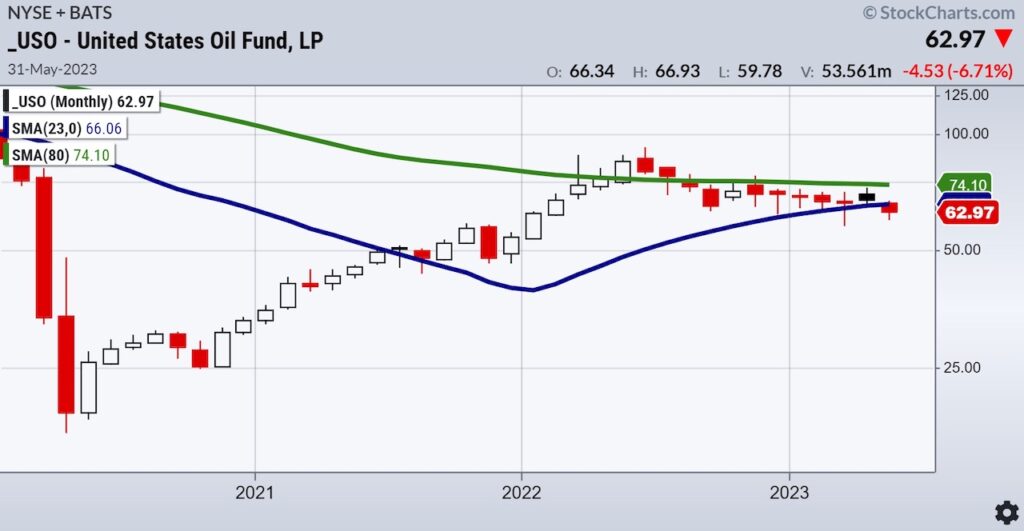
On a monthly chart, USO is not stacked as I have shown you with other sectors. In other words, the 23-month moving average sits under the 80-month MA.
That tells us that even in 2022 when the price was over both MAs, the phase never really turned bullish.
Now, in 2023, USO is under the 23-month MA, signaling more of a recession as many economists talk about.
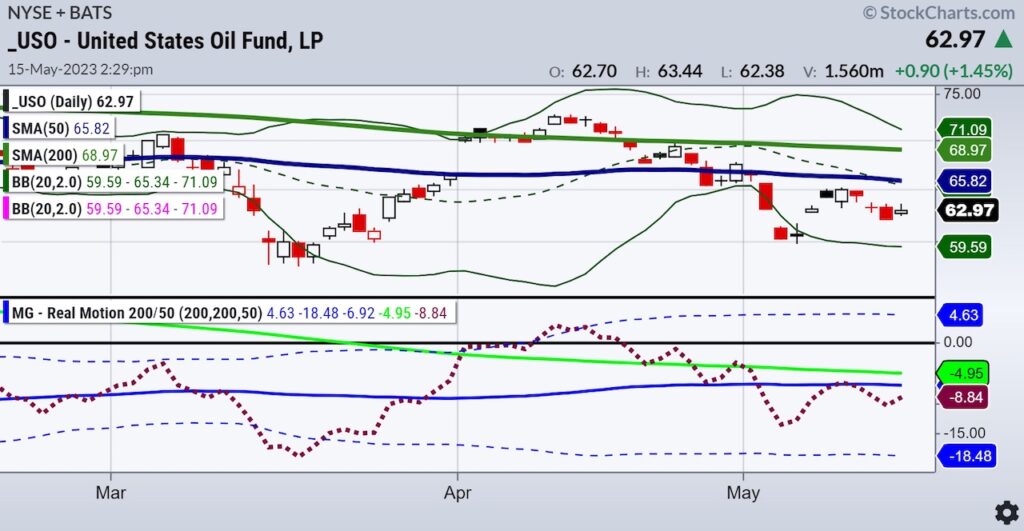
However, on the Daily charts, March brought USO to a 2-year low.
In May, we see an exhaustion gap, provided the low of 59.70 made on May 4th remains intact.
Monday, USO had an inside day, trading inside Friday’s range. The Real Motion momentum indicator shows a bit of a bullish divergence as the red dotted lines head closer to the moving averages.
That makes the case for a possible rally should USO’s price clear the 50-DMA (blue).
Summer season is about to start. The US Strategic Oil Reserves are low with stock in crude oil at 40-year lows.
The plan by the US is to refill the SPR in the 3rd quarter of 2023.
I’ll leave it here.
Stock Market ETFs Trading Analysis and Summary:
S&P 500 (SPY) 23-month MA 420
Russell 2000 (IWM) 170 support – 180 resistance
Dow (DIA) Now below the 23-month MA
Nasdaq (QQQ) 329 the 23-month MA
Regional banks (KRE) 42 now pivotal resistance-holding last Thurs low
Semiconductors (SMH) 23-month MA at 124
Transportation (IYT) 202-240 biggest range to watch
Biotechnology (IBB) 121-135 range to watch from monthly charts
Retail (XRT) 56-75 trading range to break one way or another
Twitter: @marketminute
The author may have a position in mentioned securities at the time of publication. Any opinions expressed herein are solely those of the author and do not represent the views or opinions of any other person or entity.
The post US Oil Fund ETF (USO): Technical and Fundamental Analysis appeared first on See It Market.


Argentina Is One of the Most Regulated Countries in the World
In the coming days and weeks, we can expect further, far‐reaching reform proposals that will go through the Argentine congress.

Crypto, Crude, & Crap Stocks Rally As Yield Curve Steepens, Rate-Cut Hopes Soar
Crypto, Crude, & Crap Stocks Rally As Yield Curve Steepens, Rate-Cut Hopes Soar
A weird week of macro data – strong jobless claims but…

Fed Pivot: A Blend of Confidence and Folly
Fed Pivot: Charting a New Course in Economic Strategy Dec 22, 2023 Introduction In the dynamic world of economics, the Federal Reserve, the central bank…


