Economics
Understanding the “Inconvenience” of U.S. Treasury Bonds
The U.S. Treasury market is one of the most liquid financial markets in the world, and Treasury bonds have long been considered a safe haven for global…


The U.S. Treasury market is one of the most liquid financial markets in the world, and Treasury bonds have long been considered a safe haven for global investors. It is often believed that Treasury bonds earn a “convenience yield,” in the sense that investors are willing to accept a lower yield on them compared to other investments with the same cash flows owing to Treasury bonds’ safety and liquidity. However, since the global financial crisis (GFC), long-maturity U.S. Treasury bonds have traded at a yield consistently above the interest rate swap rate of the same maturity. The emergence of the “negative swap spread” appears to suggest that Treasury bonds are “inconvenient,” at least relative to interest rate swaps. This post dives into this Treasury “inconvenience” premium and highlights the role of dealers’ balance sheet constraints in explaining it.
Primary Dealers’ Treasury Position, Negative Swap Spread, and Cross-Currency Basis
As in our recent Staff Report, we begin with a striking chart showing a strong correlation between primary dealers’ net Treasury position and the swap spread (see chart below). Pre-GFC, when dealers overall had a net-short position in Treasury bonds, the swap spread was positive. The sign flip in the swap spread coincides with primary dealers switching from holding a net-long to a net-short position in Treasury bonds. With this shift in dealers’ positioning, dealers continued to earn a positive spread on their Treasury positions hedged using interest rate swaps. In addition, post-GFC, the larger the dealers’ net position, the more negative the swap spread, or the more “inconvenient” the Treasury bonds.
Swap Spread, CIP Deviations, and Primary Dealers’ Net Holdings of Treasury Bonds Are Highly Correlated
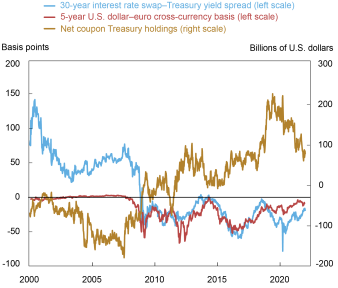
Notes: The chart plots the spread between the thirty-year LIBOR-linked interest rate swap and the U.S. Treasury yield (in blue), the five-year U.S. dollar–EUR cross-currency basis (in red), and primary dealers’ net holdings of coupon Treasury bonds (in gold). The quote on the cross-currency basis swap effectively measures the direct dollar interest rate minus the synthetic dollar interest by swapping euro interest rate into dollars (Du, Tepper, and Verdelhan 2018b).
For dealers, the main difference between holding a Treasury bond and holding an interest rate swap is that the Treasury bond stays on the dealer’s balance sheet, but the swap is off-balance-sheet. The tightening of the non-risk-weighted leverage ratio constraint post-GFC makes a large balance sheet costly for banks, even if the underlying positions have little risk.
The tight correlation between the swap spreads and the cross-currency basis (the red line) post-GFC, also shown in the chart above, further supports the claim that intermediary balance sheet capacity is a key driver of the Treasury swap spread. The cross-currency basis measures deviations from the covered interest parity (CIP) condition, a textbook no-arbitrage condition. The CIP deviations reflect the shadow cost of the intermediary balance sheet constraint (as shown in this article and this article). In particular, a larger primary dealer Treasury position corresponds to a tighter balance sheet constraint, and therefore, a more negative swap spread and cross-currency basis.
The Role of the Yield Curve Slope
What drives the primary dealers’ Treasury position post-GFC when dealers have a long position in Treasury bonds? As shown in the next chart, primary dealers’ Treasury position is highly correlated with the slope of the yield curve: dealers increase their Treasury position when the yield curve is flatter. The reason for this relationship is that as the Treasury yield curve flattens or inverts—a recurring feature of the monetary policy tightening cycle—real-money investors (such as mutual funds, and foreign insurers that hedge their dollar currency risk using short-term forwards) reduce their demand for Treasury bonds due to lower expected returns on the bonds. As a result, dealers (or levered investors that rely on dealers’ balance sheets) have to further increase their Treasury holdings, which tightens dealers’ balance sheet constraints, leading to a more negative swap spread (and higher profit for dealers who go long in Treasury bonds hedged with interest rate swaps).
Term Spreads and Primary Dealer Treasury Holdings
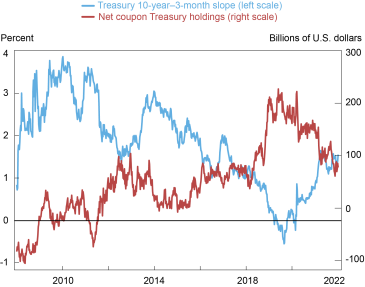
Notes: The chart plots the yield spread between the ten-year Treasury bond and the three-month Treasury bill (in blue), and primary dealers’ net holdings of Treasury bonds (in red).
Putting in a Term Structure Model
In the paper, we build a consistent framework featuring constrained dealers, levered investors funded by dealer balance sheets, and return-seeking real money investors to explain these new facts. Whether the dealers are net-long or net-short in Treasury bonds matters significantly for yields. Using CIP deviations as the proxy for dealers’ balance sheet costs, our term structure model shows that the Treasury yield curve switched from the dealer-net-short curve to the dealer-net-long curve, consistent with the change in the dealers’ position (see chart below).
Model-Implied and Actual Treasury Yields (10-Year Maturity)
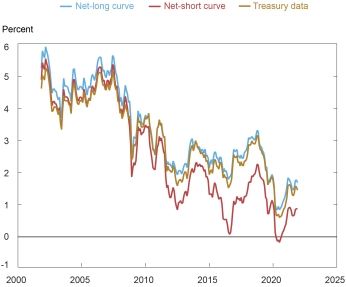
Notes: The chart shows the model-implied net-long and net-short curves for Treasury securities, together with the actual Treasury yields. Data are from 2003-21. All yields are par yields.
Implications for Policy
Finally, we use our framework to discuss the implications of several monetary and regulatory policies for the Treasury market, including quantitative easing and tightening, central bank swap lines, and the exemption of Treasury securities from the supplementary leverage ratio calculation. In particular, during a monetary policy tightening cycle, our model suggests that the yield curve inversion and the Federal Reserve balance sheet runoff will likely create significant pressure for financial intermediaries to absorb Treasury bonds. As a result, the expected build-up in the intermediary positions might lead to fragility in the Treasury market. On the other hand, we have abstracted two recent developments from our framework which could make the current tightening cycle different. First, the large amount of cash piled in the overnight reverse repo facility can help absorb the Treasury bonds and alleviate the intermediary balance sheet constraints. Second, greater interest rate volatility can discourage the build-up of dealers’ inventory and the levered investors’ position due to additional value-at-risk-type constraints, which have been abstracted from our framework. Overall, primary dealers’ Treasury inventory and various intermediation spreads should be closely monitored by policymakers and market participants.
Wenxin Du is a financial research advisor in Capital Markets Studies in the Federal Reserve Bank of New York’s Research and Statistics Group.
Benjamin Hébert is an associate professor of finance at the Stanford University Graduate School of Business.
Wenhao Li is an assistant professor of finance and business economics at the University of Southern California Marshall School of Business.
How to cite this post:
Wenxin Du, Benjamin Hébert, and Wenhao Li, “Understanding the “Inconvenience” of U.S. Treasury Bonds,” Federal Reserve Bank of New York Liberty Street Economics, February 6, 2023, https://libertystreeteconomics.newyorkfed.org/2023/02/understanding-the-inconvenience-of-u-s-treasury-bonds/.


Disclaimer
The views expressed in this post are those of the author(s) and do not necessarily reflect the position of the Federal Reserve Bank of New York or the Federal Reserve System. Any errors or omissions are the responsibility of the author(s).
dollar
gold
monetary
markets
reserve
policy
central bank
correlation
monetary policy


Argentina Is One of the Most Regulated Countries in the World
In the coming days and weeks, we can expect further, far‐reaching reform proposals that will go through the Argentine congress.

Crypto, Crude, & Crap Stocks Rally As Yield Curve Steepens, Rate-Cut Hopes Soar
Crypto, Crude, & Crap Stocks Rally As Yield Curve Steepens, Rate-Cut Hopes Soar
A weird week of macro data – strong jobless claims but…

Fed Pivot: A Blend of Confidence and Folly
Fed Pivot: Charting a New Course in Economic Strategy Dec 22, 2023 Introduction In the dynamic world of economics, the Federal Reserve, the central bank…


