Economics
Two Big Market Headwinds
A soaring 10-year Treasury yield weighs on stocks … the spiking U.S. Dollar Index is similarly painful … meanwhile, Bitcoin is holding gains … how…

A soaring 10-year Treasury yield weighs on stocks … the spiking U.S. Dollar Index is similarly painful … meanwhile, Bitcoin is holding gains … how high history says it’s going
January’s bull market faces two major headwinds…
A soaring 10-year Treasury yield, and a newly-resurgent U.S. dollar.
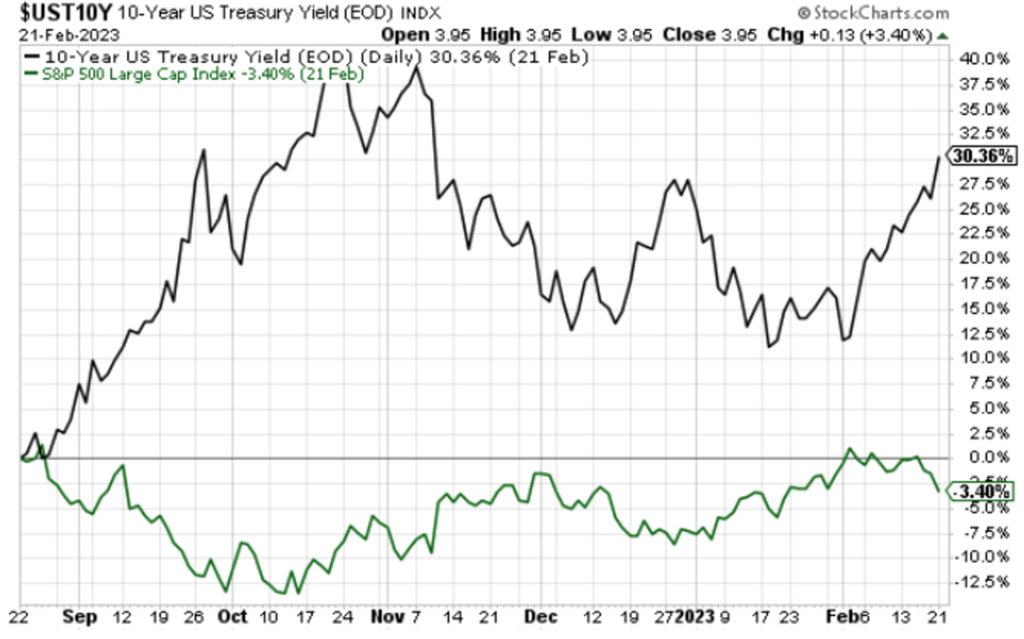
Since falling below 3.40% at the beginning of the month, the 10-year Treasury yield has exploded higher.
Earlier this morning, it nearly topped 3.96% before pulling back to roughly 3.92% as I write.
This 50+ basis-point jump is a big move for only a handful of weeks, and as noted a moment ago, it’s a headwind for stocks.
Why?
When analysts estimate a stock’s value, they use what’s called a “discount rate,” which is heavily-influenced by the 10-year Treasury yield.
Analysts add up what they believe will be a company’s future cash flows, then use this discount rate to calculate a “net present value” of all those future cash flows.
This net present value is what analysts think is a fair stock price.
Given the math involved in this calculation, the higher the discount rate, the lower the net present value of future flows, and vice versa.
So, a higher 10-year Treasury yield – and by extension – a higher discount rate – puts downward pressure on stock prices.
To get a sense for this, the chart compares the 10-year Treasury yield (in black) and the S&P 500’s price (in green) over the last six months. The inverse correlation between the two is clear and striking.
 Source: StockCharts.com
Why are rates climbing so fast?
A big reason is because traders are finally pricing in a higher “terminal rate” from the Fed. The terminal rate is the eventual “highest rate” that the Federal Reserve will set as its target rate.
For months, Fed members have been telling us that this terminal rate will be over 5%, and the Fed will not cut interest rates in 2023. For example, yesterday, Federal Reserve Bank of St. Louis President James Bullard said he wants rates to climb to 5.375%.
Wall Street and the bond market have been hearing all this, but haven’t believed it.
Well, here in February, that’s finally been changing.
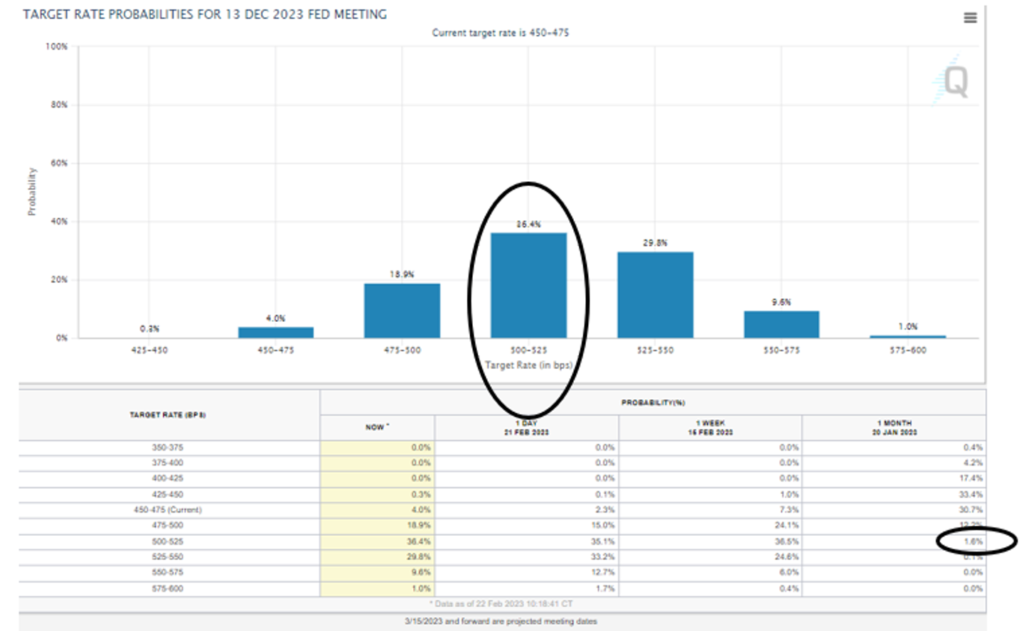
The FedWatch Tool from the CME Group provides a fantastic way to see this “about face” from the market. This tool shows us the probabilities that traders are putting on various interest rate ranges at upcoming FOMC meetings.
As you can see below, as I write, traders are putting 36.4% odds on the Fed Funds target rate being 5.00% – 5.25% at the December 2023 meeting. This is roughly in-line with what Fed members have been telling us (though it’s below what Bullard wants).
But just one month ago, where did the same traders put the odds of this 5.00% – 5.25% target rate in December?
Just 1.6%
The font is small in the image below – we’ve circled the respective odds we just detailed.
 Source: CME Group
Now, since so few traders believed the Fed would have rates above 5% come December, where did a plurality of them believe rates would be?
Just 4.25% – 4.50%.
Keep in mind, that’s not only lower than the Fed’s forecasted 5%+ terminal rate, but was lower than our current target rate of 4.50 – 4.75%.
Translation – traders were betting on rate cuts later this year, despite the Fed saying the opposite.
But February’s market losses appear to be Wall Street finally beginning to re-price assets to match the Fed’s words rather than its own hopes.
The stock market also has to overcome a surging U.S. dollar
A strong dollar is a headwind for many stocks because it results in major currency headwinds for companies with international sales.
And with about 40% of the S&P’s revenues coming from outside of the U.S., a strong dollar is bad for corporate bottom lines.
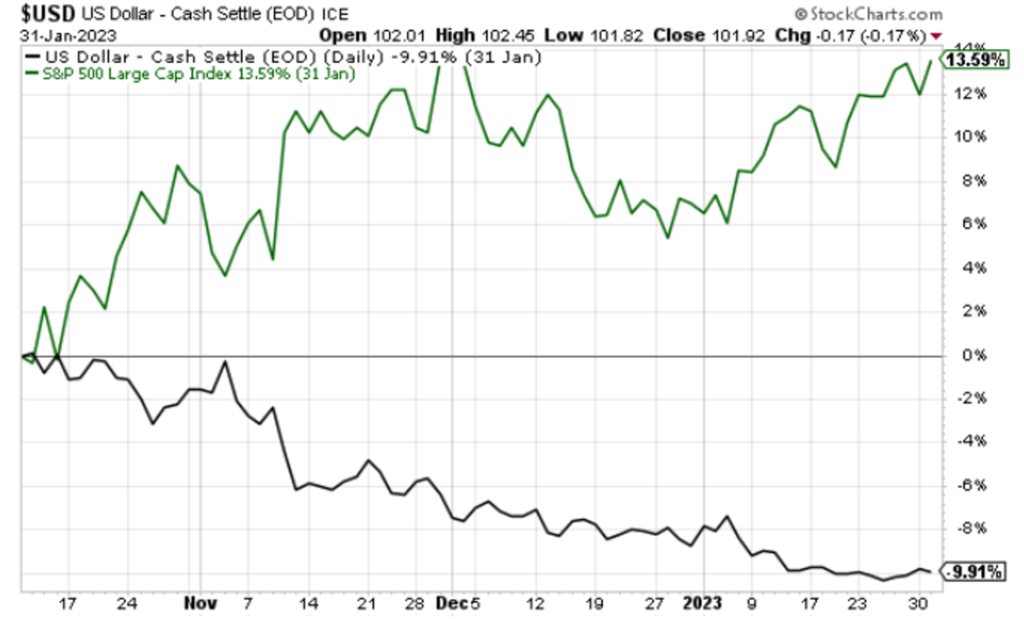
Over the last year, the dollar exploded higher until the fall when it plateaued, then began to fall hard. This weaker dollar was a major tailwind for the market as you can see below.
We’re looking at the relative performance of the dollar and the S&P 500 from mid-October through the end of January. The dollar, in black, lost 10% while the S&P, in green, gained 14%.
 Source: StockCharts.com
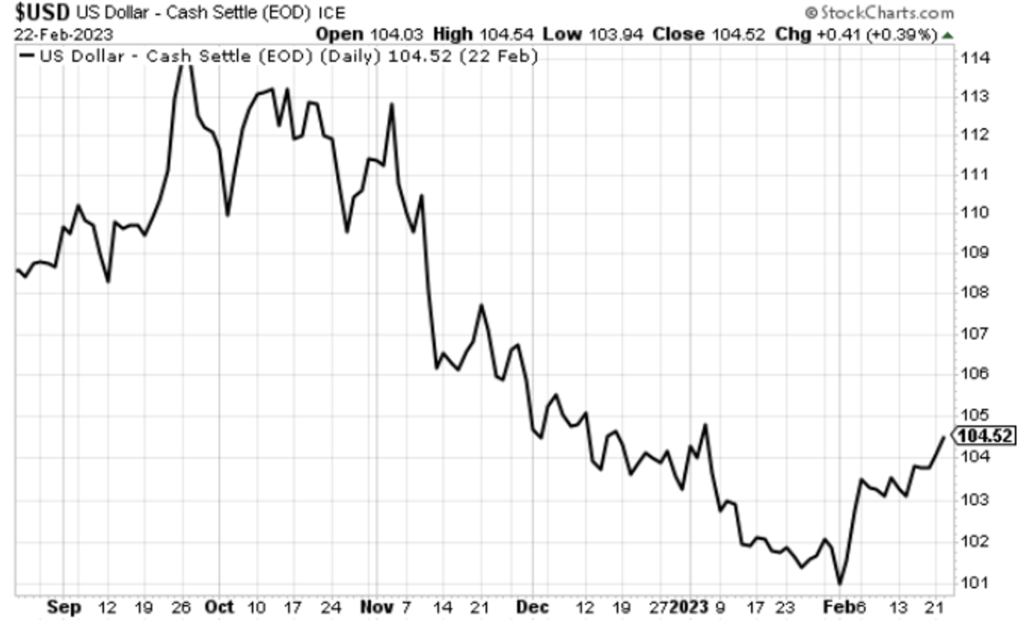
But what’s happened since?
Below, you can see the Dollar Index U-turning abruptly and pushing higher beginning in February.
 Source: StockCharts.com
Here again, the primary contributor to this sharp mover north is the market repricing anticipated hikes from the Fed.
Helping the dollar strength has been the red-hot employment report earlier this month, followed by a series of strong economic data releases.
Bottom line: Until we see cracks in the 10-year Treasury yield and the US Dollar Index, bulls are going to have a hard time pushing stock prices meaningfully higher.
But over in the crypto sector, a different story has been playing out
While stocks have taken it on the chin this month, Bitcoin and the crypto sector have done a remarkable job of holding into recent gains despite economic headwinds.
For more on this, let’s go to our crypto expert Luke Lango and his latest Crypto Investor Network update:
It is one thing to rally when the macroeconomic news flow is good. It’s another thing – and a more impressive one – to rally when the macroeconomic news flow is bad.
That’s what cryptos did [last] week.
Both the January CPI and PPI reports came in hotter than expected, while multiple Fed officials sounded super-hawkish in their public comments. As you’ll recall, in 2022, hot inflation reports and hawkish Fed speak were a deadly combination for cryptos. Anytime we got a hot inflation report and a Fed member talking about a 50-basis-point hike, cryptos plunged.
Not this time.
[Last] week, we got two hot inflation reports and multiple Fed members talking about a 50-basis-point hike. Yet, cryptos didn’t plunge. They rallied.
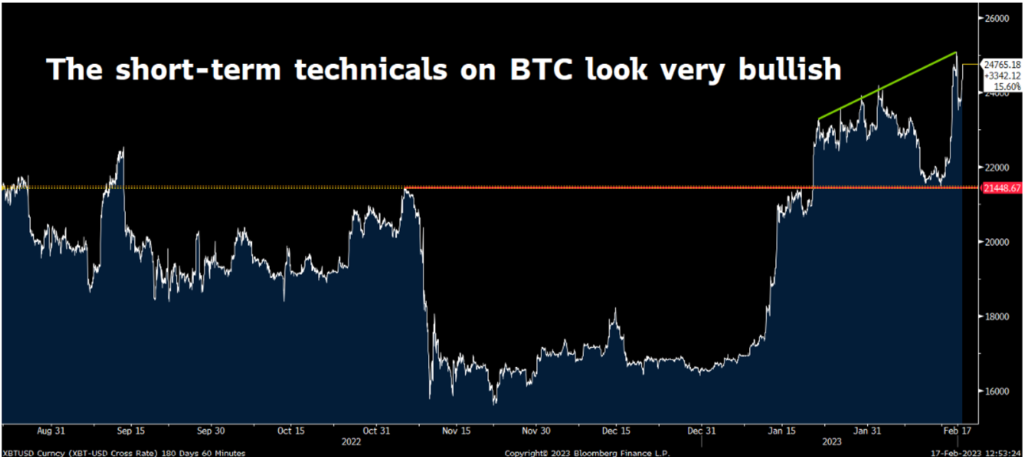
And while Bitcoin has pulled back over the last two days, it’s still holding key horizontal resistance at roughly $23,700 (it trades at about $23,950 as I write).
Luke sees technical strength building
Luke’s Crypto Investor Network newsletter focuses on cutting-edge altcoins, but Bitcoin remains the barometer of the crypto sector. In general, its trend sets the momentum direction for the broader altcoin world. So, to get a sense for where the sector is heading, we look to Bitcoin.
Fortunately, Luke is seeing growing technical strength in Bitcoin. Back to his update:
In the super short term, BTC turned previous peaks from October and January into support.
When stocks/cryptos turn resistance levels into support, that’s usually a sure-fire sign that the main trend for the asset has changed course from bearish to bullish.
 Source: Bloomberg
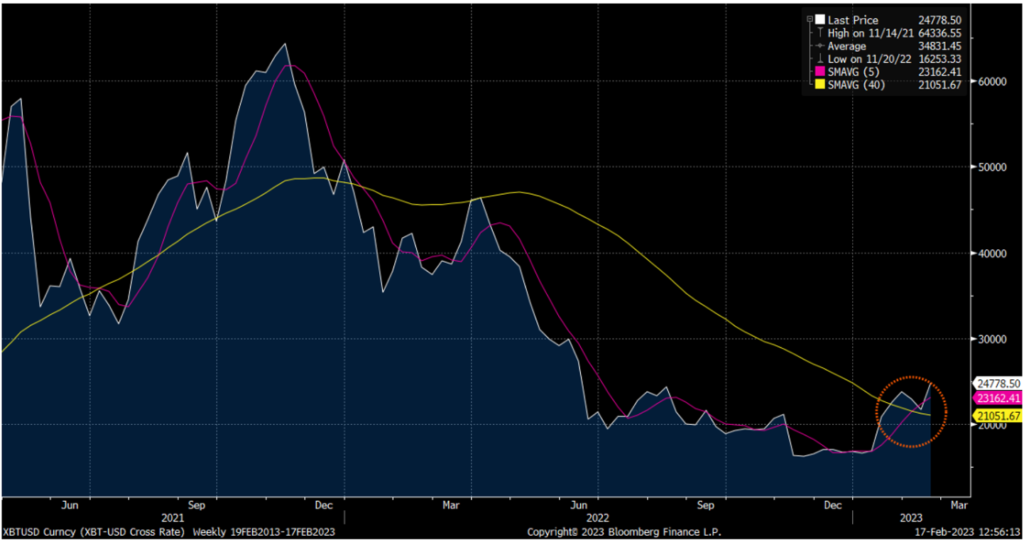
Also of note, Bitcoin’s five-week moving average has charged above its 40-week moving average for the first time in this bear market cycle and the first time in over six months.
 Source: Bloomberg
That’s significant because every time Bitcoin has done this before, it was the start of a new boom cycle.
Luke goes on to highlight how every single time that Bitcoin’s five-week moving average flipped above its 40-week moving average after spending at least six months below it, cryptos were in the process of transitioning from a bear market to a new bull market.
Below is the chart Luke provided showing the historical returns associated with this market dynamic.

Here’s Luke’s broad crypto sector takeaway:
Overall, we feel very confident in our outlook for cryptos in 2023.
We believe that a new boom cycle has begun and that BTC will charge toward $40,000 in 2023, while many high-quality altcoins will rise 200%, 300%, or more.
If you haven’t bought the dip in cryptos yet, you should think about doing so right away.
For more of Luke’s research in Crypto Investor Network, as well as the specific altcoins he believes are best positioned to surge this year, click here.
We’ll keep you updated on the 10-year Treasury yield, the U.S. Dollar Index, and Bitcoin here in Digest.
Have a good evening,
Jeff Remsburg
The post Two Big Market Headwinds appeared first on InvestorPlace.
dollar
inflation
reserve
interest rates
fed
correlation
us dollar


Argentina Is One of the Most Regulated Countries in the World
In the coming days and weeks, we can expect further, far‐reaching reform proposals that will go through the Argentine congress.

Crypto, Crude, & Crap Stocks Rally As Yield Curve Steepens, Rate-Cut Hopes Soar
Crypto, Crude, & Crap Stocks Rally As Yield Curve Steepens, Rate-Cut Hopes Soar
A weird week of macro data – strong jobless claims but…

Fed Pivot: A Blend of Confidence and Folly
Fed Pivot: Charting a New Course in Economic Strategy Dec 22, 2023 Introduction In the dynamic world of economics, the Federal Reserve, the central bank…


