Economics
This “Unprecedented” Fiscal Doom Loop Is Getting Worse
This "Unprecedented" Fiscal Doom Loop Is Getting Worse
Submitted by QTR’s Fringe Finance
Friend of Fringe Finance Lawrence Lepard released…
This “Unprecedented” Fiscal Doom Loop Is Getting Worse
Submitted by QTR’s Fringe Finance
Friend of Fringe Finance Lawrence Lepard released his most recent investor letter this week.
I believe Larry to truly be one of the muted voices that the investing community would be better off considering. He gets little coverage in the mainstream media, which, in my opinion, makes him someone worth listening to twice as closely.
Larry was kind enough to allow me to share his thoughts heading into Q4 2023. The letter has been edited ever-so-slightly for formatting, grammar and visuals.
OVERVIEW
It was an interesting quarter. There was a whiff of deflation as the Dow Jones, S&P 500 and NASDAQ all declined in value. But this was not matched by the prices of crude oil and commodities, both of which were strong, and the bond market had a bad quarter as rates continued to rise across the curve. A slowing economy, falling stocks and bonds, and rising commodity inflation spell one thing very clearly to us: STAGFLATION.
In the third quarter of 2023, the Fund increased in value slightly by 0.5% and picked up considerable ground (over 10% outperformance) on our benchmark index the Gold Stock Juniors ETF (GDXJ). A big piece of this outperformance occurred due to our large position in Lavras Gold which we profile on page 21. As we have said before, we manage the Fund aggressively, and in bear markets for gold stocks, we expect that we will do worse than GDXJ. However, we also want to point out that the converse is true in bull markets; in 2019 EMA was up 98% vs. the GDXJ which was up 40%, and in 2020 EMA was up 122% vs. the GDXJ which was up 33%. We believe that when this market turns, the results will be similar.
US FISCAL DOOM LOOP GETS WORSE
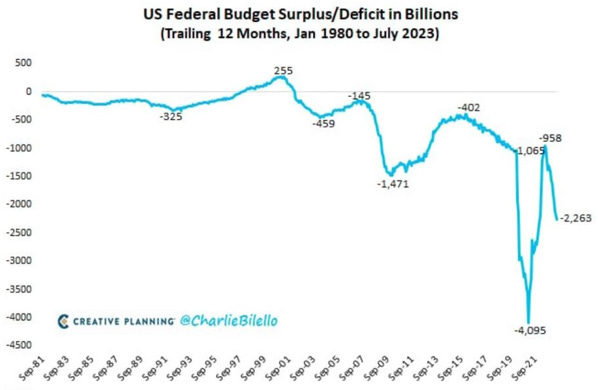
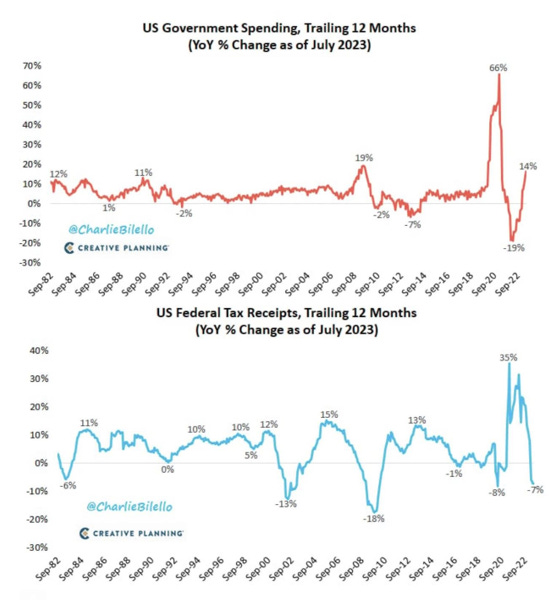
In our view, the biggest elephant in the room is the US Fiscal Doom Loop. To refresh: US Government spending is out of control, and there appears to be very little political will to stop it. As the chart below shows, Government spending is up 14% yoy and tax receipts are down 7% yoy. Fiscal year ended September 2023 is projected to have a deficit of over $2 Billion (or roughly 8% of GDP). In the past, deficits of this magnitude only materialized during significant downturns like the bursting of the Dotcom Bubble, the 2008 GFC and the COVID crisis. It is unprecedented to have deficits of this magnitude with the economy and employment being relatively strong.
One can only imagine where the deficit goes when the FED’s monetary jihad of rapid rate increases tips the economy over. Past economic downturns typically have increased the deficit/GDP ratio by 8-14%.
So as the economy moves into recession in 2024 (as we believe), the US could be looking at deficits as high as 20% of GDP ($5 Trillion) if the economy slows dramatically.
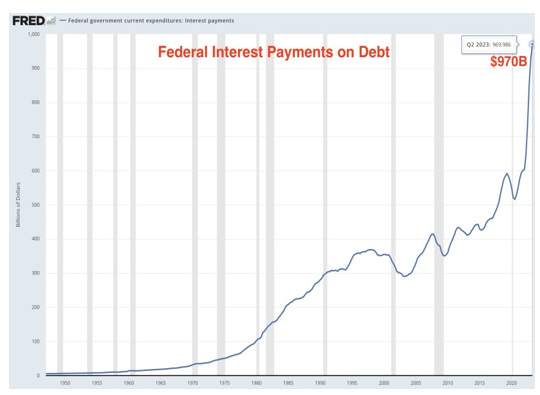
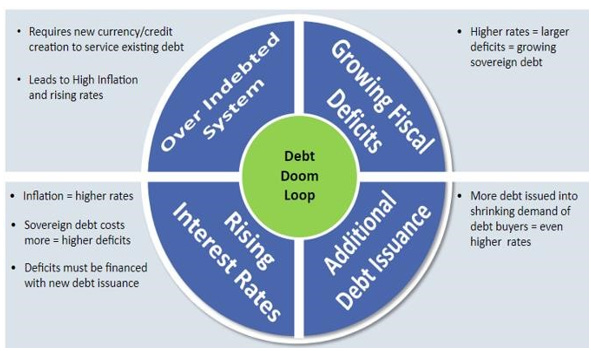
The reason we see it as a “doom loop” is that the current $33.5 Trillion of Federal Debt is continually costing more to service.1The Fed’s rapid increase of interest rates, and elimination of Quantitative Easing (e.g., Fed buying Treasury bonds) has impacted US Treasury interest costs. Note below how interest payments have soared over the past two years.
Interest expense on the Federal Debt now exceeds our substantial annual national defense spending of $816B as well as every other category except Social Security and Medicare.
The Doom Loop occurs as higher interest costs drive higher deficits, forcing the Government to sell more bonds to finance the same. Ceteris paribus, more bond sales lead to higher interest rates which then increase the deficit further. Repeat until there is no market for the bonds. Of course, at that point the Fed is forced to step in and become the buyer of last resort for the bonds to keep the bond market functioning.
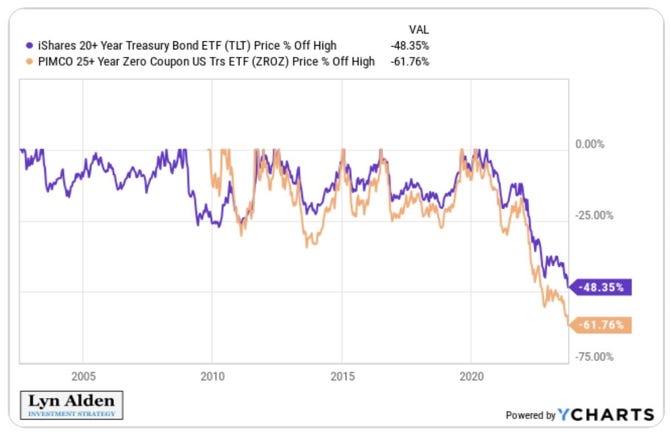
As the chart below shows, it has been a rough couple of years for the bond market.
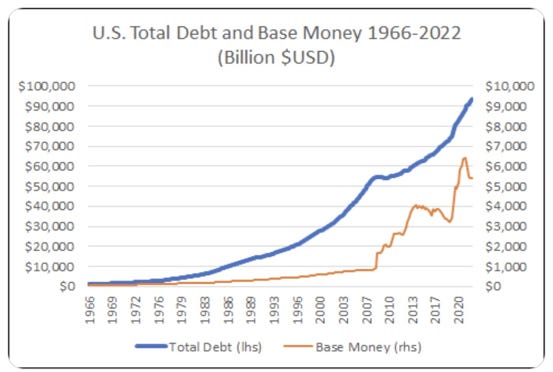
The fundamental issue is that without growing the money supply, there is not enough capital to support the inflated bubble valuations. When the Fed chose violence and went on a campaign of rapid rate increases (taking the Fed funds rate from 0.25% in 2021 to 5.25% today), coupled with the sale of some of its bond portfolio (Quantitative Tightening), it increased the cost and reduced the supply of capital necessary to support all financial markets. Government bond sales (which drive rates higher) are crowding out the debt markets. This is going to have to change or the financial markets as we know them are going to collapse. The only issue is the time scale. The subject is addressed nicely in the chart below by Lyn Alden:
As you can see, when any person, company or government takes on massive leverage, the proceeds better generate productive economic outcomes to support the debt. (e.g., levering to invest in education or nuclear plants has a payback, but if the money is used to finance War, virtually nothing is gained/produced). Thus, to support an over-levered entity, more financing or money supply growth is required. When markets enter chaotic times, like in 2008-2013 and 2018-2021, the Fed is forced to be very aggressive in growing the monetary base via expansion of their balance sheet (money printing). This is what has taken the Fed Balance Sheet Assets from $800B to roughly $8T in the past 15 years. With debt continuing to grow rapidly we see no reason why this will not occur again, perhaps in short order.
50% OFF ALL SUBSCRIPTIONS: Subscribe and get 50% off and no price hikes for as long as you wish to be a subscriber.
The Fed’s recent retrenchment in the Base Money Supply (orange line in the chart above) began in February of 2022. There is a lag effect in terms of its impact on the economy. We believe the lag is now starting to bite hard and that is showing up in the numbers as we will detail below.
EVIDENCE OF ECONOMIC SLOWDOWN
Despite recent Wall Street and CNBC cheerleading, we believe the economy is beginning to roll over.
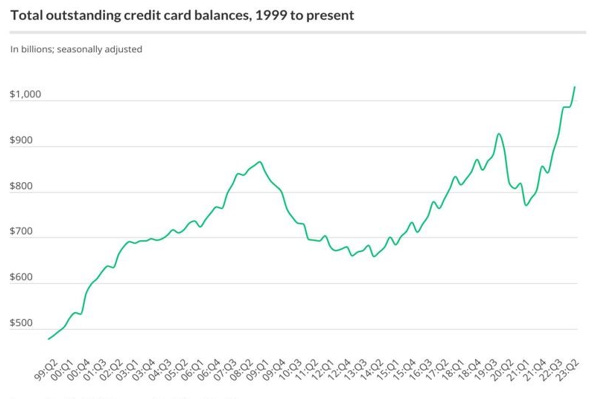
Post COVID, consumers regained confidence and went on a spending spree to maintain their lifestyles despite inflation and rising living costs. They did this by significantly increasing their borrowing on credit cards as seen in the chart below:
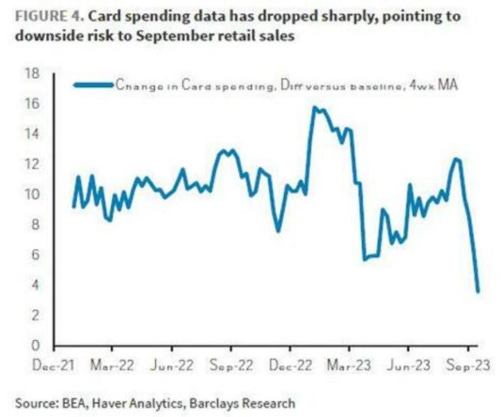
What is not shown on this chart is the average interest rate on these credit cards. Five years ago, the average interest rate on these cards was 13%. Today that rate is 22% – a significant burden for consumers carrying credit card balances. These higher costs have had an impact on consumer behavior and as the next chart shows credit card spending dropped sharply in September.
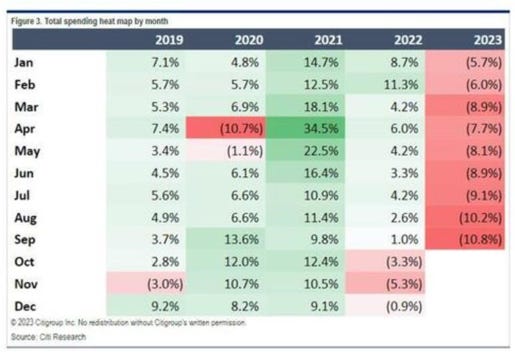
And as the following chart shows, total consumer spending has been dropping significantly year over year in 2023, and the trend is getting worse.
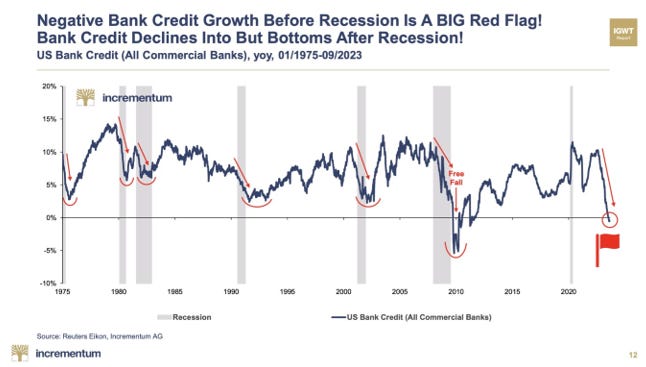
Further, signs of an imminent recession include the level of bank credit growth. The last time it was this negative was in the 2008 GFC. Negative bank credit growth is a very reliable recession indicator.
We believe the economy is very sick. The doctored employment figures are not telling the true story.
THE EVERYTHING BUBBLE IS BURSTING
High inflation, higher interest rates, bonds falling, slowing economic indicators and the stock market starting to look wobbly all lead us to conclude that the “Everything Bubble” that was driven by free money (ZIRP) is in the process of bursting. We believe that this will lead to a US sovereign debt crisis as the US Federal Government’s fiscal position is not sustainable.
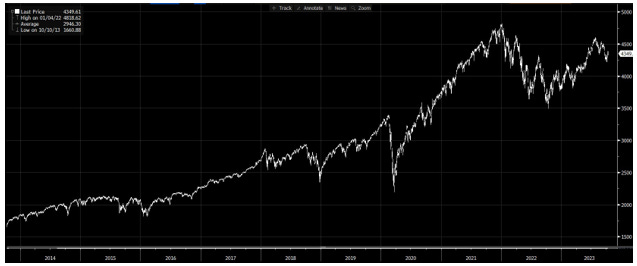
Let’s examine the stock market. As you can see in the chart below, the S&P 500 put in a high in December of 2021, fell hard in 2022 and has now rebounded to retrace a large portion of that loss. We believe the December 2021 high will prove to have been the “top” for this monetary expansion cycle. Absent extremely aggressive money creation by the Fed, the stock market is headed much much lower.
The reasons for that belief are many. First, the economy is rolling over as detailed above. Secondly, using the “Buffet Indicator” of Market Cap to GDP, the stock market is still almost as expensive as it was at the 2000 peak. Another good measure is to look at the Earnings Yield which is the inverse of the PE ratio. (e.g., a PE multiple of 20x has an earnings yield of 5%.) As the chart below shows, the S&P 500 currently has an earnings yield of 4.1%. (PE is 24.5x). Still very much on the expensive side of the scale.
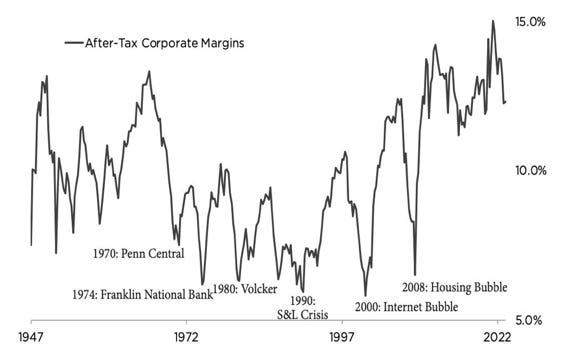
Furthermore, companies are currently operating at peak profit margins. With inflationary pressures driving costs higher (particularly labor), these margins are sure to get squeezed as soft demand does not allow many companies to pass along price increases.
So, we see nothing but downside in the US stock market. Which feeds consumer confidence and spending via its wealth effect. We believe that when the stock market rolls over again, the current Fed obsession with fighting inflation will turn into employment and recession concerns. Once again, the Fed will realize that they have gone too far. Based upon their past performance, we can reliably predict that they will pivot to monetary accommodation. In fact, the Fed is already displaying signs of this with the following recent headlines:
-
“If the bond market keeps this up, the Federal Reserve will have less of a reason to hike rates again.” Nick Timiaros, Wall Street Journal (Nick is often a Fed mouthpiece)
-
Wall Street Journal Headlines: Rising Interest Rates Mean Deficits Finally Matter. Bond Sell Off Might Force Fed to Rethink Shedding Assets.
-
FED’s Mary Daly: With The Rise in Bond Yields the Need To Do Additional Tightening By The Fed is Not There
-
FED Governor Laurie Logan: Higher Yields May Mean Less Need to Raise Rates.
With the US stock market threatening to break below its technically important 200 day moving average, these dovish comments by the Fed and its mouthpieces at the Wall Street Journal do not surprise us.
These and other recent statements by several economists that the inflation target should be adjusted upward demonstrate that we are probably very close to the end of this FED tightening cycle. This is reflected in the CME Fed futures which currently predict only a 4% probability of the Fed tightening at their November meeting.
Looking ahead to 2024, despite likely persistent inflation, market dislocations will force the FED to loosen monetary conditions. This will be extremely bullish for sound money assets. It is simply a matter of “when, not if” they will ease and return to lower rates and QE. We believe both lower rates and QE are inevitable because of the mathematics outlined on Lyn’s chart on Page 7. Without growth in the monetary base the system will ultimately implode.
Recall, in March of this year, things did break in the form of Silicon Valley Bank’s bankruptcy, but they were able to patch that up with a new liquidity program that they claim is not QE (in reality it is QE). So, the next question becomes, when do things break? We have always referred to this as rivets popping.
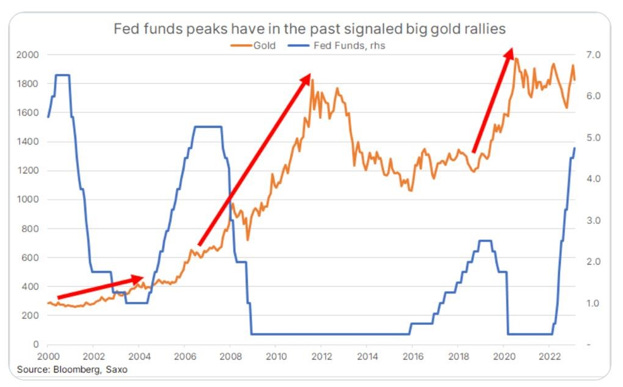
Also, if this Fed tightening cycle is complete, and after a pause period, their next move will be to drop the Fed Funds rate to respond to a weaker economy, the implications for gold are extremely bullish. This next chart clearly demonstrates gold’s price response when Fed tightening cycles have ended.
As you can see in the chart above, when the blue line (Fed Funds Rate) peaks as it did in 2000, 2008 and 2018, gold prices soar and a gold miner bull market ensues. Gold has been bumping up against its alltime high of roughly $2,050. When gold convincingly pushes through $2,100, we expect it to quickly attain $2,500 and then $3,000. The impact on the gold miners will be explosive.
Part 2 of this letter can be read in full here and includes thoughts on the future of gold, Central Banking and 7 signs of further fissures in the economy that will ultimately force the Fed’s hand to re-stimulate.
Please read Larry and QTR’s full disclaimer here.
Tyler Durden
Wed, 10/25/2023 – 00:05
gold
inflation
deflation
stagflation
commodities
commodity
monetary
markets
reserve
money supply
interest rates
fed
bubble
monetary expansion
money printing
inflationary


Argentina Is One of the Most Regulated Countries in the World
In the coming days and weeks, we can expect further, far‐reaching reform proposals that will go through the Argentine congress.

Crypto, Crude, & Crap Stocks Rally As Yield Curve Steepens, Rate-Cut Hopes Soar
Crypto, Crude, & Crap Stocks Rally As Yield Curve Steepens, Rate-Cut Hopes Soar
A weird week of macro data – strong jobless claims but…

Fed Pivot: A Blend of Confidence and Folly
Fed Pivot: Charting a New Course in Economic Strategy Dec 22, 2023 Introduction In the dynamic world of economics, the Federal Reserve, the central bank…


