Economics
“There Seems To Be $10 Trillion Missing”: Where Is The Rest Of The NIIP?
"There Seems To Be $10 Trillion Missing": Where Is The Rest Of The NIIP?
By Russell Clark, author of the Capital Flows and Asset Markets substack
NIIP…

“There Seems To Be $10 Trillion Missing”: Where Is The Rest Of The NIIP?
By Russell Clark, author of the Capital Flows and Asset Markets substack

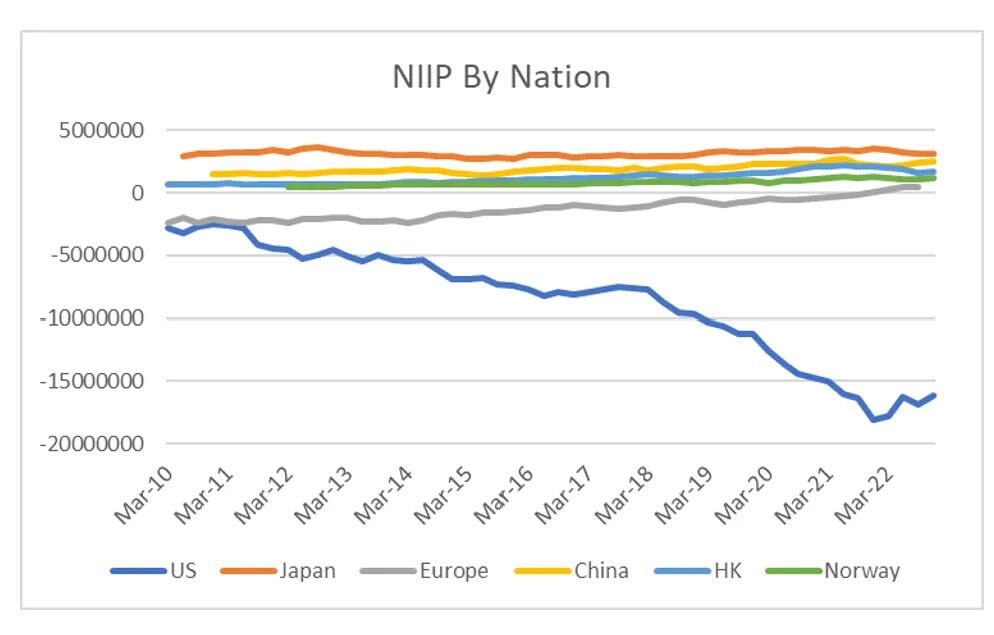
NIIP (net international investment position) is a relative new macro data point. While the US and Japan have data going back over decades, for many other nations we have relatively short period of data. The IMF now does quarterly updates for most countries, so we will use that to show the change in the behaviour of the NIIP. To simplify, I am going to look at countries with and absolute NIIP over USD 1 trillion and Europe – which give us a big 6. US is the only NIIP deficit nation, while Japan, Europe, China, HK and Norway are in surplus.
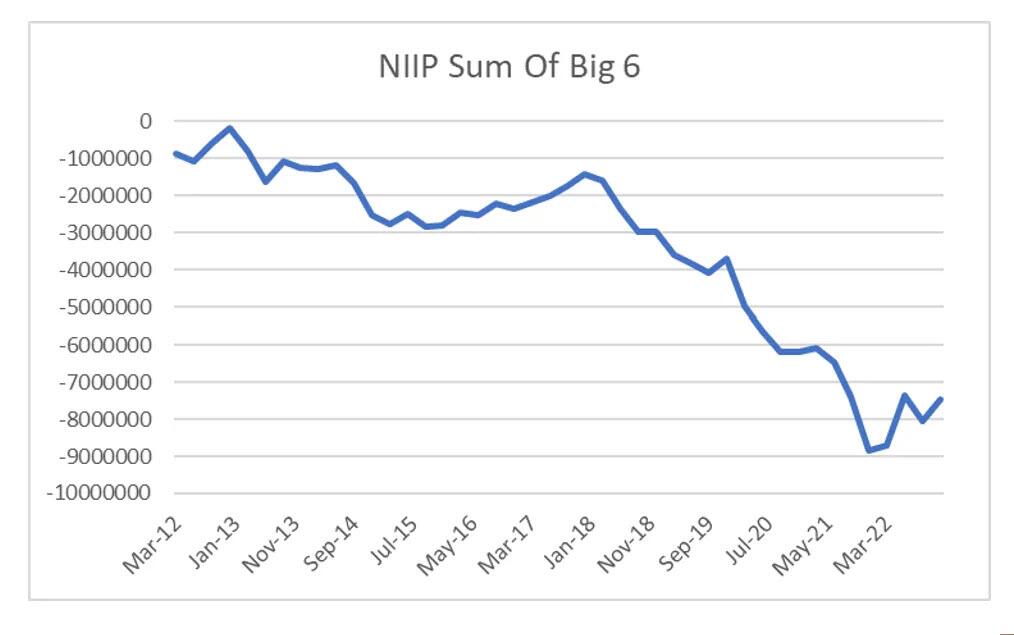
As suggested previously, I wonder if there are “offshore” corporate holdings, but when we look at Ireland NIIP – it is also negative. Saudi NIIP has flatlined over the last decade. The only country that probably should be included in the above it Taiwan, but the last NIIP data point is from 2016 at US 1 trillion surplus. So the data does have some problems. But it we take this big 6, and sum them, we can see in 2018, they were close to balanced. But by 2021, we had a USD9 trillion hole that had opened up.
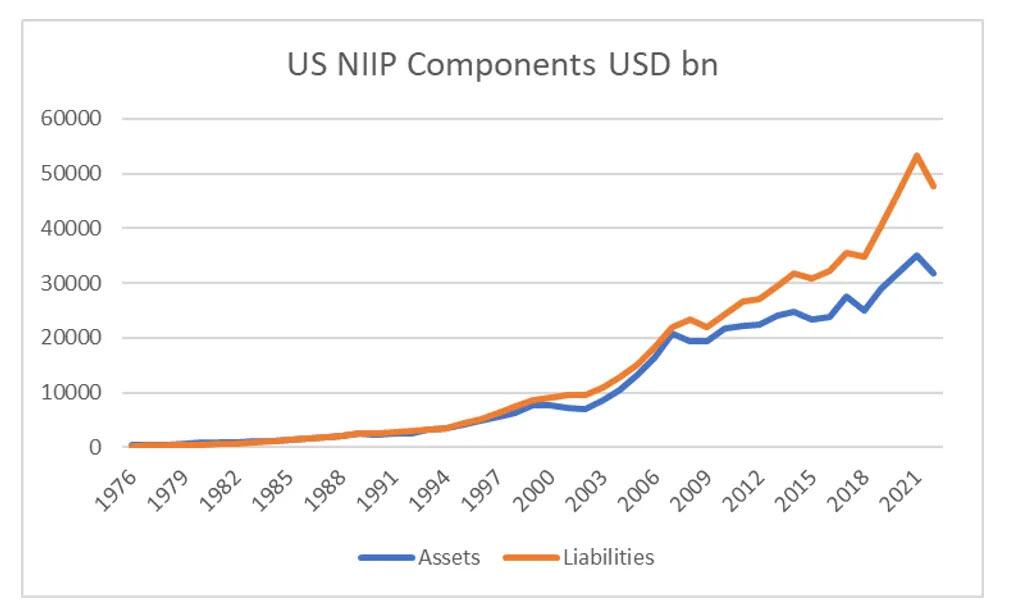
The US provides the most complete and long dated numbers of NIIP.
And as pointed out, it has been the phenomenal growth in US liabilities than has driven the deterioration of its NIIP.
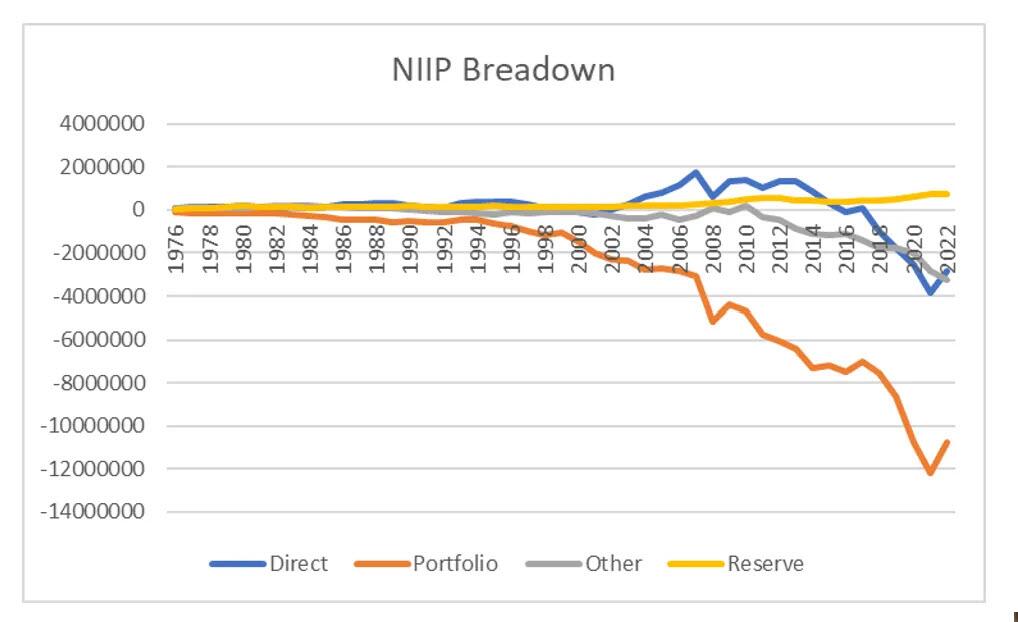
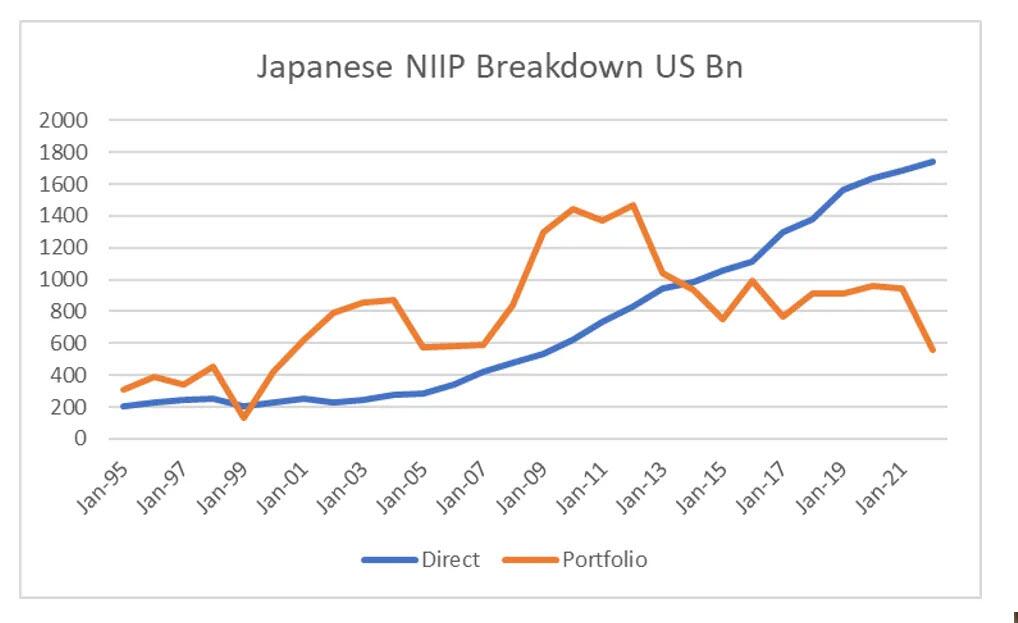
But we can also breakdown NIIP into its various components. Direct refers to FDI (factories etc), Portfolio (debt and equities), Reserves (gold in the case of the US) and Other. We can see that portfolio component of NIIP has been the real outlier.
The simple answer would be that US assets have performed so well, that the US NIIP is just a side effect of that. What we should see is surging NIIP for portfolio NIIP in large US investors like Japan. Weirdly, we do not see that all in Japanese NIIP data. If anything we are seeing Japanese portfolio NIIP fall. Even more weirdly is that the direct investment NIIP for Japan DOES match up with US NIIP. So something weird is happening in “portfolio” NIIP.
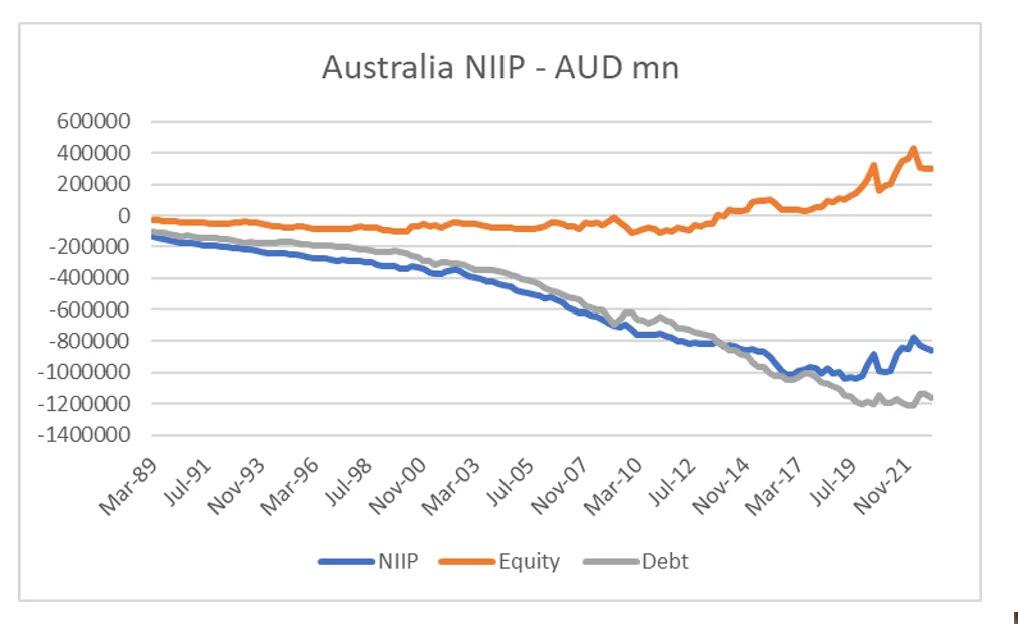
So why is NIIP breaking down? My best guess is that capital flows BETWEEN countries WERE the dominant driver of asset prices. Now the dominant driver of asset prices is share buybacks. From an accounting perspective I guess it makes sense – you are basically taking the balance sheet and paying it out to shareholders. If the value of the company rises when you do that, your investment position must move negative. It would imply that negative equity would correlate with negative NIIP. Australia has a long NIIP history, although it presents the data slightly differently. Australia is a capital starved nation (25 million people in a single continent will always be reliant on foreign capital) and will always have a negative NIIP. What is interesting is that in recent years, its Equity position (which I am going to use as a proxy for portfolio NIIP) has improved (that is the value of foreign equities has risen more than Australian equities). So we see in Australian portfolio NIIP there is a lack of share buy backs potentially?
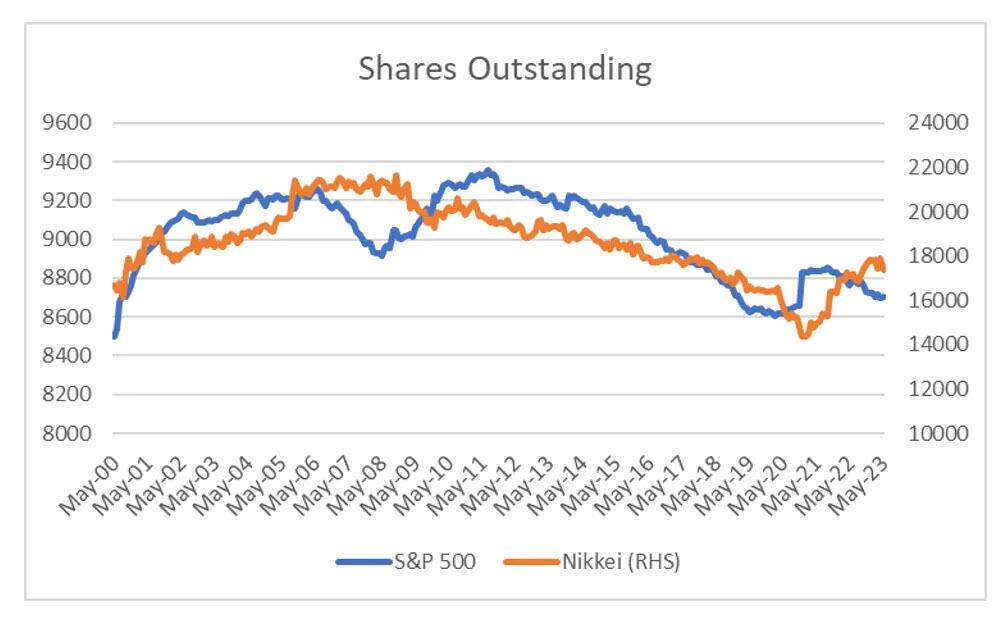
So my quick and ready method of looking for share buy backs is to look at the market cap of an index divided by share price to generate a “shares outstanding”. Both the Nikkei and the S&P 500 have seen share count fall, at least before Covid.
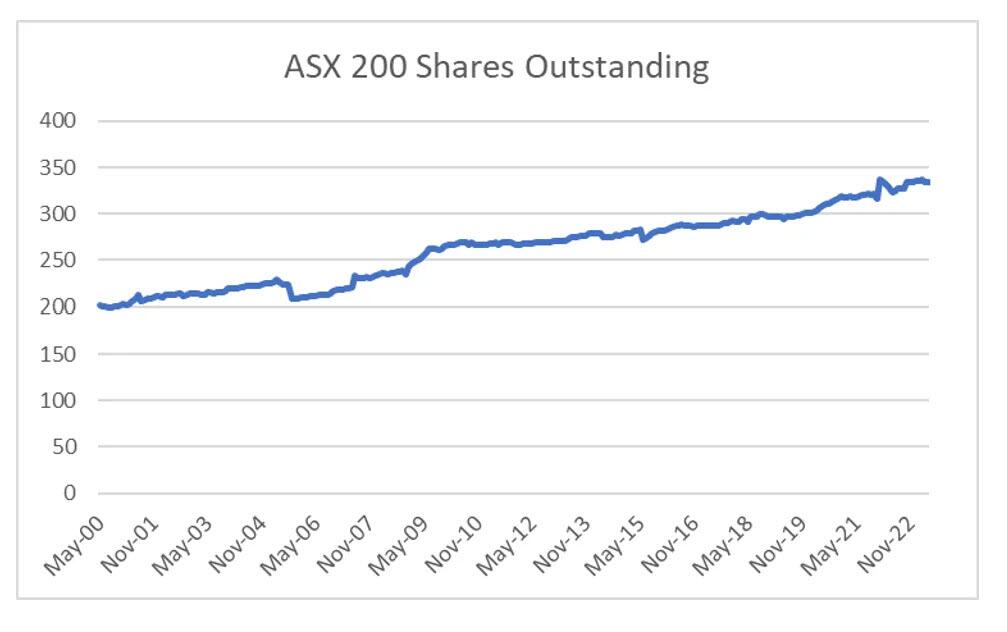
In contrast, Australia has seen its share count rise continuously. Australia employs dividend imputation, which makes dividends as tax efficient as share buy backs for redistributing cash.
So if share buy backs (or the “private equitisation” ) of the S&P 500 is causing the growth in NIIP, is there a way we can measure that? Share buy backs and acquisitions tend to grow the gap between book value and tangible book value. Bloomberg provides a book value and tangible book value per share measure for the S&P 500. The Gap between the two has grown particularly wide in recent years.
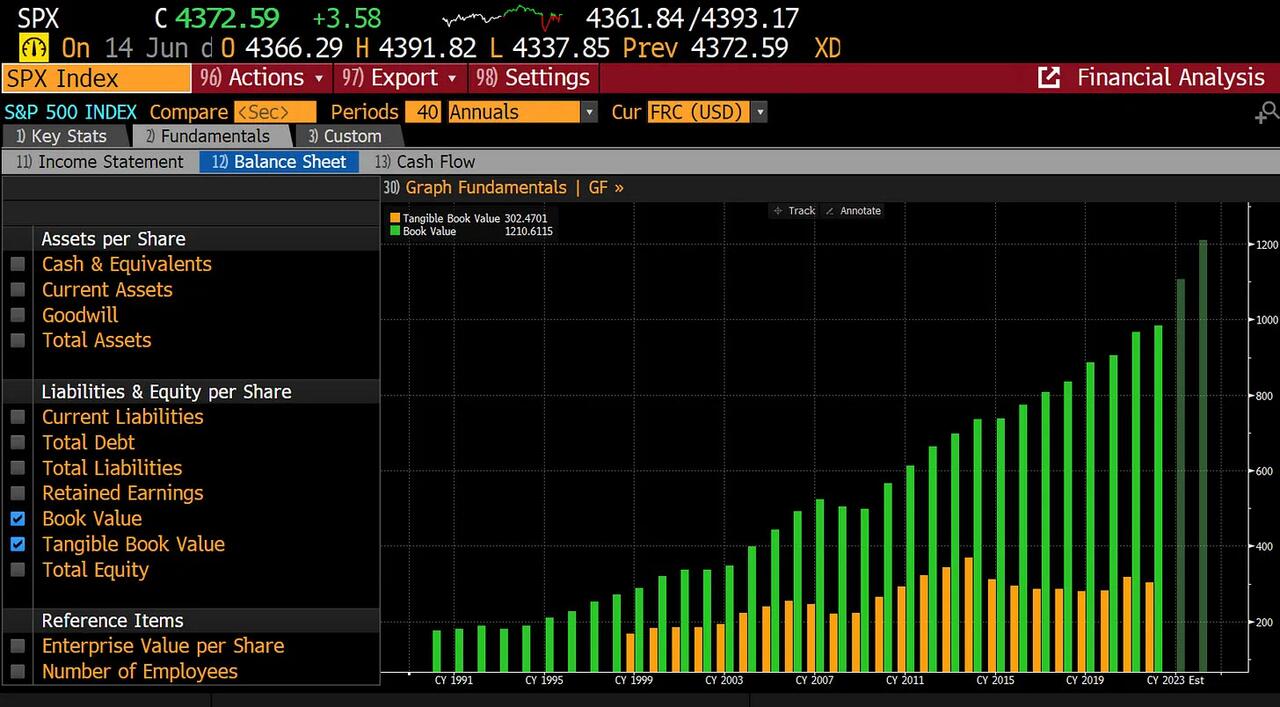
My calculations give a share count of 8700 for the S&P. With a book value of 983 – that implies a book value for the S&P 500 of USD 8.5 trillion. Tangible book value would be USD 2.6 trillion, so a USD 6 trillion gap. Of course the current market value of S&P 500 is USD 35 trillion. For my mind, the growing gap between tangible and real book value seems to match up with changing portfolio NIIP. Share buybacks were illegal in the US until 1982 (legalised as part of pro-capital move), and even more interestingly, Japan after the bubble economy blew up blamed much of the problems on intercompany share purchases. Japan has recently changed policy, to encourage companies to buy their own shares at least (for many years policy was to unwind corporate share ownership). The implication is that if conditions don’t change, then we could also see Japanese portfolio NIIP move negative. Perhaps that is the true legacy of QE – that foreign capital flows are no longer the driver of markets, but share buy backs
* * *
Incidentally, ZH said this all the way back in 2015…
Only buyer of stocks: corporations through buybacks.
Only source of funding: cheap debt http://t.co/imfwGeldJW pic.twitter.com/wT62ARQuy8— zerohedge (@zerohedge) June 24, 2015
Tyler Durden
Fri, 06/16/2023 – 11:00
gold
markets
policy
bubble


Argentina Is One of the Most Regulated Countries in the World
In the coming days and weeks, we can expect further, far‐reaching reform proposals that will go through the Argentine congress.

Crypto, Crude, & Crap Stocks Rally As Yield Curve Steepens, Rate-Cut Hopes Soar
Crypto, Crude, & Crap Stocks Rally As Yield Curve Steepens, Rate-Cut Hopes Soar
A weird week of macro data – strong jobless claims but…

Fed Pivot: A Blend of Confidence and Folly
Fed Pivot: Charting a New Course in Economic Strategy Dec 22, 2023 Introduction In the dynamic world of economics, the Federal Reserve, the central bank…


