Economics
The New York Fed DSGE Model Forecast— September 2023
This post presents an update of the economic forecasts generated by the Federal Reserve Bank of New York’s dynamic stochastic general equilibrium (DSGE)…


This post presents an update of the economic forecasts generated by the Federal Reserve Bank of New York’s dynamic stochastic general equilibrium (DSGE) model. We describe very briefly our forecast and its change since June 2023. As usual, we wish to remind our readers that the DSGE model forecast is not an official New York Fed forecast, but only an input to the Research staff’s overall forecasting process. For more information about the model and variables discussed here, see our DSGE model Q & A.
The New York Fed model forecasts use data released through 2023:Q2, augmented for 2023:Q3 with the median forecasts for real GDP growth and core PCE inflation from the Survey of Professional Forecasters (SPF), as well as the yields on ten-year Treasury securities and Baa-rated corporate bonds based on 2023:Q3 averages up to August 30. Moreover, starting in 2021:Q4, the expected federal funds rate between one and six quarters into the future is restricted to equal the corresponding median point forecast from the latest available Survey of Primary Dealers (SPD) in the corresponding quarter. The current projection can be found here.
The change in the forecast relative to June reflects the fact that the economy remains resilient in spite of the increasingly restrictive stance of monetary policy. Output growth is projected to be almost 1 percentage point higher in 2023 than forecasted in June (1.9 versus 1.0 percent) and somewhat higher than June for the rest of the forecast horizon (1.1, 0.7, and 1.2 percent in 2024, 2025, and 2026, versus 0.7, 0.4, and 0.9 in June, respectively). The probability of a not-so-soft recession, as defined by four-quarter GDP growth dipping below -1 percent by the end of 2023, has become negligible at 4.6 percent, down from 26 percent in June. According to the model, much of the resilience in the economy so far stems from the surprising strength in the financial sector, which counteracts the effects of the tightening in monetary policy. Inflation projections are close to what they were in June: 3.7 percent for 2023 (unchanged from the previous forecast), 2.2 percent for 2024 (down from 2.5 percent), and 2.0 percent for both 2025 and 2026 (down from 2.2 and 2.1 percent, respectively). The model still sees inflation returning close to the FOMC’s longer-run goal by the end of next year.
The output gap is projected to be somewhat higher over the forecast horizon than it was in June, consistent with the fact that the surprising strength of the economy is mainly driven by demand factors such as financial shocks, as opposed to supply factors. As in the June forecast, the gap gradually declines from its current positive value to a slightly negative value by 2025. The real natural rate of interest is estimated at 2.5 percent for 2023 (up from 2.2 percent in June), declining to 2.2 percent in 2024, 1.9 percent in 2025, and 1.6 percent in 2026.
Forecast Comparison
| Forecast Period | 2023 | 2024 | 2025 | 2026 | ||||
|---|---|---|---|---|---|---|---|---|
| Date of Forecast | Sep 23 | Jun 23 | Sep 24 | Jun 24 | Sep 25 | Jun 25 | Sep 26 | Jun 26 |
| GDP growth (Q4/Q4) |
1.9 (0.2, 3.6) |
1.0 (-1.9, 4.0) |
1.1 (-4.0, 6.3) |
0.7 (-4.2, 5.7) |
0.7 (-4.4, 5.8) |
0.4 (-4.7, 5.5) |
1.2 (-4.2, 6.6) |
0.9 (-4.5, 6.3) |
| Core PCE inflation (Q4/Q4) |
3.7 (3.4, 3.9) |
3.7 (3.3, 4.2) |
2.2 (1.5, 3.0) |
2.5 (1.6, 3.3) |
2.0 (1.1, 2.9) |
2.2 (1.2, 3.1) |
2.0 (1.0, 3.0) |
2.1 (1.1, 3.2) |
| Real natural rate of interest (Q4) |
2.5 (1.3, 3.7) |
2.2 (1.0, 3.5) |
2.2 (0.8, 3.7) |
1.8 (0.3, 3.2) |
1.9 (0.3, 3.4) |
1.5 (-0.1, 3.0) |
1.6 (-0.0, 3.3) |
1.3 (-0.4, 3.0) |
Notes: This table lists the forecasts of output growth, core PCE inflation, and the real natural rate of interest from the September 2023 and June 2023 forecasts. The numbers outside parentheses are the mean forecasts, and the numbers in parentheses are the 68 percent bands.
Forecasts of Output Growth
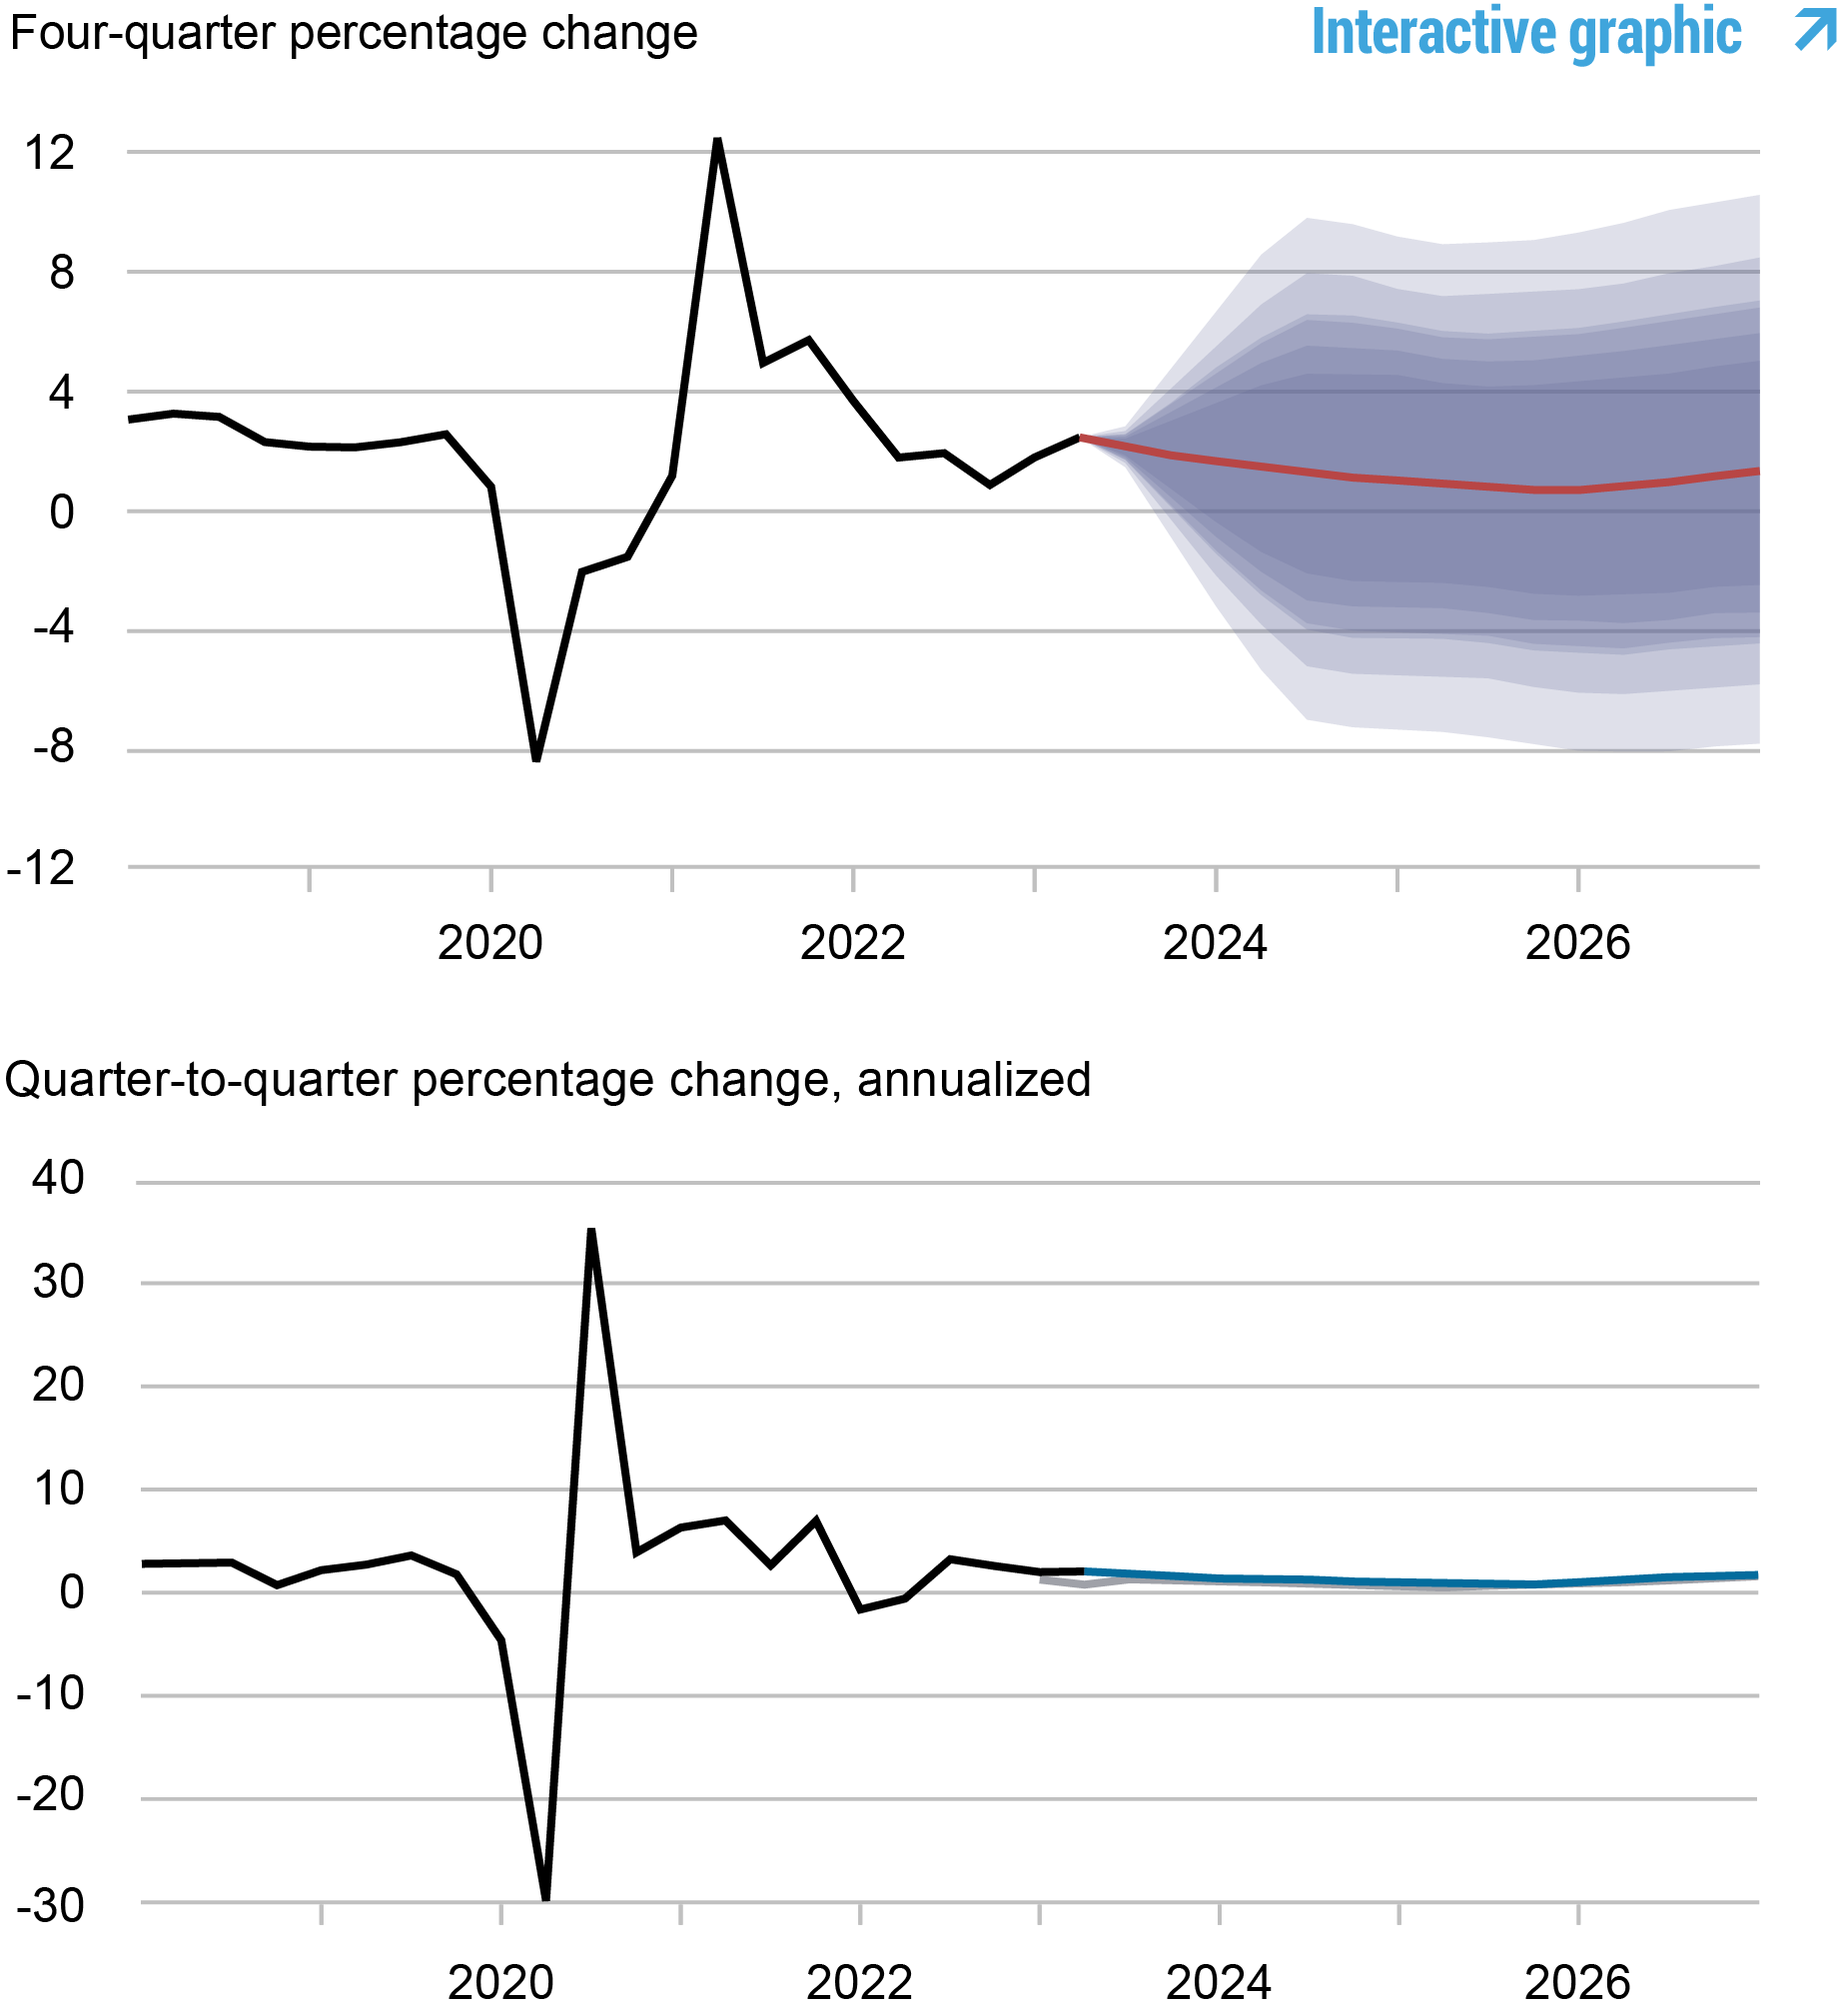
Source: Authors’ calculations.
Notes: These two panels depict output growth. In the top panel, the black line indicates actual data and the red line shows the model forecasts. The shaded areas mark the uncertainty associated with our forecasts at 50, 60, 70, 80, and 90 percent probability intervals. In the bottom panel, the blue line shows the current forecast (quarter-to-quarter, annualized), and the gray line shows the June 2023 forecast.
Forecasts of Inflation
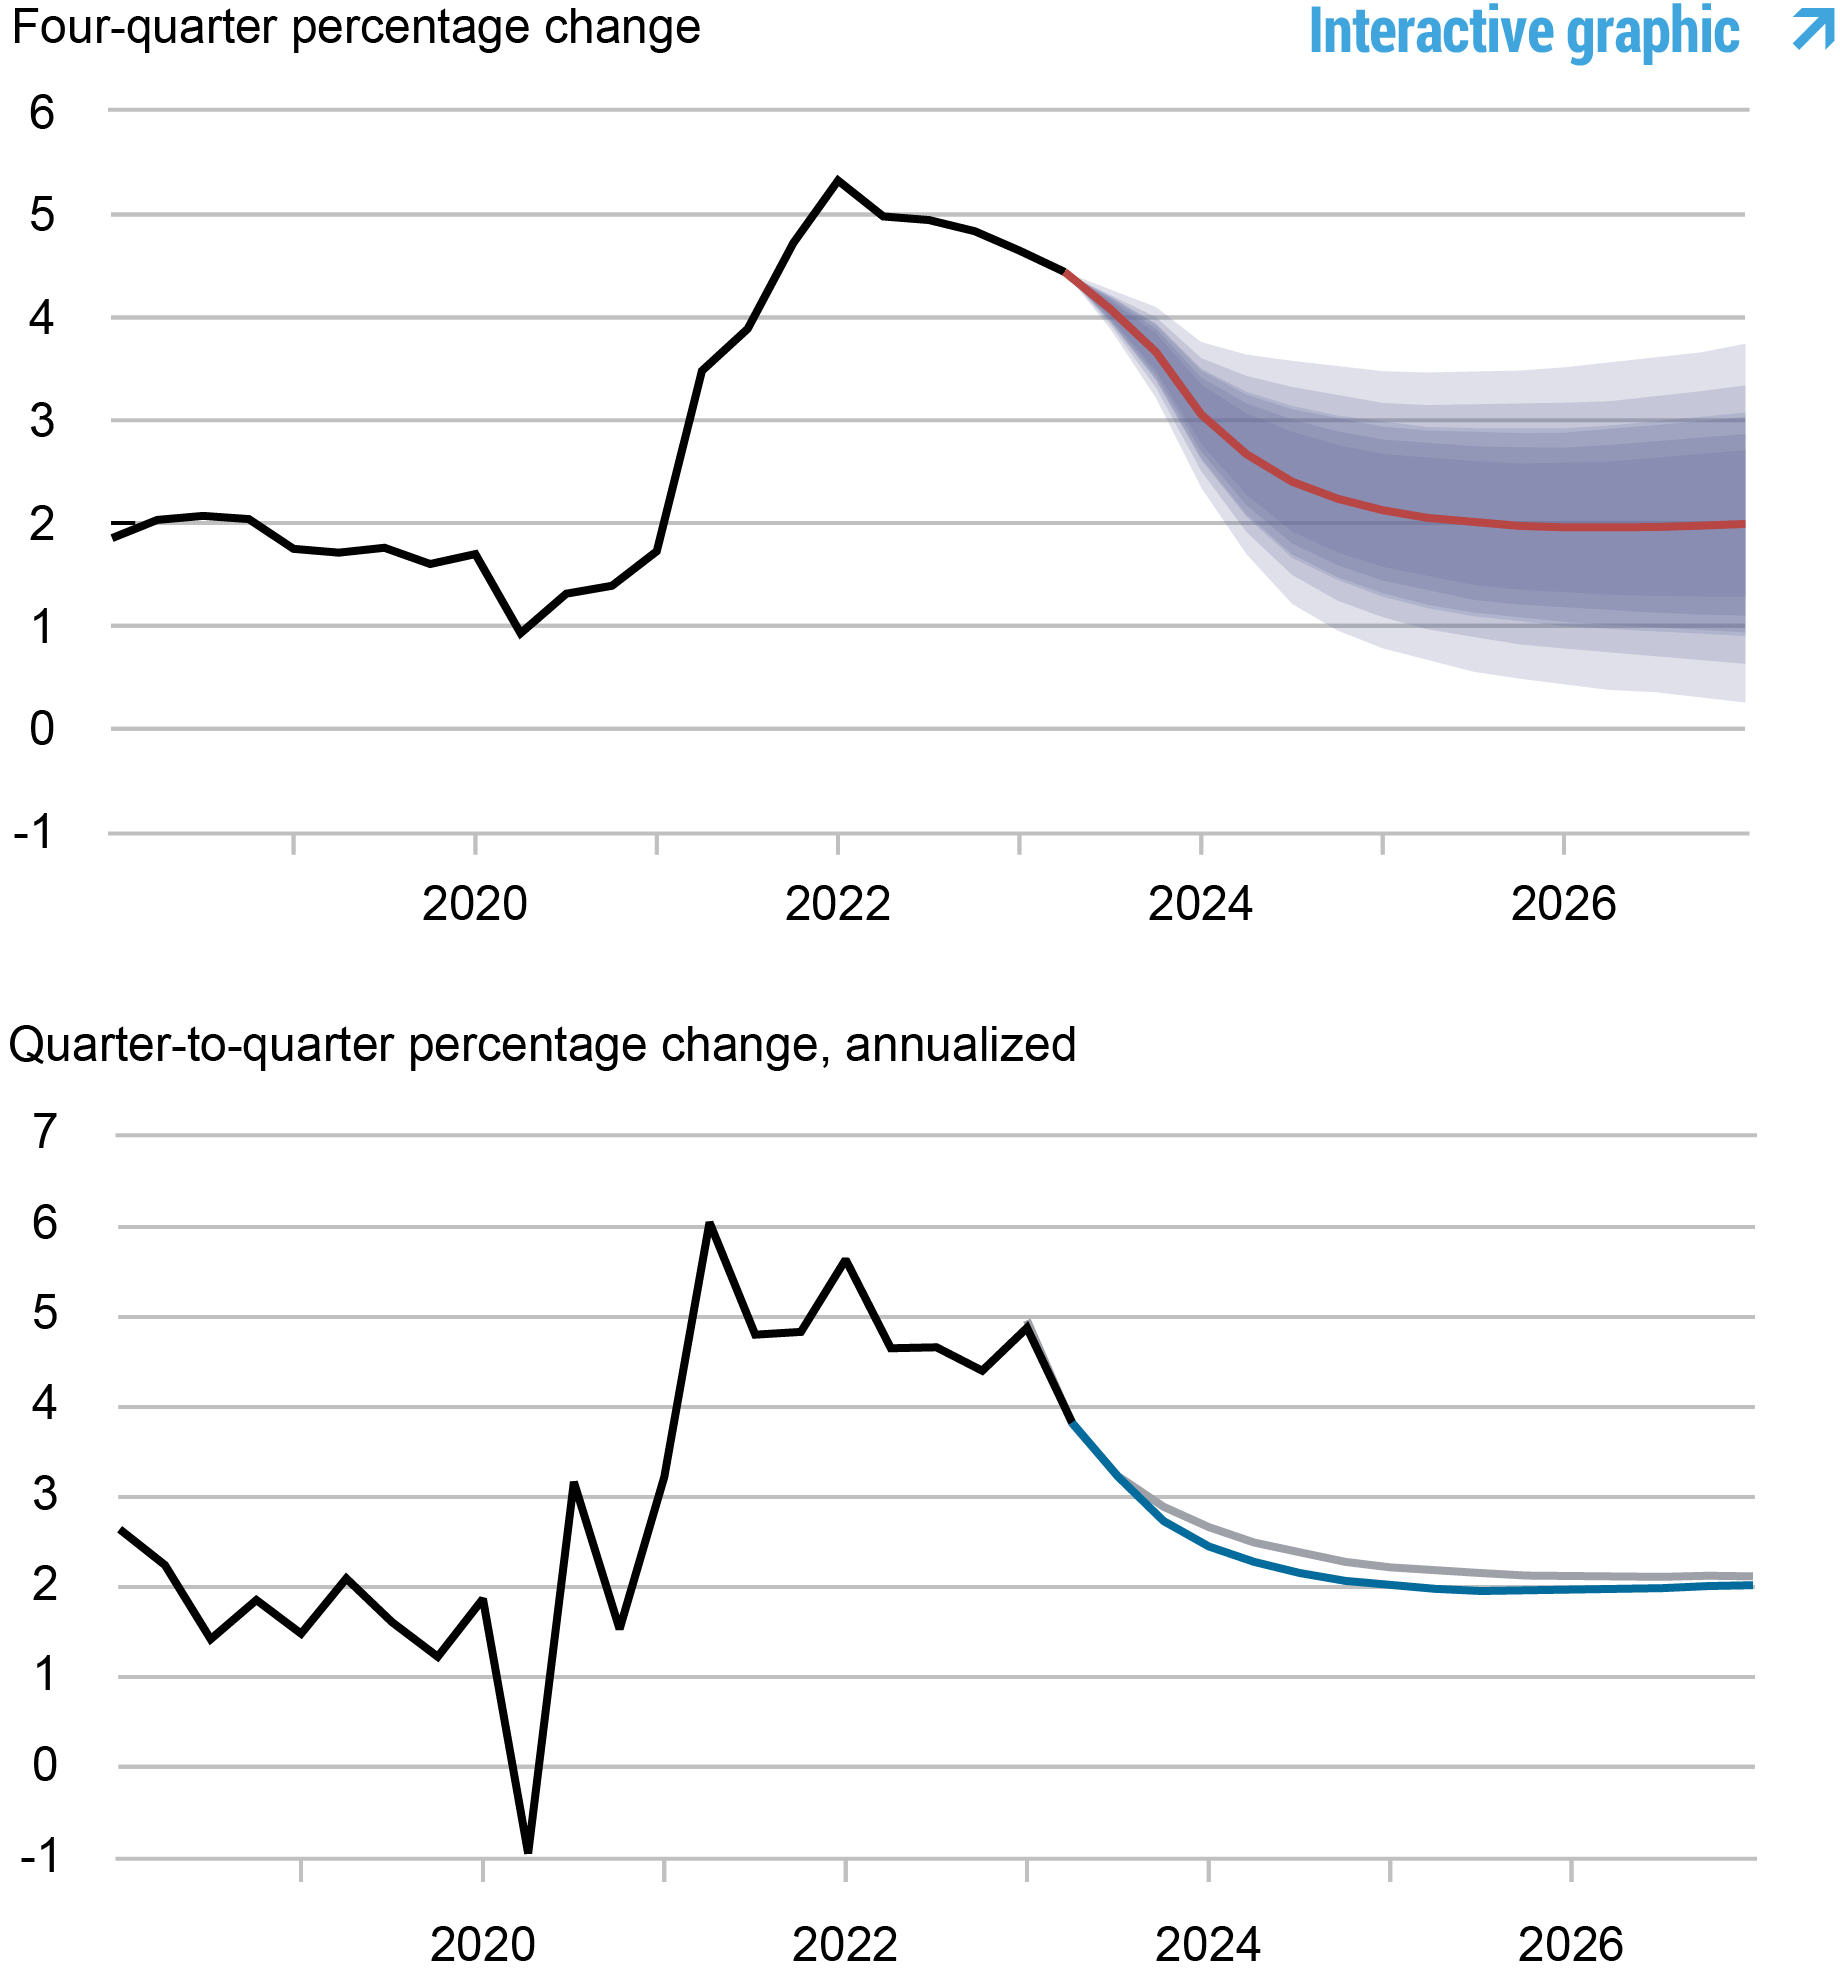
Source: Authors’ calculations.
Notes: These two panels depict core personal consumption expenditures (PCE) inflation. In the top panel, the black line indicates actual data and the red line shows the model forecasts. The shaded areas mark the uncertainty associated with our forecasts at 50, 60, 70, 80, and 90 percent probability intervals. In the bottom panel, the blue line shows the current forecast (quarter-to-quarter, annualized), and the gray line shows the June 2023 forecast.
Real Natural Rate of Interest
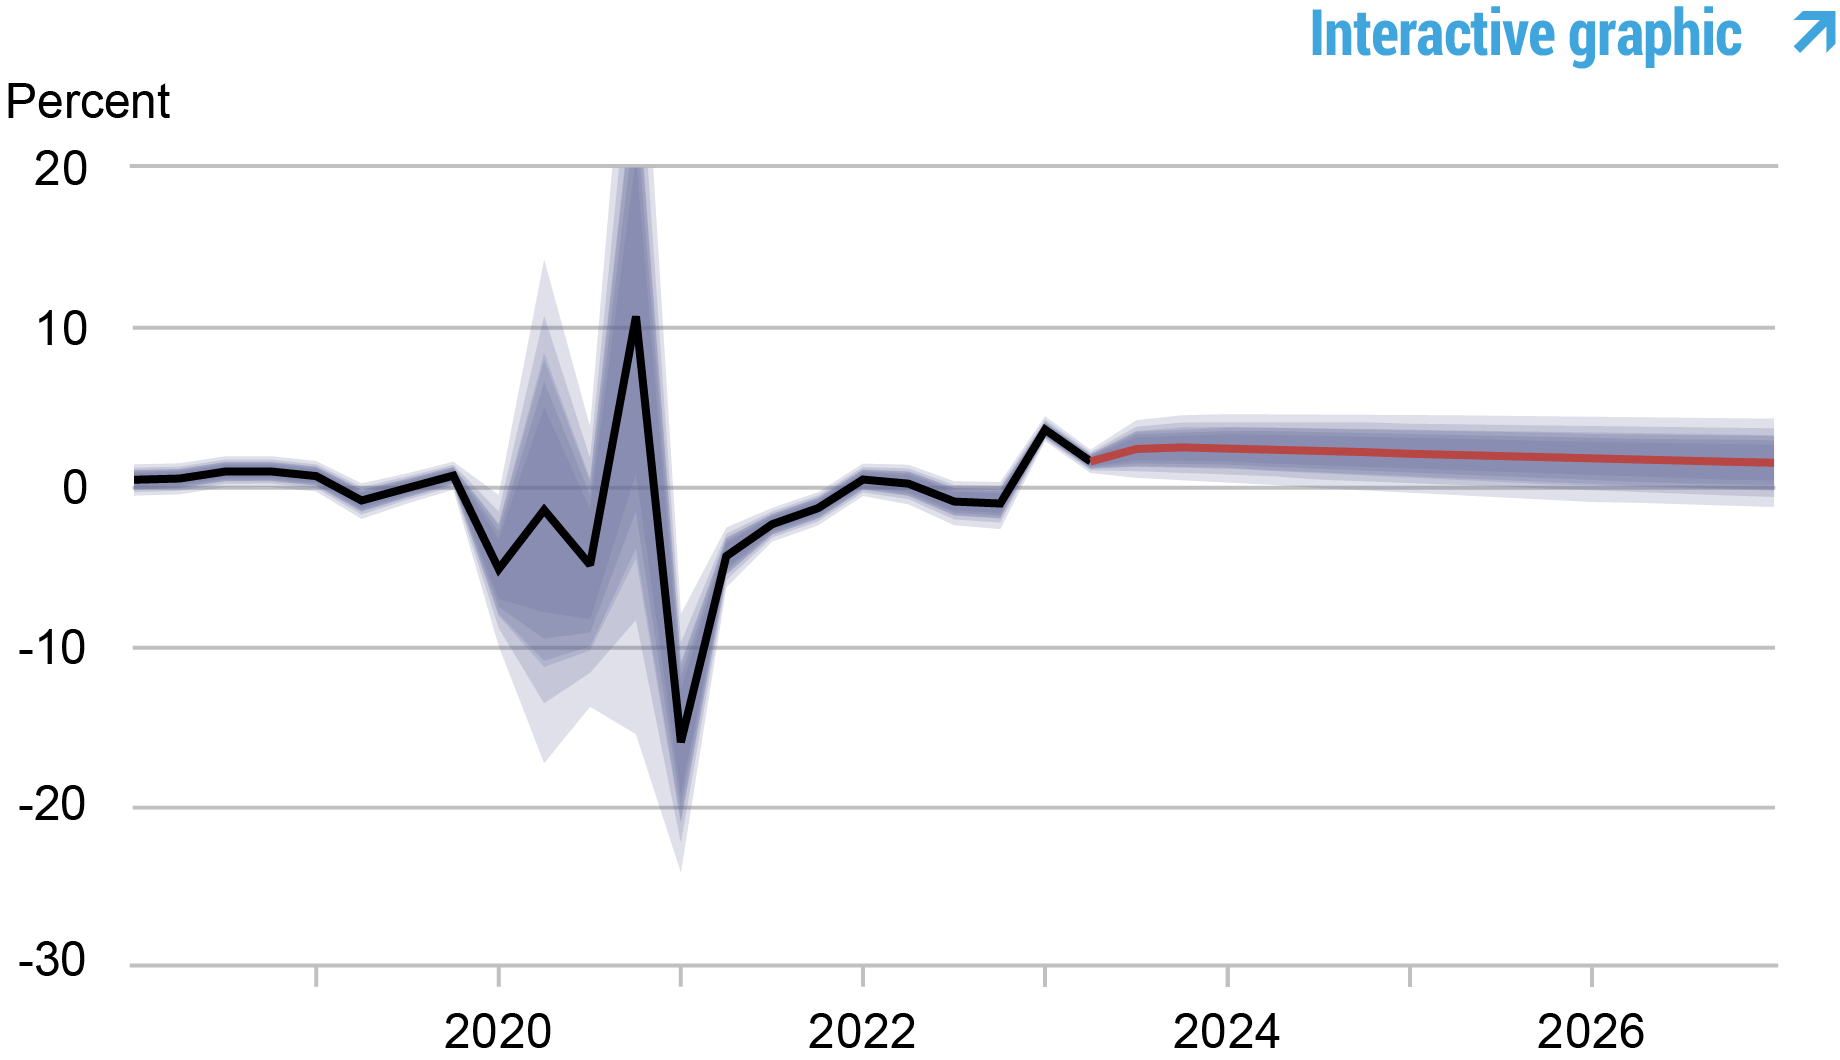
Source: Authors’ calculations.
Notes: The black line shows the model’s mean estimate of the real natural rate of interest; the red line shows the model forecast of the real natural rate. The shaded area marks the uncertainty associated with the forecasts at 50, 60, 70, 80, and 90 percent probability intervals.
Marco Del Negro is an economic research advisor in Macroeconomic and Monetary Studies in the Federal Reserve Bank of New York’s Research and Statistics Group.

Pranay Gundam is a research analyst in the Federal Reserve Bank of New York’s Research and Statistics Group.
Donggyu Lee is a research economist in Macroeconomic and Monetary Studies in the Federal Reserve Bank of New York’s Research and Statistics Group.

Ramya Nallamotu is a research analyst in the Federal Reserve Bank of New York’s Research and Statistics Group.

Brian Pacula is a research analyst in the Federal Reserve Bank of New York’s Research and Statistics Group.
How to cite this post:
Marco Del Negro, Pranay Gundam, Donggyu Lee, Ramya Nallamotu, and Brian Pacula, “The New York Fed DSGE Model Forecast— September 2023,” Federal Reserve Bank of New York Liberty Street Economics, September 22, 2023, https://libertystreeteconomics.newyorkfed.org/2023/09/the-new-york-fed-dsge-model-forecast-september-2023/.


Disclaimer
The views expressed in this post are those of the author(s) and do not necessarily reflect the position of the Federal Reserve Bank of New York or the Federal Reserve System. Any errors or omissions are the responsibility of the author(s).


Argentina Is One of the Most Regulated Countries in the World
In the coming days and weeks, we can expect further, far‐reaching reform proposals that will go through the Argentine congress.

Crypto, Crude, & Crap Stocks Rally As Yield Curve Steepens, Rate-Cut Hopes Soar
Crypto, Crude, & Crap Stocks Rally As Yield Curve Steepens, Rate-Cut Hopes Soar
A weird week of macro data – strong jobless claims but…

Fed Pivot: A Blend of Confidence and Folly
Fed Pivot: Charting a New Course in Economic Strategy Dec 22, 2023 Introduction In the dynamic world of economics, the Federal Reserve, the central bank…
