Economics
The New York Fed DSGE Model Forecast—December 2023
This post presents an update of the economic forecasts generated by the Federal Reserve Bank of New York’s dynamic stochastic general equilibrium (DSGE)…

This post presents an update of the economic forecasts generated by the Federal Reserve Bank of New York’s dynamic stochastic general equilibrium (DSGE) model. We describe very briefly our forecast and its change since September 2023. As usual, we wish to remind our readers that the DSGE model forecast is not an official New York Fed forecast, but only an input to the Research staff’s overall forecasting process. For more information about the model and variables discussed here, see our DSGE model Q & A.
The New York Fed model forecasts use data released through 2023:Q3, augmented for 2023:Q4 with the median forecasts for real GDP growth and core PCE inflation from the November release of the Philadelphia Fed Survey of Professional Forecasters, as well as the yields on 10-year Treasury securities and Baa-rated corporate bonds based on 2023:Q3 averages up to November 21. Starting in 2021:Q4, the expected federal funds rate (FFR) between one and six quarters into the future is restricted to equal the corresponding median point forecast from the latest available Survey of Primary Dealers (SPD) in the corresponding quarter. For the current projection, this is the November SPD.
The economy turned out to be stronger in Q3 than predicted by the model. This forecast error naturally pushes up the output growth forecast for the current year but has only a small impact on projections for activity otherwise. The model expects output growth to be 0.7 percentage points higher in 2023 than forecasted in September (2.6 versus 1.9 percent) but not very different from the September predictions for the rest of the forecast horizon (1.2, 0.7, and 0.9 percent in 2024, 2025, and 2026, versus 1.1, 0.7, and 1.2 percent in September, respectively). The output gap is projected to be somewhat lower in 2023 than was predicted in September, as the model attributes the recent strength of the economy mainly to supply rather than demand factors. The output gap predictions are similar to those made in September for the remainder of the forecast horizon. Inflation projections are lower in 2023 than they were in September (3.4 versus 3.7 percent), mostly because Q3 inflation surprised the model on the downside. The expected path for inflation is unchanged otherwise: 2.2 percent in 2024 and 2.0 percent in 2025 and 2026.
The short-run real natural rate of interest is expected to remain at the same elevated level as projected in September for 2023 (2.5 percent), declining to 2.2 percent in 2024, 1.8 percent in 2025, and 1.6 percent in 2026. The expected path of the policy rate is essentially unchanged relative to September. The model sees monetary policy as being restrictive through the end of 2024 in the sense that the FFR in real terms is above the short-term natural rate of interest.
Forecast Comparison
| Forecast Period | 2023 | 2024 | 2025 | 2026 | ||||
|---|---|---|---|---|---|---|---|---|
| Date of Forecast | Dec 23 | Sep 23 | Dec 23 | Sep 23 | Dec 23 | Sep 23 | Dec 23 | Sep 23 |
| GDP growth (Q4/Q4) |
2.6 (2.2, 3.0) |
1.9 (0.2, 3.6) |
1.2 (-3.8, 6.2) |
1.1 (-4.0, 6.3) |
0.7 (-4.3, 5.7) |
0.7 (-4.4, 5.8) |
0.9 (-4.5, 6.3) |
1.2 (-4.2, 6.6) |
| Core PCE inflation (Q4/Q4) |
3.4 (3.3, 3.5) |
3.7 (3.4, 3.9) |
2.2 (1.5, 2.9) |
2.2 (1.5, 3.0) |
2.0 (1.1, 2.9) |
2.0 (1.1, 2.9) |
2.0 (1.0, 3.0) |
2.0 (1.0, 3.0) |
| Real natural rate of interest (Q4) |
2.5 (1.4, 3.5) |
2.5 (1.3, 3.7) |
2.2 (0.8, 3.6) |
2.2 (0.8, 3.7) |
1.8 (0.3, 3.3) |
1.9 (0.3, 3.4) |
1.6 (0.0, 3.2) |
1.6 (0.0, 3.3) |
Notes: This table lists the forecasts of output growth, core PCE inflation, and the real natural rate of interest from the December 2023 and September 2023 forecasts. The numbers outside parentheses are the mean forecasts, and the numbers in parentheses are the 68 percent bands.
Forecasts of Output Growth
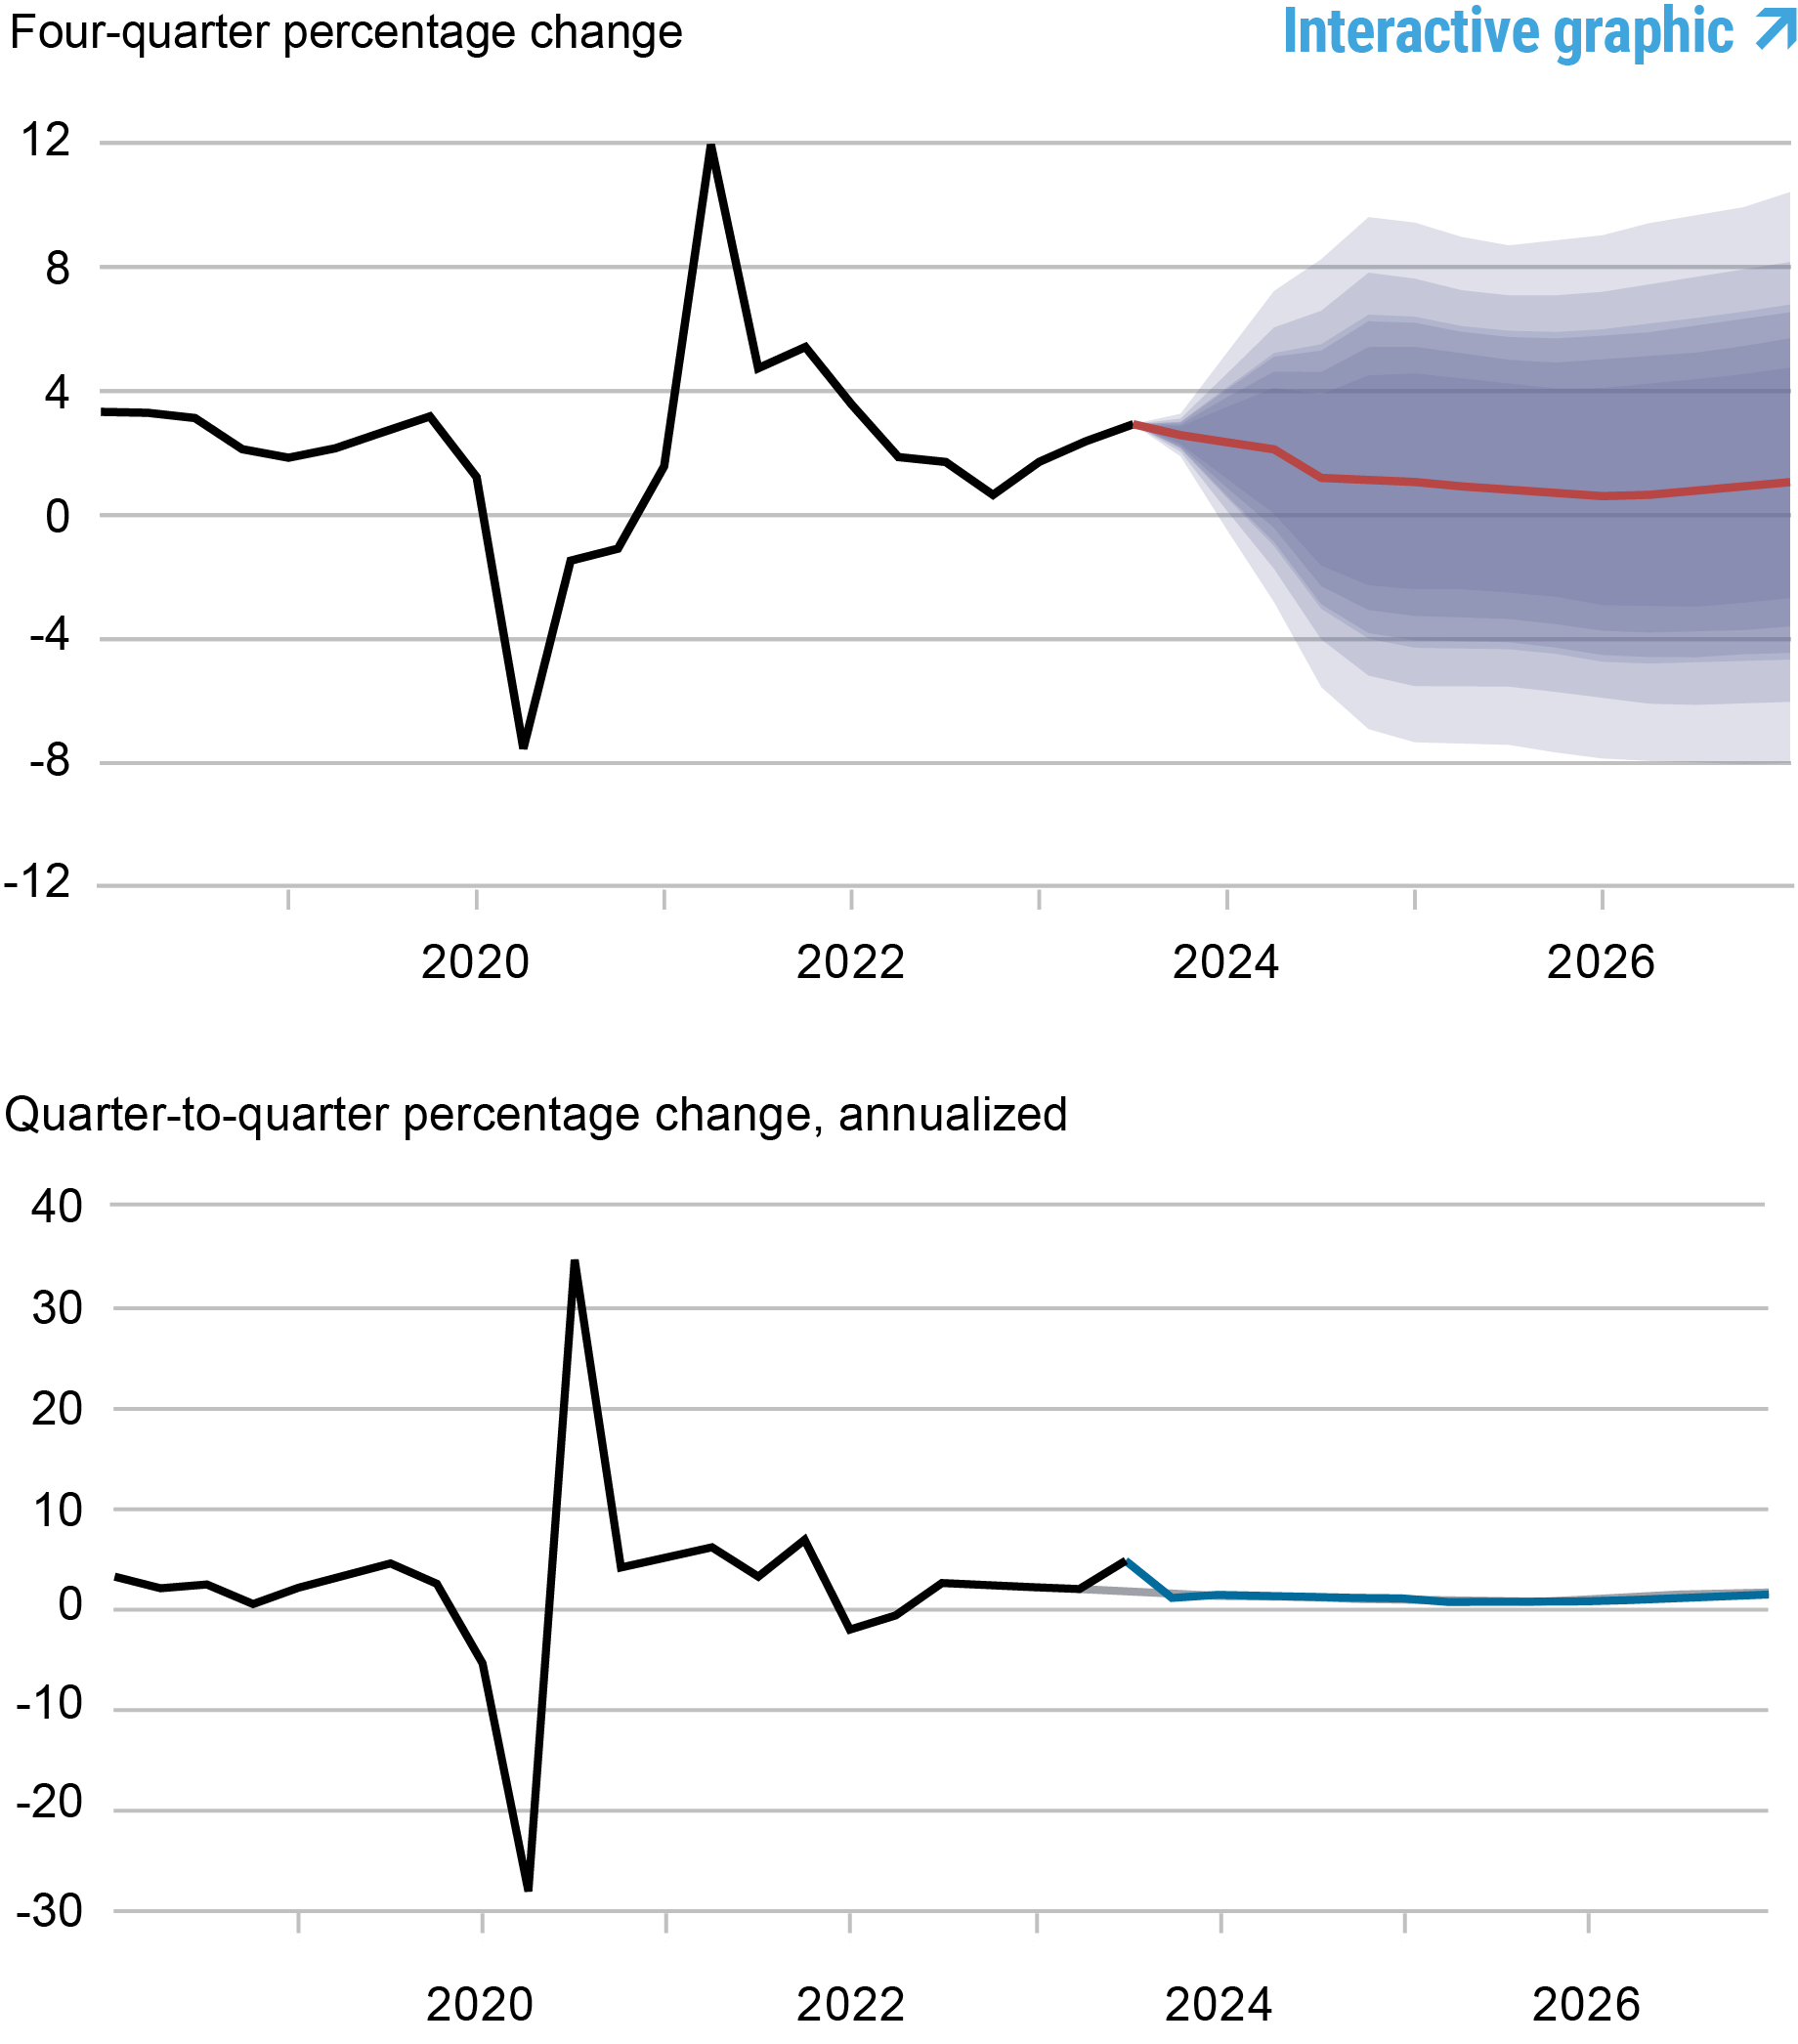
Notes: These two panels depict output growth. In the top panel, the black line indicates actual data and the red line shows the model forecasts. The shaded areas mark the uncertainty associated with our forecasts at 50, 60, 70, 80, and 90 percent probability intervals. In the bottom panel, the blue line shows the current forecast (quarter-to-quarter, annualized), and the gray line shows the September 2023 forecast.
Forecasts of Inflation
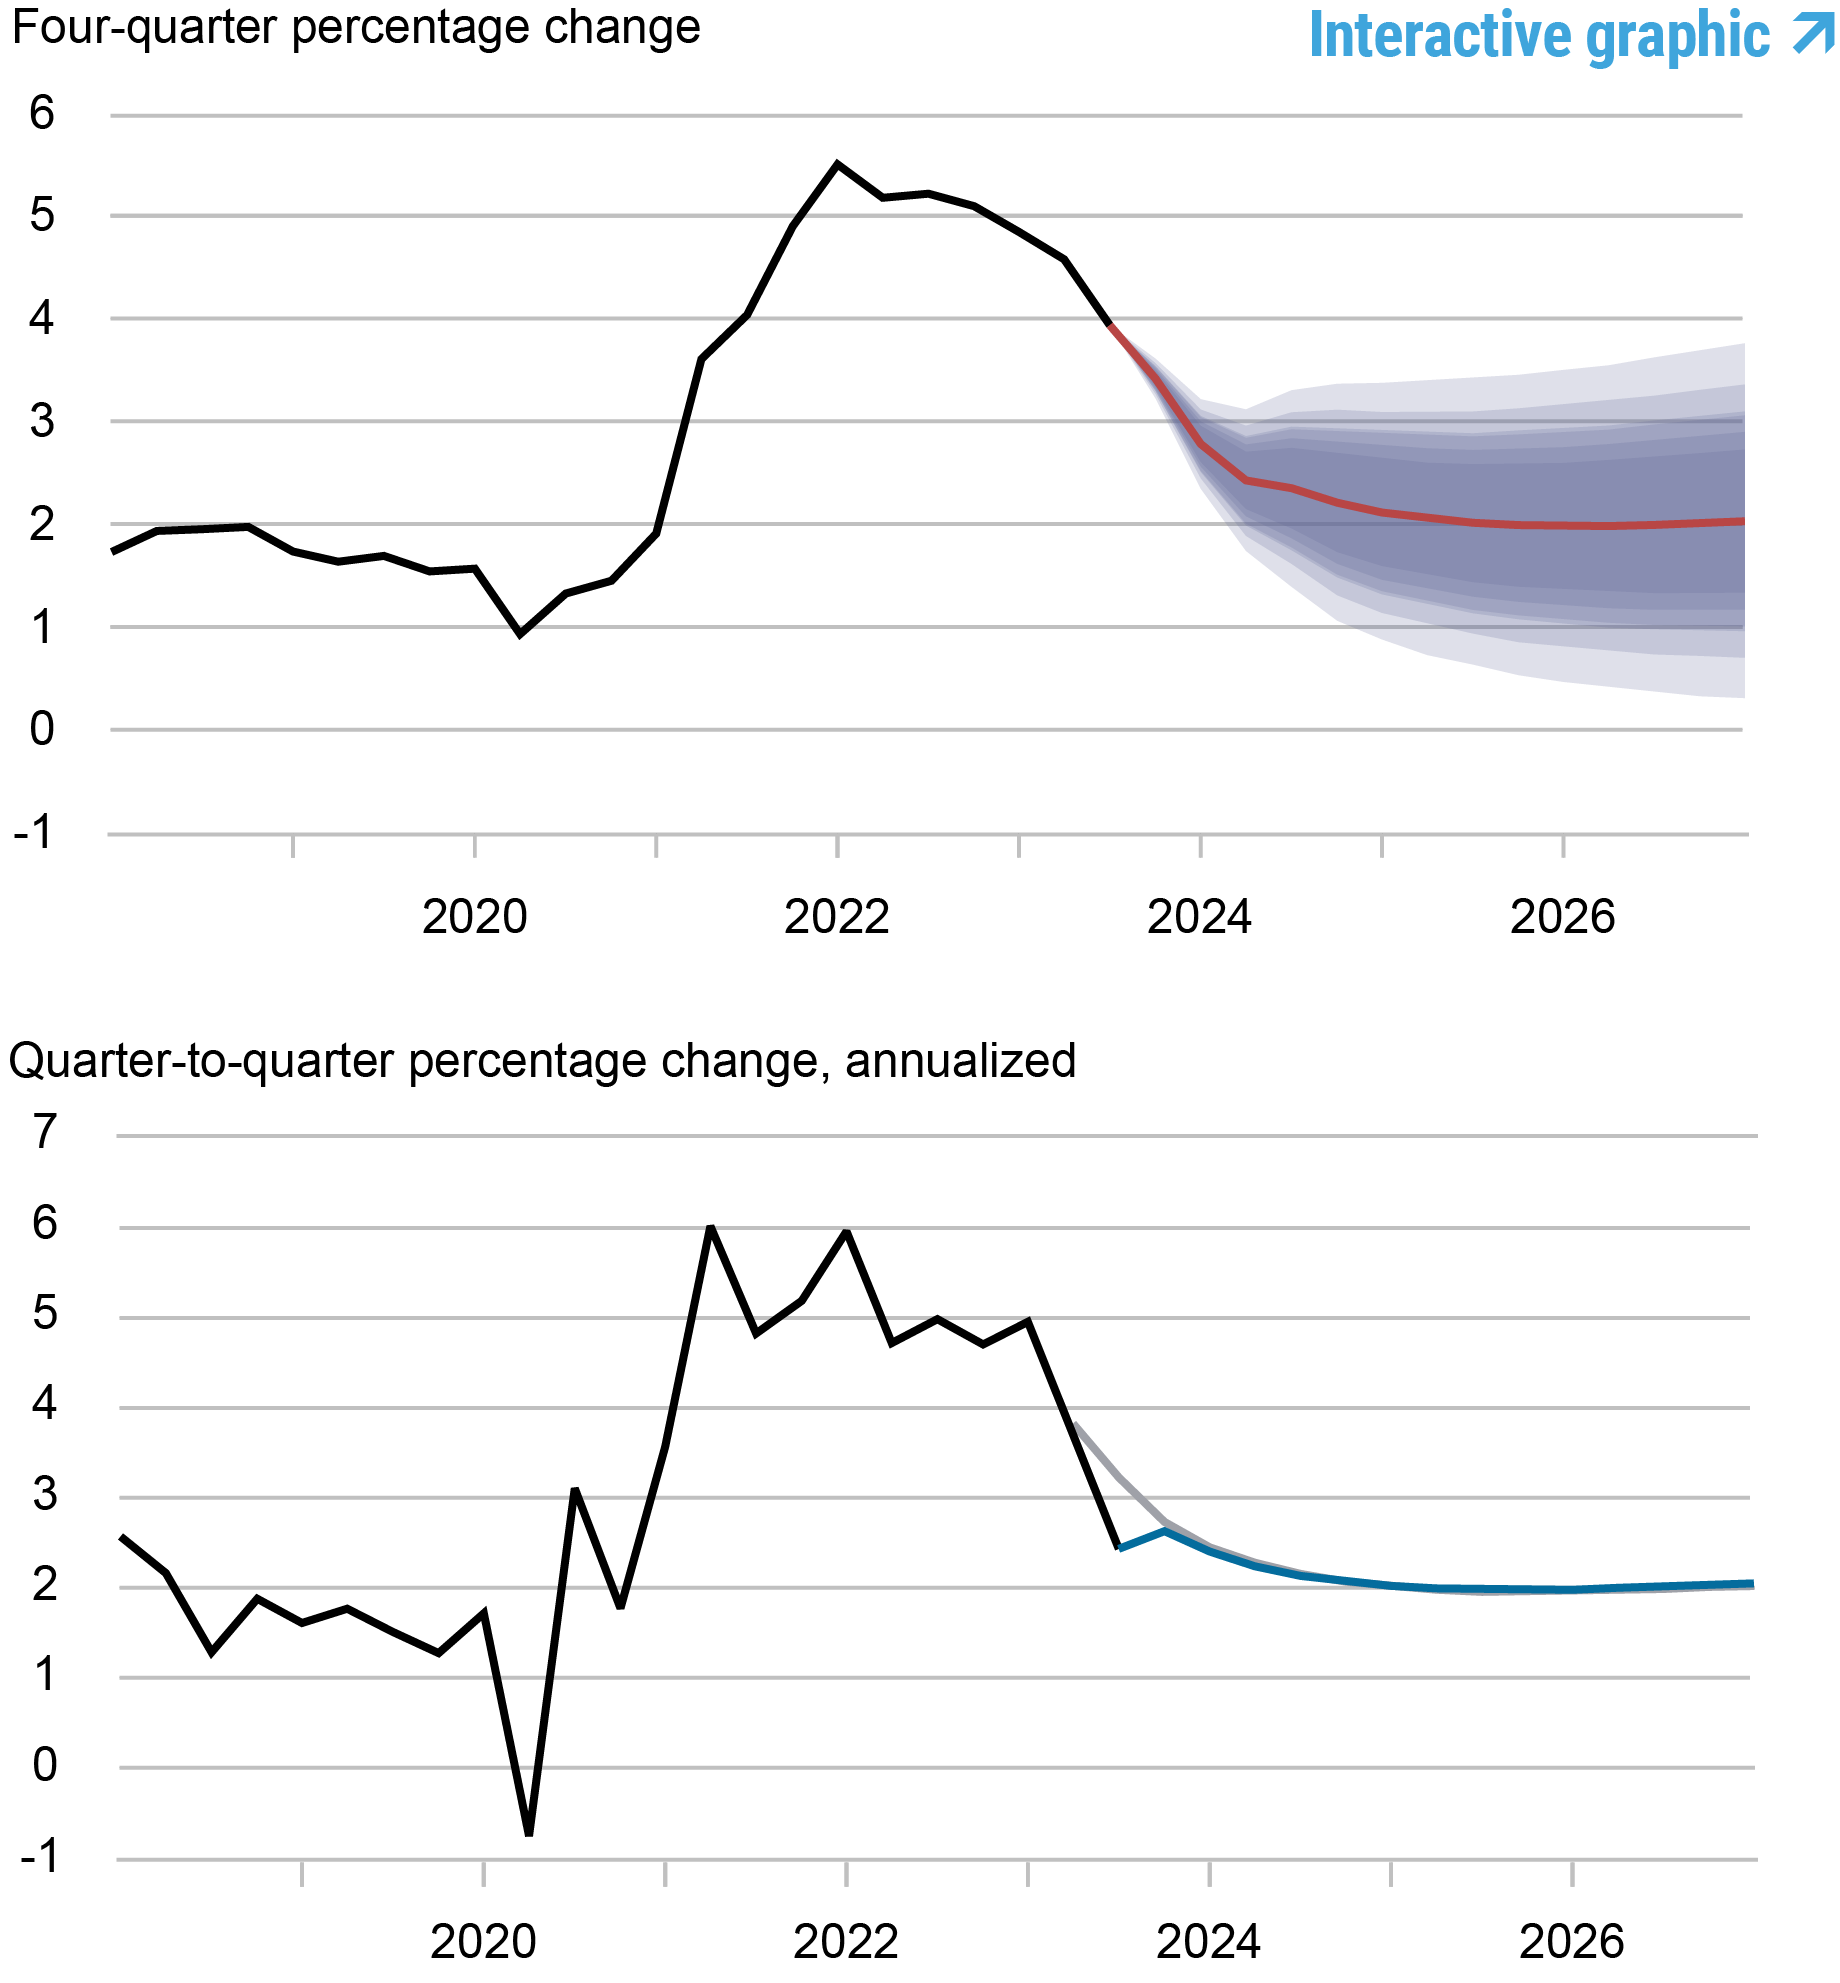
Notes: These two panels depict core personal consumption expenditures (PCE) inflation. In the top panel, the black line indicates actual data and the red line shows the model forecasts. The shaded areas mark the uncertainty associated with our forecasts at 50, 60, 70, 80, and 90 percent probability intervals. In the bottom panel, the blue line shows the current forecast (quarter-to-quarter, annualized), and the gray line shows the September 2023 forecast.
Real Natural Rate of Interest
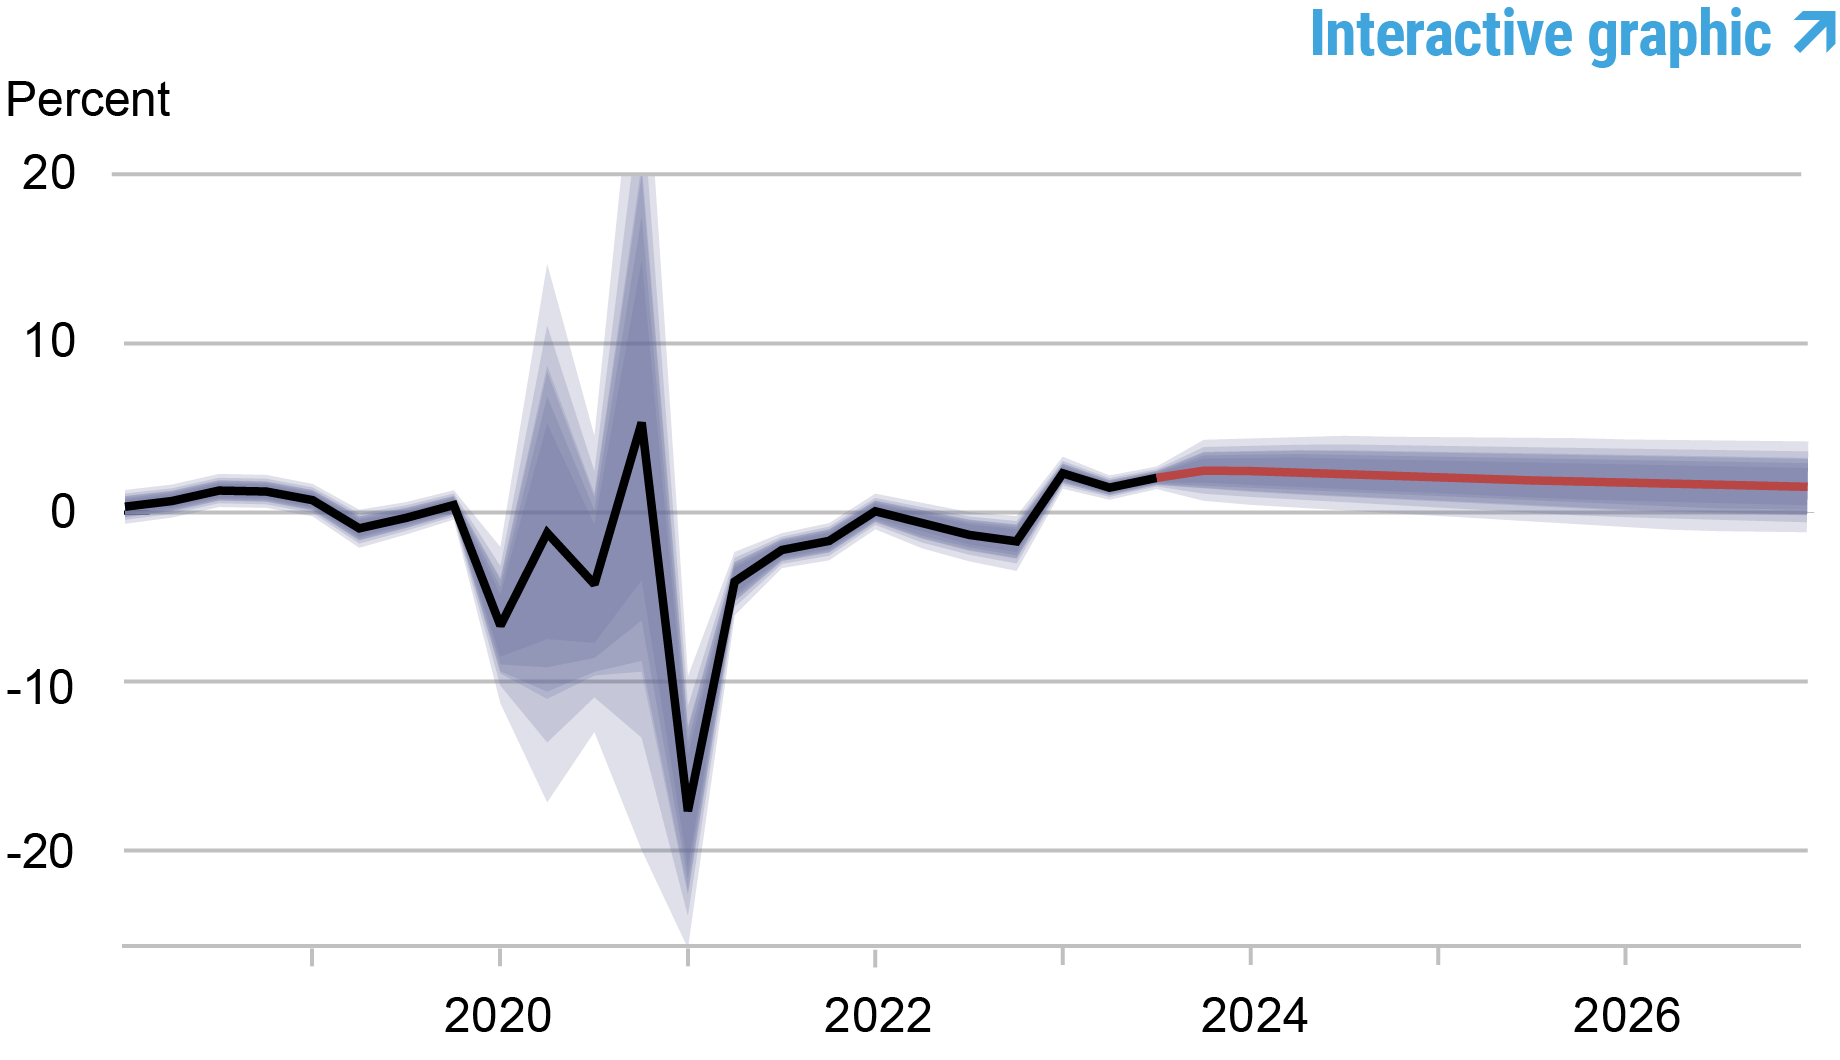
Notes: The black line shows the model’s mean estimate of the real natural rate of interest; the red line shows the model forecast of the real natural rate. The shaded area marks the uncertainty associated with the forecasts at 50, 60, 70, 80, and 90 percent probability intervals.
Marco Del Negro is an economic research advisor in Macroeconomic and Monetary Studies in the Federal Reserve Bank of New York’s Research and Statistics Group.

Pranay Gundam is a research analyst in the Federal Reserve Bank of New York’s Research and Statistics Group.
Donggyu Lee is a research economist in Macroeconomic and Monetary Studies in the Federal Reserve Bank of New York’s Research and Statistics Group.

Ramya Nallamotu is a senior research analyst in the Federal Reserve Bank of New York’s Research and Statistics Group.

Brian Pacula is a research analyst in the Federal Reserve Bank of New York’s Research and Statistics Group.
How to cite this post:
Marco Del Negro, Pranay Gundam, Donggyu Lee, Ramya Nallamotu, and Brian Pacula, “The New York Fed DSGE Model Forecast—December 2023,” Federal Reserve Bank of New York Liberty Street Economics, December 15, 2023, https://libertystreeteconomics.newyorkfed.org/2023/12/the-new-york-fed-dsge-model-forecast-december-2023/.


Disclaimer
The views expressed in this post are those of the author(s) and do not necessarily reflect the position of the Federal Reserve Bank of New York or the Federal Reserve System. Any errors or omissions are the responsibility of the author(s).


Argentina Is One of the Most Regulated Countries in the World
In the coming days and weeks, we can expect further, far‐reaching reform proposals that will go through the Argentine congress.

Crypto, Crude, & Crap Stocks Rally As Yield Curve Steepens, Rate-Cut Hopes Soar
Crypto, Crude, & Crap Stocks Rally As Yield Curve Steepens, Rate-Cut Hopes Soar
A weird week of macro data – strong jobless claims but…

Fed Pivot: A Blend of Confidence and Folly
Fed Pivot: Charting a New Course in Economic Strategy Dec 22, 2023 Introduction In the dynamic world of economics, the Federal Reserve, the central bank…


